
Reports
Reports
Analysts’ Viewpoint on Energy Measurement IC Market Scenario
The global energy measurement IC market is growing due to the increase in usage of polyphase meters, industrial instruments, and power meter ICs; and the need for monitoring energy consumption in order to reach carbon neutrality. Rapid usage of smart meters is also fueling the global market. Modern energy measuring ICs offer utility companies real-time data and actionable insights on meter accuracy over time, meter malfunction, and improved tamper detection, owing to emergence of new technologies such as cloud analytics. Key players are collaborating with top utilities and meter manufacturing businesses to build next-generation electricity meters and integrate cloud analytics services to control meter health. This is encouraging energy measurement IC manufacturers to introduce innovative products such as self-calibrating energy metering ICs.
Energy measuring IC is used for high-accuracy electrical energy measurement in single, dual, and three phase power line systems. It can calculate active, reactive, and apparent energy as well as instantaneous RMS voltage and current, and measure line voltage and current. Energy measurement ICs help address difficulties of next-generation smart meter systems. Future market demand for energy measurement ICs is expected to be high owing to the increase in technological advancements in electric metering, substation automation, and emerging applications such as solar/wind generation and energy storage.
The energy sector has evolved technologically by incorporating renewable energy sources such as wind and solar. Bidirectional flow of energy, intermittent generation from renewable sources, unequal distribution of electrical power, and noise emission on power lines are among the new challenges for the energy sector. These challenges can affect the stability of the network. Therefore, energy distribution firms are implementing smart meters to enable real-time network diagnostics and fast fault identification in order to guarantee uninterrupted and quality service to end customers. This is fueling the global smart meter and smart plug market.
Smart electricity meter is an essential part of the energy distribution network. It can monitor electricity consumption and gather information on the quality of the power being supplied. For instance, it can measure reactive energy, total harmonic distortion, harmonic content, voltage transients and surges, and frequency variations. Smart meters can monitor meter health, eliminate the necessity for interventions in cases of actual failure, and prevent fraud. Energy metering ICs are suitable for measuring active energy (kWh), apparent energy (kVA), reactive energy (kVAR), RMS, and power quality in single phase and polyphase revenue meters with the highest accuracy. Thus, rise in usage of smart meters is propelling the revenue of energy measurement IC manufacturers.
The shift toward electric mobility is an effective way to reduce carbon emissions in the transportation industry. Reliable and accessible network of EV charging infrastructure is necessary for the quick adoption of electrical vehicles. Governments of various countries have enacted policies to encourage the growth of the charging infrastructure network. Consequently, demand for electric vehicles is rising across the globe. EV charging stations are now available at public places, private households, and even at business and residential structures such as offices and condos.
Energy measurement IC is exclusively deployed in EV charger wall boxes. Its modular design provides a range of connectivity options, from Wi-Fi and LTE to PLC, with the potential to add more interfaces owing to its support for MODBUS and Ethernet and Bluetooth Low Energy (LE). Furthermore, these ICs are used in swappable battery charging systems.
Several developing economies are promoting the adoption of electric vehicles. According to the Bureau of Energy Efficiency (BEE), the number of electric vehicles in India stood at 10,76,420 as of March 2022. The number of Public Charging Stations (PCS) were around 1,742 during the period. Thus, rise in adoption of EV vehicles and charging stations is augmenting the power monitoring market.
In terms of phase, the global energy measurement IC market has been classified into single phase and polyphase. The polyphase segment held significant share of the global market in 2021. It is the fastest growing market for energy measurement IC. Polyphase system is made up of two or more voltages that are offset from one another by an equal electrical angle, but have the same amplitude and frequency. Polyphase electricity meters are widely used in commercial and industrial applications.
Utility companies can benefit from unmatched digital accuracy and reliability as well as a customizable platform, owing to energy measurement ICs for polyphase meters. Thus, utilities find it easier to supply their extensive automated meter reading (AMR) systems to their low- and mid-tier commercial and industrial customers.
In terms of application, the global energy measurement IC market has been classified into smart plugs, energy meters, solar inverters, Smart Power Distribution Units (PDU), street lighting, EV charger wall boxes, and others. The solar inverters segment dominated the global market in 2021. It is projected to grow at the fastest CAGR throughout the forecast period.
Significant increase in energy consumption is adversely affecting the environment and energy security. Thus, demand for renewable sources of energy, such as solar, has been rising across the globe. Smart energy meters play a key role in solar energy networks. Smart energy meters can communicate with utilities and end-users to share detailed information about how energy is utilized and the status of the energy network. They can also measure the energy flow. Energy management ICs used in smart meters are suitable for applications such as power monitoring of grid-connected cabinets for distributed photovoltaic power cabinets and energy demand management. These ICs measure single-phase or three-phase current, voltage, active power, reactive power, and apparent power in solar inverters.
Asia Pacific held the largest share of approximately 38.6% of the global energy measurement IC market in 2021 owing to the presence of key market players and technological advancements in the region. China, India, and Japan present lucrative opportunities for manufacturers of energy measurement ICs. China dominates the market in Asia Pacific owing to its highest smart meter installation in terms of volume. The country is investing significantly in the power grid sector. It plans to invest around US$ 896 Bn in power grids and related industries from 2021 to 2025. Thus, rise in investment in smart grids and smart city projects, and increase in data centers and IT hubs are augmenting the energy measurement IC market in Asia Pacific.
The market in Europe and North America is also growing significantly due to the rapid increase in installation of smart meters in these regions. Around 75% of U.S. households have adopted smart meters, while 42% of meters in the U.K. are now smart or advanced meters. Thus, growth in electricity meters (smart meters) market is fueling the energy measurement IC market in these regions.
The global energy measurement IC market is consolidated, with a number of large-scale vendors controlling majority of the share. Most of the firms are investing significantly in comprehensive research and development activities, including new product development. Expansion of product portfolios and mergers and acquisitions are major strategies adopted by the key players. Analog Devices, Inc., Arch Meter Corporation, Cirrus Logic, Inc., Microchip Technology Inc., NXP Semiconductors N.V., Renesas Electronics Corporation, Shanghai Belling Corp., Ltd., Shenzhen Heliwei Technology Co., Ltd., STMicroelectronics N.V., and Texas Instruments Incorporated are the prominent players operating in the global energy measurement IC market.
Each of these players has been profiled in the market report based on parameters such as company overview, financial overview, business strategies, product portfolio, business segments, and recent developments in the energy measurement IC market.
|
Attribute |
Detail |
|
Market Size Value in 2021 |
US$ 4.26 Bn |
|
Market Forecast Value in 2031 |
US$ 8.39 Bn |
|
Growth Rate (CAGR) |
7.4% |
|
Forecast Period |
2022–2031 |
|
Historical Data Available for |
2017–2020 |
|
Quantitative Units |
US$ Bn for Value and Million Units for Volume |
|
Market Analysis |
It includes cross segment analysis at global as well as regional level. Furthermore, qualitative analysis includes drivers, restraints, opportunities, key trends, Porter’s Five Forces analysis, value chain analysis, and key trend analysis. |
|
Competition Landscape |
|
|
Format |
Electronic (PDF) + Excel |
|
Market Segmentation |
|
|
Regions Covered |
|
|
Countries Covered |
|
|
Companies Profiled |
|
|
Customization Scope |
Available upon request |
|
Pricing |
Available upon request |
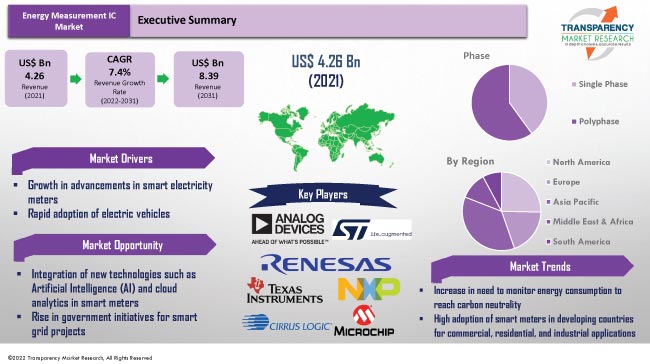
The global energy measurement IC market stood at US$ 4.26 Bn in 2021
The global energy measurement IC market is expected to grow at a CAGR of 7.4% by 2031
The energy measurement IC market is projected to reach US$ 8.39 Bn by 2031
Analog Devices, Inc., Arch Meter Corporation, Cirrus Logic, Inc., Microchip Technology Inc., NXP Semiconductors N.V., Renesas Electronics Corporation, Shanghai Belling Corp., Ltd., STMicroelectronics N.V., and Texas Instruments Incorporated
China accounted for approximately 15.8% share of the global energy measurement IC market in 2021
The polyphase segment held 37.4% share of the energy measurement IC market in 2021
Growth in government initiatives for digitalization of smart grid, increase in need to monitor energy consumption to reach carbon neutrality, and high adoption of smart meters in developing and developed countries for commercial, residential, and industrial applications
Asia Pacific is a more lucrative region of the global energy measurement IC market
1. Preface
1.1. Market Introduction
1.2. Market and Segments Definition
1.3. Market Taxonomy
1.4. Research Methodology
1.5. Assumption and Acronyms
2. Executive Summary
2.1. Global Energy Measurement IC Market Overview
2.2. Regional Outline
2.3. Industry Outline
2.4. Market Dynamics Snapshot
2.5. Competition Blueprint
3. Market Dynamics
3.1. Macroeconomic Factors
3.2. Drivers
3.3. Restraints
3.4. Opportunities
3.5. Key Trends
3.6. Regulatory Framework
4. Associated Industry and Key Indicator Assessment
4.1. Parent Industry Overview – Global Power Management IC Industry Overview
4.2. Supply Chain Analysis
4.3. Pricing Analysis
4.4. Technology Roadmap
4.5. Industry SWOT Analysis
4.6. Porter’s Five Forces Analysis
4.7. COVID-19 Impact and Recovery Analysis
5. Global Energy Measurement IC Market Analysis, by Phase
5.1. Energy Measurement IC Market Size (US$ Bn) and Volume (Million Units) Analysis & Forecast, by Phase, 2017–2031
5.1.1. Single Phase
5.1.2. Polyphase
5.2. Market Attractiveness Analysis, by Phase
6. Global Energy Measurement IC Market Analysis, by Package Type
6.1. Energy Measurement IC Market Size (US$ Bn) and Volume (Million Units) Analysis & Forecast, by Package Type, 2017–2031
6.1.1. QFN (Quad Flatpack No Lead)
6.1.2. TSSOP (Thin Shrink Small Outline Package)
6.1.3. SOIC (Surface Mount Integrated Circuit Package)
6.1.4. QFP (Quad Flat Package)
6.1.5. Others
6.2. Market Attractiveness Analysis, by Package Type
7. Global Energy Measurement IC Market Analysis, by Application
7.1. Energy Measurement IC Market Size (US$ Bn) Analysis & Forecast, by Application, 2017–2031
7.1.1. Smart Plugs
7.1.2. Energy Meters
7.1.3. Solar Inverters
7.1.4. Smart Power Distribution Units (PDU)
7.1.5. Street Lighting
7.1.6. EV Charger Wall Boxes
7.1.7. Others
7.2. Market Attractiveness Analysis, by Application
8. Global Energy Measurement IC Market Analysis, by End-use Industry
8.1. Energy Measurement IC Market Size (US$ Bn) Analysis & Forecast, by End-use Industry, 2017–2031
8.1.1. Energy & Utility
8.1.2. Automotive
8.1.3. Industrial
8.1.4. Consumer Electronics
8.1.5. IT & Telecommunication
8.1.6. Others
8.2. Market Attractiveness Analysis, by End-use Industry
9. Global Energy Measurement IC Market Analysis and Forecast, by Region
9.1. Energy Measurement IC Market Size (US$ Bn) and Volume (Million Units) Analysis & Forecast, by Region, 2017–2031
9.1.1. North America
9.1.2. Europe
9.1.3. Asia Pacific
9.1.4. Middle East & Africa
9.1.5. South America
9.2. Market Attractiveness Analysis, by Region
10. North America Energy Measurement IC Market Analysis and Forecast
10.1. Market Snapshot
10.2. Drivers and Restraints: Impact Analysis
10.3. Energy Measurement IC Market Size (US$ Bn) and Volume (Million Units) Analysis & Forecast, by Phase, 2017–2031
10.3.1. Single Phase
10.3.2. Polyphase
10.4. Electronic Energy Measurement IC Market Size (US$ Bn) and Volume (Million Units) Analysis & Forecast, by Package Type, 2017–2031
10.4.1. QFN (Quad Flatpack No Lead)
10.4.2. TSSOP (Thin Shrink Small Outline Package)
10.4.3. SOIC (Surface Mount Integrated Circuit Package)
10.4.4. QFP (Quad Flat Package)
10.4.5. Others
10.5. Others Energy Measurement IC Market Size (US$ Bn) Analysis & Forecast, by Application, 2017–2031
10.5.1. Smart Plugs
10.5.2. Energy Meters
10.5.3. Solar Inverters
10.5.4. Smart Power Distribution Units (PDU)
10.5.5. Street Lighting
10.5.6. EV Charger Wall Boxes
10.5.7. Others
10.6. Energy Measurement IC Market Size (US$ Bn) Analysis & Forecast, by End-use Industry, 2017–2031
10.6.1. Energy & Utility
10.6.2. Automotive
10.6.3. Industrial
10.6.4. Consumer Electronics
10.6.5. IT & Telecommunication
10.6.6. Others
10.7. Energy Measurement IC Market Size (US$ Bn) and Volume (Million Units) Analysis & Forecast, by Country and Sub-region, 2017–2031
10.7.1. The U.S.
10.7.2. Canada
10.7.3. Rest of North America
10.8. Market Attractiveness Analysis
10.8.1. By Phase
10.8.2. By Package Type
10.8.3. By Application
10.8.4. By End-use Industry
10.8.5. By Country/Sub-region
11. Europe Energy Measurement IC Market Analysis and Forecast
11.1. Market Snapshot
11.2. Drivers and Restraints: Impact Analysis
11.3. Energy Measurement IC Market Size (US$ Bn) and Volume (Million Units) Analysis & Forecast, by Phase, 2017–2031
11.3.1. Single Phase
11.3.2. Polyphase
11.4. Electronic Energy Measurement IC Market Size (US$ Bn) and Volume (Million Units) Analysis & Forecast, by Package Type, 2017–2031
11.4.1. QFN (Quad Flatpack No Lead)
11.4.2. TSSOP (Thin Shrink Small Outline Package)
11.4.3. SOIC (Surface Mount Integrated Circuit Package)
11.4.4. QFP (Quad Flat Package)
11.4.5. Others
11.5. Others Energy Measurement IC Market Size (US$ Bn) Analysis & Forecast, by Application, 2017–2031
11.5.1. Smart Plugs
11.5.2. Energy Meters
11.5.3. Solar Inverters
11.5.4. Smart Power Distribution Units (PDU)
11.5.5. Street Lighting
11.5.6. EV Charger Wall Boxes
11.5.7. Others
11.6. Energy Measurement IC Market Size (US$ Bn) Analysis & Forecast, by End-use Industry, 2017–2031
11.6.1. Energy & Utility
11.6.2. Automotive
11.6.3. Industrial
11.6.4. Consumer Electronics
11.6.5. IT & Telecommunication
11.6.6. Others
11.7. Energy Measurement IC Market Size (US$ Bn) and Volume (Million Units) Analysis & Forecast, by Country and Sub-region, 2017–2031
11.7.1. The U.K.
11.7.2. Germany
11.7.3. France
11.7.4. Rest of Europe
11.8. Market Attractiveness Analysis
11.8.1. By Phase
11.8.2. By Package Type
11.8.3. By Application
11.8.4. By End-use Industry
11.8.5. By Country/Sub-region
12. Asia Pacific Energy Measurement IC Market Analysis and Forecast
12.1. Market Snapshot
12.2. Drivers and Restraints: Impact Analysis
12.3. Energy Measurement IC Market Size (US$ Bn) and Volume (Million Units) Analysis & Forecast, by Phase, 2017–2031
12.3.1. Single Phase
12.3.2. Polyphase
12.4. Electronic Energy Measurement IC Market Size (US$ Bn) and Volume (Million Units) Analysis & Forecast, by Package Type, 2017–2031
12.4.1. QFN (Quad Flatpack No Lead)
12.4.2. TSSOP (Thin Shrink Small Outline Package)
12.4.3. SOIC (Surface Mount Integrated Circuit Package)
12.4.4. QFP (Quad Flat Package)
12.4.5. Others
12.5. Others Energy Measurement IC Market Size (US$ Bn) Analysis & Forecast, by Application, 2017–2031
12.5.1. Smart Plugs
12.5.2. Energy Meters
12.5.3. Solar Inverters
12.5.4. Smart Power Distribution Units (PDU)
12.5.5. Street Lighting
12.5.6. EV Charger Wall Boxes
12.5.7. Others
12.6. Energy Measurement IC Market Size (US$ Bn) Analysis & Forecast, by End-use Industry, 2017–2031
12.6.1. Energy & Utility
12.6.2. Automotive
12.6.3. Industrial
12.6.4. Consumer Electronics
12.6.5. IT & Telecommunication
12.6.6. Others
12.7. Energy Measurement IC Market Size (US$ Bn) and Volume (Million Units) Analysis & Forecast, by Country and Sub-region, 2017–2031
12.7.1. China
12.7.2. Japan
12.7.3. India
12.7.4. South Korea
12.7.5. ASEAN
12.7.6. Rest of Asia Pacific
12.8. Market Attractiveness Analysis
12.8.1. By Phase
12.8.2. By Package Type
12.8.3. By Application
12.8.4. By End-use Industry
12.8.5. By Country/Sub-region
13. Middle East & Africa Energy Measurement IC Market Analysis and Forecast
13.1. Market Snapshot
13.2. Drivers and Restraints: Impact Analysis
13.3. Energy Measurement IC Market Size (US$ Bn) and Volume (Million Units) Analysis & Forecast, by Phase, 2017–2031
13.3.1. Single Phase
13.3.2. Polyphase
13.4. Electronic Energy Measurement IC Market Size (US$ Bn) and Volume (Million Units) Analysis & Forecast, by Package Type, 2017–2031
13.4.1. QFN (Quad Flatpack No Lead)
13.4.2. TSSOP (Thin Shrink Small Outline Package)
13.4.3. SOIC (Surface Mount Integrated Circuit Package)
13.4.4. QFP (Quad Flat Package)
13.4.5. Others
13.5. Others Energy Measurement IC Market Size (US$ Bn) Analysis & Forecast, by Application, 2017–2031
13.5.1. Smart Plugs
13.5.2. Energy Meters
13.5.3. Solar Inverters
13.5.4. Smart Power Distribution Units (PDU)
13.5.5. Street Lighting
13.5.6. EV Charger Wall Boxes
13.5.7. Others
13.6. Energy Measurement IC Market Size (US$ Bn) Analysis & Forecast, by End-use Industry, 2017–2031
13.6.1. Energy & Utility
13.6.2. Automotive
13.6.3. Industrial
13.6.4. Consumer Electronics
13.6.5. IT & Telecommunication
13.6.6. Others
13.7. Energy Measurement IC Market Size (US$ Bn) and Volume (Million Units) Analysis & Forecast, by Country and Sub-region, 2017–2031
13.7.1. GCC
13.7.2. South Africa
13.7.3. Rest of Middle East & Africa
13.8. Market Attractiveness Analysis
13.8.1. By Phase
13.8.2. By Package Type
13.8.3. By Application
13.8.4. By End-use Industry
13.8.5. By Country/Sub-region
14. South America Energy Measurement IC Market Analysis and Forecast
14.1. Market Snapshot
14.2. Drivers and Restraints: Impact Analysis
14.3. Energy Measurement IC Market Size (US$ Bn) and Volume (Million Units) Analysis & Forecast, by Phase, 2017–2031
14.3.1. Single Phase
14.3.2. Polyphase
14.4. Electronic Energy Measurement IC Market Size (US$ Bn) and Volume (Million Units) Analysis & Forecast, by Package Type, 2017–2031
14.4.1. QFN (Quad Flatpack No Lead)
14.4.2. TSSOP (Thin Shrink Small Outline Package)
14.4.3. SOIC (Surface Mount Integrated Circuit Package)
14.4.4. QFP (Quad Flat Package)
14.4.5. Others
14.5. Others Energy Measurement IC Market Size (US$ Bn) Analysis & Forecast, by Application, 2017–2031
14.5.1. Smart Plugs
14.5.2. Energy Meters
14.5.3. Solar Inverters
14.5.4. Smart Power Distribution Units (PDU)
14.5.5. Street Lighting
14.5.6. EV Charger Wall Boxes
14.5.7. Others
14.6. Energy Measurement IC Market Size (US$ Bn) Analysis & Forecast, by End-use Industry, 2017–2031
14.6.1. Energy & Utility
14.6.2. Automotive
14.6.3. Industrial
14.6.4. Consumer Electronics
14.6.5. IT & Telecommunication
14.6.6. Others
14.7. Energy Measurement IC Market Size (US$ Bn) and Volume (Million Units) Analysis & Forecast, by Country and Sub-region, 2017–2031
14.7.1. Brazil
14.7.2. Rest of South America
14.8. Market Attractiveness Analysis
14.8.1. By Phase
14.8.2. By Package Type
14.8.3. By Application
14.8.4. By End-use Industry
14.8.5. By Country/Sub-region
15. Competition Assessment
15.1. Global Energy Measurement IC Market Competition Matrix - a Dashboard View
15.1.1. Global Energy Measurement IC Market Company Share Analysis, by Value (2021)
15.1.2. Technological Differentiator
16. Company Profiles (Global Manufacturers/Suppliers)
16.1. Analog Devices, Inc.
16.1.1. Overview
16.1.2. Product Portfolio
16.1.3. Sales Footprint
16.1.4. Key Subsidiaries or Distributors
16.1.5. Strategy and Recent Developments
16.1.6. Key Financials
16.2. Arch Meter Corporation
16.2.1. Overview
16.2.2. Product Portfolio
16.2.3. Sales Footprint
16.2.4. Key Subsidiaries or Distributors
16.2.5. Strategy and Recent Developments
16.2.6. Key Financials
16.3. Cirrus Logic, Inc
16.3.1. Overview
16.3.2. Product Portfolio
16.3.3. Sales Footprint
16.3.4. Key Subsidiaries or Distributors
16.3.5. Strategy and Recent Developments
16.3.6. Key Financials
16.4. Microchip Technology Inc.
16.4.1. Overview
16.4.2. Product Portfolio
16.4.3. Sales Footprint
16.4.4. Key Subsidiaries or Distributors
16.4.5. Strategy and Recent Developments
16.4.6. Key Financials
16.5. NXP Semiconductors N.V.
16.5.1. Overview
16.5.2. Product Portfolio
16.5.3. Sales Footprint
16.5.4. Key Subsidiaries or Distributors
16.5.5. Strategy and Recent Developments
16.5.6. Key Financials
16.6. Renesas Electronics Corporation
16.6.1. Overview
16.6.2. Product Portfolio
16.6.3. Sales Footprint
16.6.4. Key Subsidiaries or Distributors
16.6.5. Strategy and Recent Developments
16.6.6. Key Financials
16.7. Shanghai Belling Corp., Ltd.
16.7.1. Overview
16.7.2. Product Portfolio
16.7.3. Sales Footprint
16.7.4. Key Subsidiaries or Distributors
16.7.5. Strategy and Recent Developments
16.7.6. Key Financials
16.8. Shenzhen Heliwei Technology Co., Ltd.
16.8.1. Overview
16.8.2. Product Portfolio
16.8.3. Sales Footprint
16.8.4. Key Subsidiaries or Distributors
16.8.5. Strategy and Recent Developments
16.8.6. Key Financials
16.9. STMicroelectronics N.V.
16.9.1. Overview
16.9.2. Product Portfolio
16.9.3. Sales Footprint
16.9.4. Key Subsidiaries or Distributors
16.9.5. Strategy and Recent Developments
16.9.6. Key Financials
16.10. Texas Instruments Incorporated
16.10.1. Overview
16.10.2. Product Portfolio
16.10.3. Sales Footprint
16.10.4. Key Subsidiaries or Distributors
16.10.5. Strategy and Recent Developments
16.10.6. Key Financials
17. Recommendation
17.1. Opportunity Assessment
17.1.1. By Phase
17.1.2. By Package Type
17.1.3. By Application
17.1.4. By End-use Industry
17.1.5. By Region
List of Tables
Table 1: Global Energy Measurement IC Market Size & Forecast, by Phase, Value (US$ Bn), 2017-2031
Table 2: Global Energy Measurement IC Market Size & Forecast, by Phase, Volume (Million Units), 2017-2031
Table 3: Global Energy Measurement IC Market Size & Forecast, by Package Type, Value (US$ Bn), 2017-2031
Table 4: Global Energy Measurement IC Market Size & Forecast, by Package Type, Volume (Million Units), 2017-2031
Table 5: Global Energy Measurement IC Market Size & Forecast, by Application, Value (US$ Bn), 2017-2031
Table 6: Global Energy Measurement IC Market Size & Forecast, by End-use Industry, Value (US$ Bn), 2017-2031
Table 7: Global Energy Measurement IC Market Size & Forecast, by Region, Value (US$ Bn), 2017-2031
Table 8: Global Energy Measurement IC Market Size & Forecast, by Region, Volume (Million Units), 2017-2031
Table 9: North America Energy Measurement IC Market Size & Forecast, by Phase, Value (US$ Bn), 2017-2031
Table 10: North America Energy Measurement IC Market Size & Forecast, by Phase, Volume (Million Units), 2017-2031
Table 11: North America Energy Measurement IC Market Size & Forecast, by Package Type, Value (US$ Bn), 2017-2031
Table 12: North America Energy Measurement IC Market Size & Forecast, by Package Type, Volume (Million Units), 2017-2031
Table 13: North America Energy Measurement IC Market Size & Forecast, by Application, Value (US$ Bn), 2017-2031
Table 14: North America Energy Measurement IC Market Size & Forecast, by End-use Industry, Value (US$ Bn), 2017-2031
Table 15: North America Energy Measurement IC Market Size & Forecast, by Country, Value (US$ Bn), 2017-2031
Table 16: North America Energy Measurement IC Market Size & Forecast, by Country, Volume (Million Units), 2017-2031
Table 17: Europe Energy Measurement IC Market Size & Forecast, by Phase, Value (US$ Bn), 2017-2031
Table 18: Europe Energy Measurement IC Market Size & Forecast, by Phase, Volume (Million Units), 2017-2031
Table 19: Europe Energy Measurement IC Market Size & Forecast, by Package Type, Value (US$ Bn), 2017-2031
Table 20: Europe Energy Measurement IC Market Size & Forecast, by Package Type, Volume (Million Units), 2017-2031
Table 21: Europe Energy Measurement IC Market Size & Forecast, by Application, Value (US$ Bn), 2017-2031
Table 22: Europe Energy Measurement IC Market Size & Forecast, by End-use Industry, Value (US$ Bn), 2017-2031
Table 23: Europe Energy Measurement IC Market Size & Forecast, by Country, Value (US$ Bn), 2017-2031
Table 24: Europe Energy Measurement IC Market Size & Forecast, by Country, Volume (Million Units), 2017-2031
Table 25: Asia Pacific Energy Measurement IC Market Size & Forecast, by Phase, Value (US$ Bn), 2017-2031
Table 26: Asia Pacific Energy Measurement IC Market Size & Forecast, by Phase, Volume (Million Units), 2017-2031
Table 27: Asia Pacific Energy Measurement IC Market Size & Forecast, by Package Type, Value (US$ Bn), 2017-2031
Table 28: Asia Pacific Energy Measurement IC Market Size & Forecast, by Package Type, Volume (Million Units), 2017-2031
Table 29: Asia Pacific Energy Measurement IC Market Size & Forecast, by Application, Value (US$ Bn), 2017-2031
Table 30: Asia Pacific Energy Measurement IC Market Size & Forecast, by End-use Industry, Value (US$ Bn), 2017-2031
Table 31: Asia Pacific Energy Measurement IC Market Size & Forecast, by Country, Value (US$ Bn), 2017-2031
Table 32: Asia Pacific Energy Measurement IC Market Size & Forecast, by Country, Volume (Million Units), 2017-2031
Table 33: Middle East & Africa Energy Measurement IC Market Size & Forecast, by Phase, Value (US$ Bn), 2017-2031
Table 34: Middle East & Africa Energy Measurement IC Market Size & Forecast, by Phase, Volume (Million Units), 2017-2031
Table 35: Middle East & Africa Energy Measurement IC Market Size & Forecast, by Package Type, Value (US$ Bn), 2017-2031
Table 36: Middle East & Africa Energy Measurement IC Market Size & Forecast, by Package Type, Volume (Million Units), 2017-2031
Table 37: Middle East & Africa Energy Measurement IC Market Size & Forecast, by Application, Value (US$ Bn), 2017-2031
Table 38: Middle East & Africa Energy Measurement IC Market Size & Forecast, by End-use Industry, Value (US$ Bn), 2017-2031
Table 39: Middle East & Africa (MEA) Energy Measurement IC Market Size & Forecast, by Country, Value (US$ Bn), 2017-2031
Table 40: Middle East & Africa (MEA) Energy Measurement IC Market Size & Forecast, by Country, Volume (Million Units), 2017-2031
Table 41: South America Energy Measurement IC Market Size & Forecast, by Phase, Value (US$ Bn), 2017-2031
Table 42: South America Energy Measurement IC Market Size & Forecast, by Phase, Volume (Million Units), 2017-2031
Table 43: South America Energy Measurement IC Market Size & Forecast, by Package Type, Value (US$ Bn), 2017-2031
Table 44: South America Energy Measurement IC Market Size & Forecast, by Package Type, Volume (Million Units), 2017-2031
Table 45: South America Energy Measurement IC Market Size & Forecast, by Application, Value (US$ Bn), 2017-2031
Table 46: South America Energy Measurement IC Market Size & Forecast, by End-use Industry, Value (US$ Bn), 2017-2031
Table 47: South America Energy Measurement IC Market Size & Forecast, by Country, Value (US$ Bn), 2017-2031
Table 48: South America Energy Measurement IC Market Size & Forecast, by Country, Volume (Million Units), 2017-2031
List of Figures
Figure 1: Global Energy Measurement IC Market Size & Forecast, Value (US$ Bn), 2017-2031
Figure 2: Global Energy Measurement IC Market Size & Forecast, Volume (Million Units), 2017-2031
Figure 3: Global Energy Measurement IC Market, Y-o-Y, 2017-2031
Figure 4: Global Energy Measurement IC Price Trend, 2017-2031
Figure 5: Global Energy Measurement IC Market Size & Forecast, by Phase, Revenue (US$ Bn), 2017-2031
Figure 6: Global Energy Measurement IC Market Attractiveness, by Phase, Value (US$ Bn), 2022–2031
Figure 7: Global Energy Measurement IC Market Share Analysis, by Phase, 2022 and 2031
Figure 8: Global Energy Measurement IC Market Size & Forecast, by Package Type, Revenue (US$ Bn), 2017-2031
Figure 9: Global Energy Measurement IC Market Attractiveness, by Package Type, Value (US$ Bn), 2022–2031
Figure 10: Global Energy Measurement IC Market Share Analysis, by Package Type, 2022 and 2031
Figure 11: Global Energy Measurement IC Market Size & Forecast, by Application, Revenue (US$ Bn), 2017-2031
Figure 12: Global Energy Measurement IC Market Attractiveness, by Application, Value (US$ Bn), 2022–2031
Figure 13: Global Energy Measurement IC Market Share Analysis, by Application, 2022 and 2031
Figure 14: Global Energy Measurement IC Market Size & Forecast, by End-use Industry, Revenue (US$ Bn), 2017-2031
Figure 15: Global Energy Measurement IC Market Attractiveness, by End-use Industry, Value (US$ Bn), 2022–2031
Figure 16: Global Energy Measurement IC Market Share Analysis, by End-use Industry, 2022 and 2031
Figure 17: Global Energy Measurement IC Market Size & Forecast, by Region, Revenue (US$ Bn), 2017-2031
Figure 18: Global Energy Measurement IC Market Attractiveness, by Region, Value (US$ Bn), 2022–2031
Figure 19: Global Energy Measurement IC Market Share Analysis, by Region, 2022 and 2031
Figure 20: North America Energy Measurement IC Market Size & Forecast, Value (US$ Bn ), 2017-2031
Figure 21: North America Energy Measurement IC Market Size & Forecast, Volume (Million Units), 2017-2031
Figure 22: North America Energy Measurement IC Market, Value (US$ Bn), 2017-2031
Figure 23: North America Energy Measurement IC Market Size & Forecast, by Phase, Revenue (US$ Bn), 2017-2031
Figure 24: North America Energy Measurement IC Market Attractiveness, by Phase, Value (US$ Bn), 2022–2031
Figure 25: North America Energy Measurement IC Market Share Analysis, by Phase, 2022 and 2031
Figure 26: North America Energy Measurement IC Market Size & Forecast, by Package Type, Revenue (US$ Bn), 2017-2031
Figure 27: North America Energy Measurement IC Market Attractiveness, by Package Type, Value (US$ Bn), 2022–2031
Figure 28: North America Energy Measurement IC Market Share Analysis, by Package Type, 2022 and 2031
Figure 29: North America Energy Measurement IC Market Size & Forecast, by Application, Revenue (US$ Bn), 2017-2031
Figure 30: North America Energy Measurement IC Market Attractiveness, by Application, Value (US$ Bn), 2022–2031
Figure 31: North America Energy Measurement IC Market Share Analysis, by Application, 2022 and 2031
Figure 32: North America Energy Measurement IC Market Size & Forecast, by End-use Industry, Revenue (US$ Bn), 2017-2031
Figure 33: North America Energy Measurement IC Market Attractiveness, by End-use Industry, Value (US$ Bn), 2022–2031
Figure 34: North America Energy Measurement IC Market Share Analysis, by End-use Industry, 2022 and 2031
Figure 35: North America Energy Measurement IC Market Size & Forecast, by Country, Revenue (US$ Bn), 2017-2031
Figure 36: North America Energy Measurement IC Market Attractiveness, by Country, Value (US$ Bn), 2022–2031
Figure 37: North America Energy Measurement IC Market Share Analysis, by Country, 2022 and 2031
Figure 38: Europe Energy Measurement IC Market Size & Forecast, Value (US$ Bn ), 2017-2031
Figure 39: Europe Energy Measurement IC Market Size & Forecast, Volume (Million Units), 2017-2031
Figure 40: Europe Energy Measurement IC Market, Y-o-Y, 2017-2031
Figure 41: Europe Energy Measurement IC Market Size & Forecast, by Phase, Revenue (US$ Bn), 2017-2031
Figure 42: Europe Energy Measurement IC Market Attractiveness, by Phase, Value (US$ Bn), 2022–2031
Figure 43: Europe Energy Measurement IC Market Share Analysis, by Phase, 2022 and 2031
Figure 44: Europe Energy Measurement IC Market Size & Forecast, by Package Type, Revenue (US$ Bn), 2017-2031
Figure 45: Europe Energy Measurement IC Market Attractiveness, by Package Type, Value (US$ Bn), 2022–2031
Figure 46: Europe Energy Measurement IC Market Share Analysis, by Package Type, 2022 and 2031
Figure 47: Europe Energy Measurement IC Market Size & Forecast, by Application, Revenue (US$ Bn), 2017-2031
Figure 48: Europe Energy Measurement IC Market Attractiveness, by Application, Value (US$ Bn), 2022–2031
Figure 49: Europe Energy Measurement IC Market Share Analysis, by Application, 2022 and 2031
Figure 50: Europe Energy Measurement IC Market Size & Forecast, by End-use Industry, Revenue (US$ Bn), 2017-2031
Figure 51: Europe Energy Measurement IC Market Attractiveness, by End-use Industry, Value (US$ Bn), 2022–2031
Figure 52: Europe Energy Measurement IC Market Share Analysis, by End-use Industry, 2022 and 2031
Figure 53: Europe Energy Measurement IC Market Size & Forecast, by Country, Revenue (US$ Bn), 2017-2031
Figure 54: Europe Energy Measurement IC Market Attractiveness, by Country, Value (US$ Bn), 2022–2031
Figure 55: Europe Energy Measurement IC Market Share Analysis, by Country, 2022 and 2031
Figure 56: Asia Pacific Energy Measurement IC Market Size & Forecast, Value (US$ Bn ), 2017-2031
Figure 57: Asia Pacific Energy Measurement IC Market Size & Forecast, Volume (Million Units), 2017-2031
Figure 58: Asia Pacific Energy Measurement IC Market, Y-o-Y, 2017-2031
Figure 59: Asia Pacific Energy Measurement IC Market Size & Forecast, by Phase, Revenue (US$ Bn), 2017-2031
Figure 60: Asia Pacific Energy Measurement IC Market Attractiveness, by Phase, Value (US$ Bn), 2022–2031
Figure 61: Asia Pacific Energy Measurement IC Market Share Analysis, by Phase, 2022 and 2031
Figure 62: Asia Pacific Energy Measurement IC Market Size & Forecast, by Package Type, Revenue (US$ Bn), 2017-2031
Figure 63: Asia Pacific Energy Measurement IC Market Attractiveness, by Package Type, Value (US$ Bn), 2022–2031
Figure 64: Asia Pacific Energy Measurement IC Market Share Analysis, by Package Type, 2022 and 2031
Figure 65: Asia Pacific Energy Measurement IC Market Size & Forecast, by Application, Revenue (US$ Bn), 2017-2031
Figure 66: Asia Pacific Energy Measurement IC Market Attractiveness, by Application, Value (US$ Bn), 2022–2031
Figure 67: Asia Pacific Energy Measurement IC Market Share Analysis, by Application, 2022 and 2031
Figure 68: Asia Pacific Energy Measurement IC Market Size & Forecast, by End-use Industry, Revenue (US$ Bn), 2017-2031
Figure 69: Asia Pacific Energy Measurement IC Market Attractiveness, by End-use Industry, Value (US$ Bn), 2022–2031
Figure 70: Asia Pacific Energy Measurement IC Market Share Analysis, by End-use Industry, 2022 and 2031
Figure 71: Asia Pacific Energy Measurement IC Market Size & Forecast, by Country, Revenue (US$ Bn), 2017-2031
Figure 72: Asia Pacific Energy Measurement IC Market Attractiveness, by Country, Value (US$ Bn), 2022–2031
Figure 73: Asia Pacific Energy Measurement IC Market Share Analysis, by Country, 2022 and 2031
Figure 74: Middle East & Africa Energy Measurement IC Market Size & Forecast, Value (US$ Bn ), 2017-2031
Figure 75: Middle East & Africa Energy Measurement IC Market Size & Forecast, Volume (Million Units), 2017-2031
Figure 76: Middle East & Africa Energy Measurement IC Market, Y-o-Y, 2017-2031
Figure 77: Middle East & Africa Energy Measurement IC Market Size & Forecast, by Phase, Revenue (US$ Bn), 2017-2031
Figure 78: Middle East & Africa Energy Measurement IC Market Attractiveness, by Phase, Value (US$ Bn), 2022–2031
Figure 79: Middle East & Africa Energy Measurement IC Market Share Analysis, by Phase, 2022 and 2031
Figure 80: Middle East & Africa Energy Measurement IC Market Size & Forecast, by Package Type, Revenue (US$ Bn), 2017-2031
Figure 81: Middle East & Africa Energy Measurement IC Market Attractiveness, by Package Type, Value (US$ Bn), 2022–2031
Figure 82: Middle East & Africa Energy Measurement IC Market Share Analysis, by Package Type, 2022 and 2031
Figure 83: Middle East & Africa Energy Measurement IC Market Size & Forecast, by Application, Revenue (US$ Bn), 2017-2031
Figure 84: Middle East & Africa Energy Measurement IC Market Attractiveness, by Application, Value (US$ Bn), 2022–2031
Figure 85: Middle East & Africa Energy Measurement IC Market Share Analysis, by Application, 2022 and 2031
Figure 86: Middle East & Africa Energy Measurement IC Market Size & Forecast, by End-use Industry, Revenue (US$ Bn), 2017-2031
Figure 87: Middle East & Africa Energy Measurement IC Market Attractiveness, by End-use Industry, Value (US$ Bn), 2022–2031
Figure 88: Middle East & Africa Energy Measurement IC Market Share Analysis, by End-use Industry, 2022 and 2031
Figure 89: Middle East & Africa Energy Measurement IC Market Size & Forecast, by Country, Revenue (US$ Bn), 2017-2031
Figure 90: Middle East & Africa Energy Measurement IC Market Attractiveness, by Country, Value (US$ Bn), 2022–2031
Figure 91: Middle East & Africa Energy Measurement IC Market Share Analysis, by Country, 2022 and 2031
Figure 92: South America Energy Measurement IC Market Size & Forecast, Value (US$ Bn ), 2017-2031
Figure 93: South America Energy Measurement IC Market Size & Forecast, Volume (Million Units), 2017-2031
Figure 94: South America Energy Measurement IC Market, Value (US$ Bn), 2017-2031
Figure 95: South America Energy Measurement IC Market Size & Forecast, by Phase, Revenue (US$ Bn), 2017-2031
Figure 96: South America Energy Measurement IC Market Attractiveness, by Phase, Value (US$ Bn), 2022–2031
Figure 97: South America Energy Measurement IC Market Share Analysis, by Phase, 2022 and 2031
Figure 98: South America Energy Measurement IC Market Size & Forecast, by Package Type, Revenue (US$ Bn), 2017-2031
Figure 99: South America Energy Measurement IC Market Attractiveness, by Package Type, Value (US$ Bn), 2022–2031
Figure 100: South America Energy Measurement IC Market Share Analysis, by Package Type, 2022 and 2031
Figure 101: South America Energy Measurement IC Market Size & Forecast, by Application, Revenue (US$ Bn), 2017-2031
Figure 102: South America Energy Measurement IC Market Attractiveness, by Application, Value (US$ Bn), 2022–2031
Figure 103: South America Energy Measurement IC Market Share Analysis, by Application, 2022 and 2031
Figure 104: South America Energy Measurement IC Market Size & Forecast, by End-use Industry, Revenue (US$ Bn), 2017-2031
Figure 105: South America Energy Measurement IC Market Attractiveness, by End-use Industry, Value (US$ Bn), 2022–2031
Figure 106: South America Energy Measurement IC Market Share Analysis, by End-use Industry, 2022 and 2031
Figure 107: South America Energy Measurement IC Market Size & Forecast, by Country, Revenue (US$ Bn), 2017-2031
Figure 108: South America Energy Measurement IC Market Attractiveness, by Country, Value (US$ Bn), 2022–2031
Figure 109: South America Energy Measurement IC Market Share Analysis, by Country, 2022 and 2031
Copyright © Transparency Market Research, Inc. All Rights reserved
Trust Online

Energy Measurement IC Market