
Reports
Reports
Energy-efficient Lighting Technology Market: Snapshot
Energy-efficient lighting technology market is all set to chart a high growth trajectory owing to plethora of reasons. Continuously increasing worldwide population is one of the key reasons boosting the market growth. The energy-efficient lighting technology has linear and compact fluorescent lighting in addition to LED lighting. There are wide range of lighting options such as LED, incandescent lamp, and gas discharge lamp available in the energy-efficient lighting technology market. Growing awareness about benefits of these lighting options is projected to boost the demand for products from this market. In gas discharge lamp category, customers can select from LFL, CFL, and arc lamp as per their need.
In recent times, there is swift growth in urbanization all across the world. Owing to this situation, the demand for energy has increased tremendously. Players working in the global energy-efficient lighting technology market are growing efforts to advance their production capacity. These efforts will support them to meet the rising demand for their products. This situation also signifies an opportunity for new entrants to make their space in the market by fulfilling the rising demand. Thus, growing demand owing to urbanization is driving the growth of the global energy-efficient lighting technology market.
Besides, governments of many countries have taken initiatives that are supporting the market growth. As a part of these initiatives, many countries announced the construction of new power plants. However, residents nearby these plants showed strong opposition for these government moves. As a result, government had to withdraw these plans in some places. Governments have temporarily stopped plans for new power plants and have shifted their focus to extend the life of present power plants. Moreover, increasing efforts from governments to promote the use of energy-efficient products is big positive for the global energy-efficient lighting technology market. These efforts are expected to fuel the market growth during forecast period.
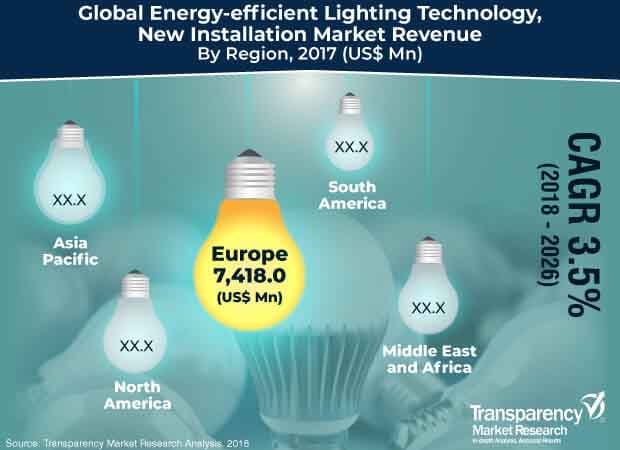
The energy-efficient lighting technology comprises compact and linear fluorescent lighting as well as LED lighting. Exponentially growing population and urbanization lead to the rise of commercial and residential buildings. Over the last 30 years, the demand for energy has risen significantly. In order to meet this increasing demand, governments across the world have started construction of new power plants. However, strong resistance from people staying near these plants have resulted in several legal actions and lawsuits that decelerated and, in some cases, stopped the construction of new power plants. Therefore, in order to extend the life of existing power plants and provisionally avoid the need to build new ones, governments have started promoting the use of energy-efficient products. The global energy-efficient lighting market is projected to expand at a CAGR of 3.5% during the forecast period and reach value of US$ 29,712.6 Mn by 2026.
Prices of energy-efficient light bulbs (such as CFLs and LEDs) were initially very high. Therefore, though being energy-efficient, these bulbs hardly replaced any incandescent lights. Currently, prices of LED bulbs have dropped considerably since its introduction and these bulbs have become affordable for the common man for use in lighting applications. Furthermore, since an LED light bulb can last from 20,000 to 50,000 hours i.e. 5–8 times longer than any other bulb, its cost of operation is lower than other bulb types. Also, an LED bulb is a filament-less bulb. It does not break like an incandescent bulb, which makes it more durable than others. Moreover, energy-efficient light bulbs offer significant electricity savings, as they utilize less energy and last longer. Thus, owing to their lower operating costs, these bulbs are increasingly being preferred in upcoming smart buildings and they are also replacing the existing traditional light bulbs in several other applications.
However, major energy-efficient light bulbs such as CFLs and LEDs are not suitable for extreme environments. For example, in case of a CFL, extreme temperature can affect the rated lifetime and light level of the bulb. Sudden breaking of the bulb in extreme temperatures may result in mercury leakage, which can be highly toxic to humans and the environment. Similarly, LED light bulbs become ineffective or stop working in high ambient temperatures. High temperature results in overheating of the LED package, ultimately leading to device failure. Therefore, these bulbs require continuous monitoring. However, the impact of this restraint is expected to decrease during the forecast period, as adequate heat sinking is being used to remove all excess heat and prevent these bulbs from malfunctioning before the due time.
Energy-efficient lighting is expected to witness growth opportunities as Internet of Lights (IoL). Internet of Lights is formed when all smart lights in a space are connected by digital networks and they are able to communicate with one another; communicate with a server or gateway; and communicate with sensors and controls in the vicinity of lights. In such a configuration, Internet of Lights becomes the backbone of a building-management or home automation network. Along with residential applications, IoL is expected to witness growth opportunities in commercial applications during the forecast period.
Some of the prominent players operating in the global energy-efficient lighting technology market are Bajaj Electricals Ltd., Cree Inc., Eaton Corporation, General Electric Company, OSRAM Licht Group, Apple Inc., Nichia Corporation, Toshiba Lighting & Technology Corporation, LIGMAN Lighting Co, and Bridelux Inc.
1. Preface
1.1. Market Definition and Scope
1.2. Market Segmentation
1.3. Key Research Objectives
1.4. Research Highlights
2. Assumptions and Research Methodology
3. Executive Summary: Global Energy-efficient Lighting Technology Market
4. Market Overview
4.1. Introduction
4.2. Key Market Developments
4.3. Key Market Indicators
4.4. Market Dynamics
4.4.1. Drivers
4.4.2. Restraints
4.4.3. Opportunities
4.5. Porter’s Five Forces Analysis
4.6. Global Energy-efficient Lighting Technology Market Value Chain Analysis
4.7. Current and Future Trends – Global Energy-efficient Lighting Technology Market
4.8. Policies and Regulations
5. Global Energy-efficient Lighting Technology – New Installation Market Analysis and Forecast, by Product Type
5.1. Overview & Definitions
5.2. Global Energy-efficient Lighting Technology Market Size (US$ Mn and Million Units) Forecast, by Product Type, 2016–2026
5.2.1. Incandescent Lamp
5.2.1.1. Halogen Lamp
5.2.1.2. Others
5.2.2. LED
5.2.3. Gas Discharge Lamp
5.2.3.1. CFL
5.2.3.2. LFL
5.2.3.3. Arc Lamp
5.2.3.4. Others
5.3. Product Type Comparison Matrix
5.4. Global Energy-efficient Lighting Technology Market Attractiveness Analysis, by Product Type
6. Global Energy-efficient Lighting Technology – New Installation Market Analysis and Forecast, by Center CCT
6.1. Overview & Definitions
6.2. Global Energy-efficient Lighting Technology Market Size (US$ Mn and Million Units) Forecast, by Center CCT, 2016–2026
6.2.1. Lower than 2200K
6.2.2. 2200K and 2500K
6.2.3. 2700K and 3000K
6.2.4. 3500K and 4000K
6.2.5. 4500K and 5000K
6.2.6. 5700K and 6500K
6.2.7. More than 6500K
6.3. Center CCT Comparison Matrix
6.4. Global Energy-efficient Lighting Technology Market Attractiveness Analysis, by Center CCT
7. Global Energy-efficient Lighting Technology – New Installation Market Analysis and Forecast, by Application
7.1. Overview & Definitions
7.2. Global Energy-efficient Lighting Technology Market Size (US$ Mn and Million Units) Forecast, by Application, 2016–2026
7.2.1. Residential
7.2.2. Commercial
7.2.3. Industrial
7.3. Application Comparison Matrix
7.4. Global Energy-efficient Lighting Technology Market Attractiveness Analysis, by Application
8. Global Energy-efficient Lighting Technology – New Installation Market Analysis and Forecast, by Region
8.1. Key Findings
8.2. Global Energy-efficient Lighting Technology Market Size (US$ Mn and Million Units) Forecast, by Region, 2016–2026
8.2.1. North America
8.2.2. Europe
8.2.3. Asia Pacific
8.2.4. Middle East & Africa
8.2.5. South America
8.3. Global Energy-efficient Lighting Technology Market Attractiveness Analysis, by Region
9. North America Energy-efficient Lighting Technology – New Installation Market Analysis and Forecast
9.1. Key Findings
9.2. Key Trends
9.3. North America Energy-efficient Lighting Technology Market Size (US$ Mn and Million Units) Forecast, by Product Type, 2016–2026
9.3.1. Incandescent Lamp
9.3.1.1. Halogen Lamp
9.3.1.2. Others
9.3.2. LED
9.3.3. Gas Discharge Lamp
9.3.3.1. CFL
9.3.3.2. LFL
9.3.3.3. Arc Lamp
9.3.3.4. Others
9.4. North America Energy-efficient Lighting Technology Market Size (US$ Mn and Million Units) Forecast, by Center CCT, 2016–2026
9.4.1. Lower than 2200K
9.4.2. 2200K and 2500K
9.4.3. 2700K and 3000K
9.4.4. 3500K and 4000K
9.4.5. 4500K and 5000K
9.4.6. 5700K and 6500K
9.4.7. More than 6500K
9.5. North America Energy-efficient Lighting Technology Market Size (US$ Mn and Million Units) Forecast, by Application, 2016–2026
9.5.1. Residential
9.5.2. Commercial
9.5.3. Industrial
9.6. North America Energy-efficient Lighting Technology Market Size (US$ Mn and Million Units) Forecast, by Country/Sub-region, 2016–2026
9.6.1. U.S.
9.6.2. Canada
9.6.3. Rest of North America
9.7. North America Energy-efficient Lighting Technology Market Attractiveness Analysis
9.7.1. by Product Type
9.7.2. by Center CCT
9.7.3. by Application
9.7.4. by Country/Sub-region
10. Europe Energy-efficient Lighting Technology – New Installation Market Analysis and Forecast
10.1. Key Findings
10.2. Key Trends
10.3. Europe Energy-efficient Lighting Technology Market Size (US$ Mn and Million Units) Forecast, by Product Type, 2016–2026
10.3.1. Incandescent Lamp
10.3.1.1. Halogen Lamp
10.3.1.2. Others
10.3.2. LED
10.3.3. Gas Discharge Lamp
10.3.3.1. CFL
10.3.3.2. LFL
10.3.3.3. Arc Lamp
10.3.3.4. Others
10.4. Europe Energy-efficient Lighting Technology Market Size (US$ Mn and Million Units) Forecast, by Center CCT, 2016–2026
10.4.1. Lower than 2200K
10.4.2. 2200K and 2500K
10.4.3. 2700K and 3000K
10.4.4. 3500K and 4000K
10.4.5. 4500K and 5000K
10.4.6. 5700K and 6500K
10.4.7. More than 6500K
10.5. Europe Energy-efficient Lighting Technology Market Size (US$ Mn and Million Units) Forecast, by Application, 2016–2026
10.5.1. Residential
10.5.2. Commercial
10.5.3. Industrial
10.6. Europe Energy-efficient Lighting Technology Market Size (US$ Mn and Million Units) Forecast, by Country/Sub-region, 2016–2026
10.6.1. U.K.
10.6.2. Germany
10.6.3. France
10.6.4. Rest of Europe
10.7. Europe Energy-efficient Lighting Technology Market Attractiveness Analysis
10.7.1. by Product Type
10.7.2. by Center CCT
10.7.3. by Application
10.7.4. by Country/Sub-region
11. Asia Pacific Energy-efficient Lighting Technology – New Installation Market Analysis and Forecast
11.1. Key Findings
11.2. Key Trends
11.3. Asia Pacific Energy-efficient Lighting Technology Market Size (US$ Mn and Million Units) Forecast, by Product Type, 2016–2026
11.3.1. Incandescent Lamp
11.3.1.1. Halogen Lamp
11.3.1.2. Others
11.3.2. LED
11.3.3. Gas Discharge Lamp
11.3.3.1. CFL
11.3.3.2. LFL
11.3.3.3. Arc Lamp
11.3.3.4. Others
11.4. Asia Pacific Energy-efficient Lighting Technology Market Size (US$ Mn and Million Units) Forecast, by Center CCT, 2016–2026
11.4.1. Lower than 2200K
11.4.2. 2200K and 2500K
11.4.3. 2700K and 3000K
11.4.4. 3500K and 4000K
11.4.5. 4500K and 5000K
11.4.6. 5700K and 6500K
11.4.7. More than 6500K
11.5. Asia Pacific Energy-efficient Lighting Technology Market Size (US$ Mn and Million Units) Forecast, by Application, 2016–2026
11.5.1. Residential
11.5.2. Commercial
11.5.3. Industrial
11.6. Asia Pacific Energy-efficient Lighting Technology Market Size (US$ Mn and Million Units) Forecast, by Country/Sub-region, 2016–2026
11.6.1. China
11.6.2. Japan
11.6.3. India
11.6.4. Rest of Asia Pacific
11.7. Asia Pacific Energy-efficient Lighting Technology Market Attractiveness Analysis
11.7.1. by Product Type
11.7.2. by Center CCT
11.7.3. by Application
11.7.4. by Country/Sub-region
12. Middle East & Africa (MEA) Energy-efficient Lighting Technology – New Installation Market Analysis and Forecast
12.1. Key Findings
12.2. Key Trends
12.3. Middle East & Africa Energy-efficient Lighting Technology Market Size (US$ Mn and Million Units) Forecast, by Product Type, 2016–2026
12.3.1. Incandescent Lamp
12.3.1.1. Halogen Lamp
12.3.1.2. Others
12.3.2. LED
12.3.3. Gas Discharge Lamp
12.3.3.1. CFL
12.3.3.2. LFL
12.3.3.3. Arc Lamp
12.3.3.4. Others
12.4. Middle East & Africa Energy-efficient Lighting Technology Market Size (US$ Mn and Million Units) Forecast, by Center CCT, 2016–2026
12.4.1. Lower than 2200K
12.4.2. 2200K and 2500K
12.4.3. 2700K and 3000K
12.4.4. 3500K and 4000K
12.4.5. 4500K and 5000K
12.4.6. 5700K and 6500K
12.4.7. More than 6500K
12.5. Middle East & Africa Energy-efficient Lighting Technology Market Size (US$ Mn and Million Units) Forecast, by Application, 2016–2026
12.5.1. Residential
12.5.2. Commercial
12.5.3. Industrial
12.6. Middle East & Africa Energy-efficient Lighting Technology Market Size (US$ Mn and Million Units) Forecast, by Country/Sub-region, 2016–2026
12.6.1. GCC
12.6.2. South Africa
12.6.3. Rest of Middle East & Africa
12.7. Middle East & Africa Energy-efficient Lighting Technology Market Attractiveness Analysis
12.7.1. by Product Type
12.7.2. by Center CCT
12.7.3. by Application
12.7.4. by Country/Sub-region
13. South America Energy-efficient Lighting Technology – New Installation Market Analysis and Forecast
13.1. Key Findings
13.2. Key Trends
13.3. South America Energy-efficient Lighting Technology Market Size (US$ Mn and Million Units) Forecast, by Product Type, 2016–2026
13.3.1. Incandescent Lamp
13.3.1.1. Halogen Lamp
13.3.1.2. Others
13.3.2. LED
13.3.3. Gas Discharge Lamp
13.3.3.1. CFL
13.3.3.2. LFL
13.3.3.3. Arc Lamp
13.3.3.4. Others
13.4. South America Energy-efficient Lighting Technology Market Size (US$ Mn and Million Units) Forecast, by Center CCT, 2016–2026
13.4.1. Lower than 2200K
13.4.2. 2200K and 2500K
13.4.3. 2700K and 3000K
13.4.4. 3500K and 4000K
13.4.5. 4500K and 5000K
13.4.6. 5700K and 6500K
13.4.7. More than 6500K
13.5. South America Energy-efficient Lighting Technology Market Size (US$ Mn and Million Units) Forecast, by Application, 2016–2026
13.5.1. Residential
13.5.2. Commercial
13.5.3. Industrial
13.6. South America Energy-efficient Lighting Technology Market Size (US$ Mn and Million Units) Forecast, by Country/Sub-region, 2016–2026
13.6.1. Brazil
13.6.2. Rest of South America
13.7. South America Energy-efficient Lighting Technology Market Attractiveness Analysis
13.7.1. by Product Type
13.7.2. by Center CCT
13.7.3. by Application
13.7.4. by Country/Sub-region
14. Global Energy-efficient Lighting Technology – Replacement Market Analysis and Forecast, by Product Type
14.1. Overview & Definitions
14.2. Global Energy-efficient Lighting Technology Market Size (US$ Mn and Million Units) Forecast, by Product Type, 2016–2026
14.2.1. Incandescent Lamp
14.2.1.1. Halogen Lamp
14.2.1.2. Others
14.2.2. LED
14.2.3. Gas Discharge Lamp
14.2.3.1. CFL
14.2.3.2. LFL
14.2.3.3. Arc Lamp
14.2.3.4. Others
14.3. Product Type Comparison Matrix
14.4. Global Energy-efficient Lighting Technology Market Attractiveness Analysis, by Product Type
15. Global Energy-efficient Lighting Technology – Replacement Market Analysis and Forecast, by Center CCT
15.1. Overview & Definition
15.2. Global Energy-efficient Lighting Technology Market Size (US$ Mn and Million Units) Forecast, by Center CCT, 2016–2026
15.2.1. Lower than 2200K
15.2.2. 2200K and 2500K
15.2.3. 2700K and 3000K
15.2.4. 3500K and 4000K
15.2.5. 4500K and 5000K
15.2.6. 5700K and 6500K
15.2.7. More than 6500K
15.3. Center CCT Comparison Matrix
15.4. Global Energy-efficient Lighting Technology Market Attractiveness Analysis, by Center CCT
16. Global Energy-efficient Lighting Technology – Replacement Market Analysis and Forecast, by Application
16.1. Overview & Definition
16.2. Global Energy-efficient Lighting Technology Market Size (US$ Mn and Million Units) Forecast, by Application, 2016–2026
16.2.1. Residential
16.2.2. Commercial
16.2.3. Industrial
16.3. Application Comparison Matrix
16.4. Global Energy-efficient Lighting Technology Market Attractiveness Analysis, by Application
17. Global Energy-efficient Lighting Technology – Replacement Market Analysis and Forecast, by Region
17.1. Key Findings
17.2. Global Energy-efficient Lighting Technology Market Size (US$ Mn and Million Units) Forecast, by Region, 2016–2026
17.2.1. North America
17.2.2. Europe
17.2.3. Asia Pacific
17.2.4. Middle East & Africa
17.2.5. South America
17.3. Global Energy-efficient Lighting Technology Market Attractiveness Analysis, by Region
18. North America Energy-efficient Lighting Technology – Replacement Market Analysis and Forecast
18.1. Key Findings
18.2. Key Trends
18.3. North America Energy-efficient Lighting Technology Market Size (US$ Mn and Million Units) Forecast, by Product Type, 2016–2026
18.3.1. Incandescent Lamp
18.3.1.1. Halogen Lamp
18.3.1.2. Others
18.3.2. LED
18.3.3. Gas Discharge Lamp
18.3.3.1. CFL
18.3.3.2. LFL
18.3.3.3. Arc Lamp
18.3.3.4. Others
18.4. North America Energy-efficient Lighting Technology Market Size (US$ Mn and Million Units) Forecast, by Center CCT, 2016–2026
18.4.1. Lower than 2200K
18.4.2. 2200K and 2500K
18.4.3. 2700K and 3000K
18.4.4. 3500K and 4000K
18.4.5. 4500K and 5000K
18.4.6. 5700K and 6500K
18.4.7. More than 6500K
18.5. North America Energy-efficient Lighting Technology Market Size (US$ Mn and Million Units) Forecast, by Application, 2016–2026
18.5.1. Residential
18.5.2. Commercial
18.5.3. Industrial
18.6. North America Energy-efficient Lighting Technology Market Size (US$ Mn and Million Units) Forecast, by Country/Sub-region, 2016–2026
18.6.1. U.S.
18.6.2. Canada
18.6.3. Rest of North America
18.7. North America Energy-efficient Lighting Technology Market Attractiveness Analysis
18.7.1. by Product Type
18.7.2. by Center CCT
18.7.3. by Application
18.7.4. by Country/Sub-region
19. Europe Energy-efficient Lighting Technology – Replacement Market Analysis and Forecast
19.1. Key Findings
19.2. Key Trends
19.3. Europe Energy-efficient Lighting Technology Market Size (US$ Mn and Million Units) Forecast, by Product Type, 2016–2026
19.3.1. Incandescent Lamp
19.3.1.1. Halogen Lamp
19.3.1.2. Others
19.3.2. LED
19.3.3. Gas Discharge Lamp
19.3.3.1. CFL
19.3.3.2. LFL
19.3.3.3. Arc Lamp
19.3.3.4. Others
19.4. Europe Energy-efficient Lighting Technology Market Size (US$ Mn and Million Units) Forecast, by Center CCT, 2016–2026
19.4.1. Lower than 2200K
19.4.2. 2200K and 2500K
19.4.3. 2700K and 3000K
19.4.4. 3500K and 4000K
19.4.5. 4500K and 5000K
19.4.6. 5700K and 6500K
19.4.7. More than 6500K
19.5. Europe Energy-efficient Lighting Technology Market Size (US$ Mn and Million Units) Forecast, by Application, 2016–2026
19.5.1. Residential
19.5.2. Commercial
19.5.3. Industrial
19.6. Europe Energy-efficient Lighting Technology Market Size (US$ Mn and Million Units) Forecast, by Country/Sub-region, 2016–2026
19.6.1. U.K.
19.6.2. Germany
19.6.3. France
19.6.4. Rest of Europe
19.7. Europe Energy-efficient Lighting Technology Market Attractiveness Analysis
19.7.1. by Product Type
19.7.2. by Center CCT
19.7.3. by Application
19.7.4. by Country/Sub-region
20. Asia Pacific Energy-efficient Lighting Technology – Replacement Market Analysis and Forecast
20.1. Key Findings
20.2. Key Trends
20.3. Asia Pacific Energy-efficient Lighting Technology Market Size (US$ Mn and Million Units) Forecast, by Product Type, 2016–2026
20.3.1. Incandescent Lamp
20.3.1.1. Halogen Lamp
20.3.1.2. Others
20.3.2. LED
20.3.3. Gas Discharge Lamp
20.3.3.1. CFL
20.3.3.2. LFL
20.3.3.3. Arc Lamp
20.3.3.4. Others
20.4. Asia Pacific Energy-efficient Lighting Technology Market Size (US$ Mn and Million Units) Forecast, by Center CCT, 2016–2026
20.4.1. Lower than 2200K
20.4.2. 2200K and 2500K
20.4.3. 2700K and 3000K
20.4.4. 3500K and 4000K
20.4.5. 4500K and 5000K
20.4.6. 5700K and 6500K
20.4.7. More than 6500K
20.5. Asia Pacific Energy-efficient Lighting Technology Market Size (US$ Mn and Million Units) Forecast, by Application, 2016–2026
20.5.1. Residential
20.5.2. Commercial
20.5.3. Industrial
20.6. Asia Pacific Energy-efficient Lighting Technology Market Size (US$ Mn and Million Units) Forecast, by Country/Sub-region, 2016–2026
20.6.1. China
20.6.2. Japan
20.6.3. India
20.6.4. Rest of Asia Pacific
20.7. Asia Pacific Energy-efficient Lighting Technology Market Attractiveness Analysis
20.7.1. by Product Type
20.7.2. by Center CCT
20.7.3. by Application
20.7.4. by Country/Sub-region
21. Middle East & Africa (MEA) Energy-efficient Lighting Technology – Replacement Market Analysis and Forecast
21.1. Key Findings
21.2. Key Trends
21.3. Middle East & Africa Energy-efficient Lighting Technology Market Size (US$ Mn and Million Units) Forecast, by Product Type, 2016–2026
21.3.1. Incandescent Lamp
21.3.1.1. Halogen Lamp
21.3.1.2. Others
21.3.2. LED
21.3.3. Gas Discharge Lamp
21.3.3.1. CFL
21.3.3.2. LFL
21.3.3.3. Arc Lamp
21.3.3.4. Others
21.4. Middle East & Africa Energy-efficient Lighting Technology Market Size (US$ Mn and Million Units) Forecast, by Center CCT, 2016–2026
21.4.1. Lower than 2200K
21.4.2. 2200K and 2500K
21.4.3. 2700K and 3000K
21.4.4. 3500K and 4000K
21.4.5. 4500K and 5000K
21.4.6. 5700K and 6500K
21.4.7. More than 6500K
21.5. Middle East & Africa Energy-efficient Lighting Technology Market Size (US$ Mn and Million Units) Forecast, by Application, 2016–2026
21.5.1. Residential
21.5.2. Commercial
21.5.3. Industrial
21.6. Middle East & Africa Energy-efficient Lighting Technology Market Size (US$ Mn and Million Units) Forecast, by Country/Sub-region, 2016–2026
21.6.1. GCC
21.6.2. South Africa
21.6.3. Rest of Middle East & Africa
21.7. Middle East & Africa Energy-efficient Lighting Technology Market Attractiveness Analysis
21.7.1. by Product Type
21.7.2. by Center CCT
21.7.3. by Application
21.7.4. by Country/Sub-region
22. South America Energy-efficient Lighting Technology – Replacement Market Analysis and Forecast
22.1. Key Findings
22.2. Key Trends
22.3. South America Energy-efficient Lighting Technology Market Size (US$ Mn and Million Units) Forecast, by Product Type, 2016–2026
22.3.1. Incandescent Lamp
22.3.1.1. Halogen Lamp
22.3.1.2. Others
22.3.2. LED
22.3.3. Gas Discharge Lamp
22.3.3.1. CFL
22.3.3.2. LFL
22.3.3.3. Arc Lamp
22.3.3.4. Others
22.4. South America Energy-efficient Lighting Technology Market Size (US$ Mn and Million Units) Forecast, by Center CCT, 2016–2026
22.4.1. Lower than 2200K
22.4.2. 2200K and 2500K
22.4.3. 2700K and 3000K
22.4.4. 3500K and 4000K
22.4.5. 4500K and 5000K
22.4.6. 5700K and 6500K
22.4.7. More than 6500K
22.5. South America Energy-efficient Lighting Technology Market Size (US$ Mn and Million Units) Forecast, by Application, 2016–2026
22.5.1. Residential
22.5.2. Commercial
22.5.3. Industrial
22.6. South America Energy-efficient Lighting Technology Market Size (US$ Mn and Million Units) Forecast, by Country/Sub-region, 2016–2026
22.6.1. Brazil
22.6.2. Rest of South America
22.7. South America Energy-efficient Lighting Technology Market Attractiveness Analysis
22.7.1. by Product Type
22.7.2. by Center CCT
22.7.3. by Application
22.7.4. by Country/Sub-region
23. Competition Landscape
23.1. Market Players – Competition Matrix
23.2. Global Energy-efficient Lighting Technology Market Share Analysis, by Company (2017)
23.3. Company Profiles (Details – Overview, Financials, SWOT Analysis, Recent Developments, Strategy)
23.3.1. Bajaj Electricals Ltd.
23.3.1.1. Overview
23.3.1.2. Financials
23.3.1.3. SWOT Analysis
23.3.1.4. Strategy
23.3.2. Cree Inc.
23.3.2.1. Overview
23.3.2.2. Financials
23.3.2.3. SWOT Analysis
23.3.2.4. Strategy
23.3.3. Eaton Corporation
23.3.3.1. Overview
23.3.3.2. Financials
23.3.3.3. SWOT Analysis
23.3.3.4. Strategy
23.3.4. General Electric Company
23.3.4.1. Overview
23.3.4.2. Financials
23.3.4.3. SWOT Analysis
23.3.4.4. Strategy
23.3.5. OSRAM Licht Group
23.3.5.1. Overview
23.3.5.2. Financials
23.3.5.3. SWOT Analysis
23.3.5.4. Strategy
23.3.6. Apple Inc.
23.3.6.1. Overview
23.3.6.2. Financials
23.3.6.3. SWOT Analysis
23.3.6.4. Strategy
23.3.7. Nichia Corporation
23.3.7.1. Overview
23.3.7.2. Financials
23.3.7.3. SWOT Analysis
23.3.7.4. Strategy
23.3.8. Toshiba Lighting & Technology Corporation
23.3.8.1. Overview
23.3.8.2. Financials
23.3.8.3. SWOT Analysis
23.3.8.4. Strategy
23.3.9. LIGMAN Lighting Co
23.3.9.1. Overview
23.3.9.2. Financials
23.3.9.3. SWOT Analysis
23.3.9.4. Strategy
23.3.10. Bridelux Inc.
23.3.10.1. Overview
23.3.10.2. Financials
23.3.10.3. SWOT Analysis
23.3.10.4. Strategy
24. Key Takeaways
List of Tables
Table 1 : Global Energy-efficient Lighting Technology – New Installation Market Value (US$ Mn) Forecast, by Product Type, 2016–2026
Table 2 : Global Energy-efficient Lighting Technology – New Installation Market Volume (Million Units) Forecast, by Product Type, 2016–2026
Table 3 : Global Energy-efficient Lighting Technology – New Installation Market Value (US$ Mn) Forecast, by Incandescent Lamp, 2016–2026
Table 4 : Global Energy-efficient Lighting Technology – New Installation Market Volume (Million Units) Forecast, by Incandescent Lamp, 2016–2026
Table 5 : Global Energy-efficient Lighting Technology – New Installation Market Value (US$ Mn) Forecast, by Gas Discharge Lamp, 2016–2026
Table 6 : Global Energy-efficient Lighting Technology – New Installation Market Volume (Million Units) Forecast, by Gas Discharge Lamp, 2016–2026
Table 7 : Global Energy-efficient Lighting Technology – New Installation Market Value (US$ Mn) Forecast, by Application, 2016–2026
Table 8 : Global Energy-efficient Lighting Technology – New Installation Market Volume (Million Units) Forecast, by Application, 2016–2026
Table 9 : Global Energy-efficient Lighting Technology – New Installation Market Value (US$ Mn) Forecast, by Center CCT, 2016–2026
Table 10: Global Energy-efficient Lighting Technology – New Installation Market Volume (Million Units) Forecast, by Center CCT, 2016–2026
Table 11 : Global Energy-efficient Lighting Technology – New Installation Market Value (US$ Mn) Forecast, by Region, 2016–2026
Table 12 : Global Energy-efficient Lighting Technology – New Installation Market Volume (Million Units) Forecast, by Region, 2016–2026
Table 13 : North America Energy-efficient Lighting Technology – New Installation Market Value (US$ Mn) Forecast, by Product Type, 2016–2026
Table 14 : North America Energy-efficient Lighting Technology – New Installation Market Volume (Million Units) Forecast, by Product Type, 2016–2026
Table 15 : North America Energy-efficient Lighting Technology – New Installation Market Value (US$ Mn) Forecast, by Incandescent Lamp, 2016–2026
Table 16 : North America Energy-efficient Lighting Technology – New Installation Market Volume (Million Units) Forecast, by Incandescent Lamp, 2016–2026
Table 17 : North America Energy-efficient Lighting Technology – New Installation Market Value (US$ Mn) Forecast, by Gas Discharge Lamp, 2016–2026
Table 18 : North America Energy-efficient Lighting Technology – New Installation Market Volume (Million Units) Forecast, by Gas Discharge Lamp, 2016–2026
Table 19 : North America Energy-efficient Lighting Technology – New Installation Market Value (US$ Mn) Forecast, by Application, 2016–2026
Table 20 : North America Energy-efficient Lighting Technology – New Installation Market Volume (Million Units) Forecast, by Application, 2016–2026
Table 21 : North America Energy-efficient Lighting Technology – New Installation Market Value (US$ Mn) Forecast, by Center CCT, 2016–2026
Table 22 : North America Energy-efficient Lighting Technology – New Installation Market Volume (Million Units) Forecast, by Center CCT, 2016–2026
Table 23 : North America Energy-efficient Lighting Technology – New Installation Market Value (US$ Mn) Forecast, by Country/Sub-region, 2018–2026
Table 24 : North America Energy-efficient Lighting Technology – New Installation Market Volume (Million Units) Forecast, by Country/Sub-region, 2018–2026
Table 25 : Europe Energy-efficient Lighting Technology – New Installation Market Value (US$ Mn) Forecast, by Product Type, 2016–2026
Table 26 : Europe Energy-efficient Lighting Technology – New Installation Market Volume (Million Units) Forecast, by Product Type, 2016–2026
Table 27 : Europe Energy-efficient Lighting Technology – New Installation Market Value (US$ Mn) Forecast, by Incandescent Lamp, 2016–2026
Table 28 : Europe Energy-efficient Lighting Technology – New Installation Market Volume (Million Units) Forecast, by Incandescent Lamp, 2016–2026
Table 29 : Europe Energy-efficient Lighting Technology – New Installation Market Value (US$ Mn) Forecast, by Gas Discharge Lamp, 2016–2026
Table 30 : Europe Energy-efficient Lighting Technology – New Installation Market Volume (Million Units) Forecast, by Gas Discharge Lamp, 2016–2026
Table 31 : Europe Energy-efficient Lighting Technology – New Installation Market Value (US$ Mn) Forecast, by Application, 2016–2026
Table 32 : Europe Energy-efficient Lighting Technology – New Installation Market Volume (Million Units) Forecast, by Application, 2016–2026
Table 33 : Europe Energy-efficient Lighting Technology – New Installation Market Value (US$ Mn) Forecast, by Center CCT, 2016–2026
Table 34 : Europe Energy-efficient Lighting Technology – New Installation Market Volume (Million Units) Forecast, by Center CCT, 2016–2026
Table 35: Europe Energy-efficient Lighting Technology – New Installation Market Value (US$ Mn) Forecast, by Country/Sub-region, 2018–2026
Table 36 : Europe Energy-efficient Lighting Technology – New Installation Market Volume (Million Units) Forecast, by Country/Sub-region, 2018–2026
Table 37 : Asia Pacific Energy-efficient Lighting Technology – New Installation Market Value (US$ Mn) Forecast, by Product Type, 2016–2026
Table 38: Asia Pacific Energy-efficient Lighting Technology – New Installation Market Volume (Million Units) Forecast, by Product Type, 2016–2026
Table 39 : Asia Pacific Energy-efficient Lighting Technology – New Installation Market Value (US$ Mn) Forecast, by Incandescent Lamp, 2016–2026
Table 40 : Asia Pacific Energy-efficient Lighting Technology – New Installation Market Volume (Million Units) Forecast, by Incandescent Lamp, 2016–2026
Table 41 : Asia Pacific Energy-efficient Lighting Technology – New Installation Market Value (US$ Mn) Forecast, by Gas Discharge Lamp, 2016–2026
Table 42 : Asia Pacific Energy-efficient Lighting Technology – New Installation Market Volume (Million Units) Forecast, by Gas Discharge Lamp, 2016–2026
Table 43 : Asia Pacific Energy-efficient Lighting Technology – New Installation Market Value (US$ Mn) Forecast, by Application, 2016–2026
Table 44 : Asia Pacific Energy-efficient Lighting Technology – New Installation Market Volume (Million Units) Forecast, by Application, 2016–2026
Table 45 : Asia Pacific Energy-efficient Lighting Technology – New Installation Market Value (US$ Mn) Forecast, by Center CCT, 2016–2026
Table 46 : Asia Pacific Energy-efficient Lighting Technology – New Installation Market Volume (Million Units) Forecast, by Center CCT, 2016–2026
Table 47 : Asia Pacific Energy-efficient Lighting Technology – New Installation Market Value (US$ Mn) Forecast, by Country/Sub-region, 2018–2026
Table 48 : Asia Pacific Energy-efficient Lighting Technology – New Installation Market Volume (Million Units) Forecast, by Country/Sub-region, 2018–2026
Table 49 : MEA Energy-efficient Lighting Technology – New Installation Market Value (US$ Mn) Forecast, by Product Type, 2016–2026
Table 50 : MEA Energy-efficient Lighting Technology – New Installation Market Volume (Million Units) Forecast, by Product Type, 2016–2026
Table 51 : MEA Energy-efficient Lighting Technology – New Installation Market Value (US$ Mn) Forecast, by Incandescent Lamp, 2016–2026
Table 52 : MEA Energy-efficient Lighting Technology – New Installation Market Volume (Million Units) Forecast, by Incandescent Lamp, 2016–2026
Table 53 : MEA Energy-efficient Lighting Technology – New Installation Market Value (US$ Mn) Forecast, by Gas Discharge Lamp, 2016–2026
Table 54 : MEA Energy-efficient Lighting Technology – New Installation Market Volume (Million Units) Forecast, by Gas Discharge Lamp, 2016–2026
Table 55 : MEA Energy-efficient Lighting Technology – New Installation Market Value (US$ Mn) Forecast, by Application, 2016–2026
Table 56 : MEA Energy-efficient Lighting Technology – New Installation Market Volume (Million Units) Forecast, by Application, 2016–2026
Table 57 : MEA Energy-efficient Lighting Technology – New Installation Market Value (US$ Mn) Forecast, by Center CCT, 2016–2026
Table 58 : MEA Energy-efficient Lighting Technology – New Installation Market Volume (Million Units) Forecast, by Center CCT, 2016–2026
Table 59 : MEA Energy-efficient Lighting Technology – New Installation Market Value (US$ Mn) Forecast, by Country/Sub-region, 2018–2026
Table 60 : MEA Energy-efficient Lighting Technology – New Installation Market Volume (Million Units) Forecast, by Country/Sub-region, 2018–2026
Table 61 : South America Energy-efficient Lighting Technology – New Installation Market Value (US$ Mn) Forecast, by Product Type, 2016–2026
Table 62 : South America Energy-efficient Lighting Technology – New Installation Market Volume (Million Units) Forecast, by Product Type, 2016–2026
Table 63 : South America Energy-efficient Lighting Technology – New Installation Market Value (US$ Mn) Forecast, by Incandescent Lamp, 2016–2026
Table 64 : South America Energy-efficient Lighting Technology – New Installation Market Volume (Million Units) Forecast, by Incandescent Lamp, 2016–2026
Table 65 : South America Energy-efficient Lighting Technology – New Installation Market Value (US$ Mn) Forecast, by Gas Discharge Lamp, 2016–2026
Table 66 : South America Energy-efficient Lighting Technology – New Installation Market Volume (Million Units) Forecast, by Gas Discharge Lamp, 2016–2026
Table 67 : South America Energy-efficient Lighting Technology – New Installation Market Value (US$ Mn) Forecast, by Application, 2016–2026
Table 68 : South America Energy-efficient Lighting Technology – New Installation Market Volume (Million Units) Forecast, by Application, 2016–2026
Table 69 : South America Energy-efficient Lighting Technology – New Installation Market Value (US$ Mn) Forecast, by Center CCT, 2016–2026
Table 70 : South America Energy-efficient Lighting Technology – New Installation Market Volume (Million Units) Forecast, by Center CCT, 2016–2026
Table 71 : South America Energy-efficient Lighting Technology – New Installation Market Value (US$ Mn) Forecast, by Country/Sub-region, 2018–2026
Table 72 : South America Energy-efficient Lighting Technology – New Installation Market Volume (Million Units) Forecast, by Country/Sub-region, 2018–2026
Table 73 : Global Energy-efficient Lighting Technology – Replacement Market Value (US$ Mn) Forecast, by Product Type, 2016–2026
Table 74 : Global Energy-efficient Lighting Technology – Replacement Market Volume (Million Units) Forecast, by Product Type, 2016–2026
Table 75 : Global Energy-efficient Lighting Technology – Replacement Market Value (US$ Mn) Forecast, by Incandescent Lamp, 2016–2026
Table 76 : Global Energy-efficient Lighting Technology – Replacement Market Volume (Million Units) Forecast, by Incandescent Lamp, 2016–2026
Table 77 : Global Energy-efficient Lighting Technology – Replacement Market Value (US$ Mn) Forecast, by Gas Discharge Lamp, 2016–2026
Table 78 : Global Energy-efficient Lighting Technology – Replacement Market Volume (Million Units) Forecast, by Gas Discharge Lamp, 2016–2026
Table 79 : Global Energy-efficient Lighting Technology – Replacement Market Value (US$ Mn) Forecast, by Application, 2016–2026
Table 80 : Global Energy-efficient Lighting Technology – Replacement Market Volume (Million Units) Forecast, by Application, 2016–2026
Table 81 : Global Energy-efficient Lighting Technology – Replacement Market Value (US$ Mn) Forecast, by Center CCT, 2016–2026
Table 82 : Global Energy-efficient Lighting Technology – Replacement Market Volume (Million Units) Forecast, by Center CCT, 2016–2026
Table 83 : Global Energy-efficient Lighting Technology – Replacement Market Value (US$ Mn) Forecast, by Region, 2016–2026
Table 84 : Global Energy-efficient Lighting Technology – Replacement Market Volume (Million Units) Forecast, by Region, 2016–2026
Table 85 : North America Energy-efficient Lighting Technology – Replacement Market Value (US$ Mn) Forecast, by Product Type, 2016–2026
Table 86 : North America Energy-efficient Lighting Technology – Replacement Market Volume (Million Units) Forecast, by Product Type, 2016–2026
Table 87 : North America Energy-efficient Lighting Technology – Replacement Market Value (US$ Mn) Forecast, by Incandescent Lamp, 2016–2026
Table 88 : North America Energy-efficient Lighting Technology – Replacement Market Volume (Million Units) Forecast, by Incandescent Lamp, 2016–2026
Table 89 : North America Energy-efficient Lighting Technology – Replacement Market Value (US$ Mn) Forecast, by Gas Discharge Lamp, 2016–2026
Table 90 : North America Energy-efficient Lighting Technology – Replacement Market Volume (Million Units) Forecast, by Gas Discharge Lamp, 2016–2026
Table 91 : North America Energy-efficient Lighting Technology – Replacement Market Value (US$ Mn) Forecast, by Application, 2016–2026
Table 92 : North America Energy-efficient Lighting Technology – Replacement Market Volume (Million Units) Forecast, by Application, 2016–2026
Table 93 : North America Energy-efficient Lighting Technology – Replacement Market Value (US$ Mn) Forecast, by Center CCT, 2016–2026
Table 94 : North America Energy-efficient Lighting Technology – Replacement Market Volume (Million Units) Forecast, by Center CCT, 2016–2026
Table 95 : North America Energy-efficient Lighting Technology – Replacement Market Value (US$ Mn) Forecast, by Country/Sub-region, 2018–2026
Table 96 : North America Energy-efficient Lighting Technology – Replacement Market Volume (Million Units) Forecast, by Country/Sub-region, 2018–2026
Table 97 : Europe Energy-efficient Lighting Technology – Replacement Market Value (US$ Mn) Forecast, by Product Type, 2016–2026
Table 98 : Europe Energy-efficient Lighting Technology – Replacement Market Volume (Million Units) Forecast, by Product Type, 2016–2026
Table 99 : Europe Energy-efficient Lighting Technology – Replacement Market Value (US$ Mn) Forecast, by Incandescent Lamp, 2016–2026
Table 100 : Europe Energy-efficient Lighting Technology – Replacement Market Volume (Million Units) Forecast, by Incandescent Lamp, 2016–2026
Table 101 : Europe Energy-efficient Lighting Technology – Replacement Market Value (US$ Mn) Forecast, by Gas Discharge Lamp, 2016–2026
Table 102 : Europe Energy-efficient Lighting Technology – Replacement Market Volume (Million Units) Forecast, by Gas Discharge Lamp, 2016–2026
Table 103 : Europe Energy-efficient Lighting Technology – Replacement Market Value (US$ Mn) Forecast, by Application, 2016–2026
Table 104 : Europe Energy-efficient Lighting Technology – Replacement Market Volume (Million Units) Forecast, by Application, 2016–2026
Table 105 : Europe Energy-efficient Lighting Technology – Replacement Market Value (US$ Mn) Forecast, by Center CCT, 2016–2026
Table 106 : Europe Energy-efficient Lighting Technology – Replacement Market Volume (Million Units) Forecast, by Center CCT, 2016–2026
Table 107 : Europe Energy-efficient Lighting Technology – Replacement Market Value (US$ Mn) Forecast, by Country/Sub-region, 2018–2026
Table 108 : Europe Energy-efficient Lighting Technology – Replacement Market Volume (Million Units) Forecast, by Country/Sub-region, 2018–2026
Table 109 : Asia Pacific Energy-efficient Lighting Technology – Replacement Market Value (US$ Mn) Forecast, by Product Type, 2016–2026
Table 110 : Asia Pacific Energy-efficient Lighting Technology – Replacement Market Volume (Million Units) Forecast, by Product Type, 2016–2026
Table 111 : Asia Pacific Energy-efficient Lighting Technology – Replacement Market Value (US$ Mn) Forecast, by Incandescent Lamp, 2016–2026
Table 112 : Asia Pacific Energy-efficient Lighting Technology – Replacement Market Volume (Million Units) Forecast, by Incandescent Lamp, 2016–2026
Table 113 : Asia Pacific Energy-efficient Lighting Technology – Replacement Market Value (US$ Mn) Forecast, by Gas Discharge Lamp, 2016–2026
Table 114 : Asia Pacific Energy-efficient Lighting Technology – Replacement Market Volume (Million Units) Forecast, by Gas Discharge Lamp, 2016–2026
Table 115 : Asia Pacific Energy-efficient Lighting Technology – Replacement Market Value (US$ Mn) Forecast, by Application, 2016–2026
Table 116 : Asia Pacific Energy-efficient Lighting Technology – Replacement Market Volume (Million Units) Forecast, by Application, 2016–2026
Table 117 : Asia Pacific Energy-efficient Lighting Technology – Replacement Market Value (US$ Mn) Forecast, by Center CCT, 2016–2026
Table 118 : Asia Pacific Energy-efficient Lighting Technology – Replacement Market Volume (Million Units) Forecast, by Center CCT, 2016–2026
Table 119 : Asia Pacific Energy-efficient Lighting Technology – Replacement Market Value (US$ Mn) Forecast, by Country/Sub-region, 2018–2026
Table 120 : Asia Pacific Energy-efficient Lighting Technology – Replacement Market Volume (Million Units) Forecast, by Country/Sub-region, 2018–2026
Table 121 : MEA Energy-efficient Lighting Technology – Replacement Market Value (US$ Mn) Forecast, by Product Type, 2016–2026
Table 122 : MEA Energy-efficient Lighting Technology – Replacement Market Volume (Million Units) Forecast, by Product Type, 2016–2026
Table 123 : MEA Energy-efficient Lighting Technology – Replacement Market Value (US$ Mn) Forecast, by Incandescent Lamp, 2016–2026
Table 124 : MEA Energy-efficient Lighting Technology – Replacement Market Volume (Million Units) Forecast, by Incandescent Lamp, 2016–2026
Table 125 : MEA Energy-efficient Lighting Technology – Replacement Market Value (US$ Mn) Forecast, by Gas Discharge Lamp, 2016–2026
Table 126 : MEA Energy-efficient Lighting Technology – Replacement Market Volume (Million Units) Forecast, by Gas Discharge Lamp, 2016–2026
Table 127 : MEA Energy-efficient Lighting Technology – Replacement Market Value (US$ Mn) Forecast, by Application, 2016–2026
Table 128 : MEA Energy-efficient Lighting Technology – Replacement Market Volume (Million Units) Forecast, by Application, 2016–2026
Table 129 : MEA Energy-efficient Lighting Technology – Replacement Market Value (US$ Mn) Forecast, by Center CCT, 2016–2026
Table 130 : MEA Energy-efficient Lighting Technology – Replacement Market Volume (Million Units) Forecast, by Center CCT, 2016–2026
Table 131 : MEA Energy-efficient Lighting Technology – Replacement Market Value (US$ Mn) Forecast, by Country/Sub-region, 2018–2026
Table 132 : MEA Energy-efficient Lighting Technology – Replacement Market Volume (Million Units) Forecast, by Country/Sub-region, 2018–2026
Table 133 : South America Energy-efficient Lighting Technology – Replacement Market Value (US$ Mn) Forecast, by Product Type, 2016–2026
Table 134 : South America Energy-efficient Lighting Technology – Replacement Market Volume (Million Units) Forecast, by Product Type, 2016–2026
Table 135 : South America Energy-efficient Lighting Technology – Replacement Market Value (US$ Mn) Forecast, by Incandescent Lamp, 2016–2026
Table 136 : South America Energy-efficient Lighting Technology – Replacement Market Volume (Million Units) Forecast, by Incandescent Lamp, 2016–2026
Table 137 : South America Energy-efficient Lighting Technology – Replacement Market Value (US$ Mn) Forecast, by Gas Discharge Lamp, 2016–2026
Table 138 : South America Energy-efficient Lighting Technology – Replacement Market Volume (Million Units) Forecast, by Gas Discharge Lamp, 2016–2026
Table 139 : South America Energy-efficient Lighting Technology – Replacement Market Value (US$ Mn) Forecast, by Application, 2016–2026
Table 140 : South America Energy-efficient Lighting Technology – Replacement Market Volume (Million Units) Forecast, by Application, 2016–2026
Table 141 : South America Energy-efficient Lighting Technology – Replacement Market Value (US$ Mn) Forecast, by Center CCT, 2016–2026
Table 142 : South America Energy-efficient Lighting Technology – Replacement Market Volume (Million Units) Forecast, by Center CCT, 2016–2026
Table 143 : South America Energy-efficient Lighting Technology – Replacement Market Value (US$ Mn) Forecast, by Country/Sub-region, 2018–2026
Table 144 : South America Energy-efficient Lighting Technology – Replacement Market Volume (Million Units) Forecast, by Country/Sub-region, 2018–2026
List of Figures
Figure 1: Global Energy-efficient Lighting Technology – New Installation Market (2018–2026)
Figure 2: Global Energy-efficient Lighting Technology – Replacement Market (2018–2026)
Figure 3: Global Energy-efficient Lighting Technology – New Installation Market, by Region (2017)
Figure 4: Global Energy-efficient Lighting Technology – Replacement Market, by Region (2017)
Figure 5: Key Market Indicators
Figure 6: Value Chain Analysis
Figure 7: Global Energy-efficient Lighting Technology – New Installation Market Value (US$ Mn) Forecast, by Product Type, 2016–2026
Figure 8: Global Energy-efficient Lighting Technology – New Installation Market Volume (Million Units) Forecast, by Product Type, 2016–2026
Figure 9: Global Energy-efficient Lighting Technology – New Installation Market Attractiveness Analysis, by Product Type
Figure 10: Global Energy-efficient Lighting Technology – New Installation Market Value (US$ Mn) Forecast, by Application, 2016–2026
Figure 11: Global Energy-efficient Lighting Technology – New Installation Market Volume (Million Units) Forecast, by Application, 2016–2026
Figure 12: Global Energy-efficient Lighting Technology – New Installation Market Attractiveness Analysis, by Application
Figure 13: Global Energy-efficient Lighting Technology – New Installation Market Attractiveness Analysis, by Center CCT
Figure 14: Global Energy-efficient Lighting Technology – New Installation Market Value (US$ Mn) Forecast, by Region, 2016–2026
Figure 15: Global Energy-efficient Lighting Technology – New Installation Market Volume (Million Units) Forecast, by Region, 2016–2026
Figure 16: Global Energy-efficient Lighting Technology – New Installation Market Attractiveness Analysis, by Region
Figure 17: North America Energy-efficient Lighting Technology – New Installation Market Value (US$ Mn) Forecast, 2018–2026
Figure 18: North America Energy-efficient Lighting Technology – New Installation Market Volume (Million Units) Forecast, 2018–2026
Figure 19: North America Energy-efficient Lighting Technology – New Installation Market Value Share Analysis, by Product Type, 2018 and 2026
Figure 20: North America Energy-efficient Lighting Technology – New Installation Market Value Share Analysis, by Application, 2018 and 2026
Figure 21: North America Energy-efficient Lighting Technology – New Installation Market Value Share Analysis, by Center CCT, 2018 and 2026
Figure 22: North America Energy-efficient Lighting Technology – New Installation Market Value Share Analysis, by Country/Sub-region, 2018 and 2026
Figure 23: North America Energy-efficient Technology Market Attractiveness Analysis, by Product Type
Figure 24: North America Energy-efficient Lighting Technology Market Attractiveness Analysis, by Application
Figure 25: North America Energy-efficient Lighting Technology Market Attractiveness Analysis, by Center CCT
Figure 26: North America Energy-efficient Lighting Technology Market Attractiveness Analysis, by Country/Sub-region
Figure 27: Europe Energy-efficient Lighting Technology – New Installation Market Value (US$ Mn) Forecast, 2018–2026
Figure 28: Europe Energy-efficient Lighting Technology – New Installation Market Volume (Million Units) Forecast, 2018–2026
Figure 29: Europe Energy-efficient Lighting Technology – New Installation Market Value Share Analysis, by Product Type, 2018 and 2026
Figure 30: Europe Energy-efficient Lighting Technology – New Installation Market Value Share Analysis, by Application, 2018 and 2026
Figure 31: Europe Energy-efficient Lighting Technology – New Installation Market Value Share Analysis, by Center CCT, 2018 and 2026
Figure 32: Europe Energy-efficient Lighting Technology – New Installation Market Value Share Analysis, by Country/Sub-region, 2018 and 2026
Figure 33: Europe Energy-efficient Lighting Technology Market Attractiveness Analysis, by Product Type
Figure 34: Europe Energy-efficient Lighting Technology Market Attractiveness Analysis, by Application
Figure 35: Europe Energy-efficient Lighting Technology Market Attractiveness Analysis, by Center CCT
Figure 36: Europe Energy-efficient Lighting Technology Market Attractiveness Analysis, by Country/Sub-region
Figure 37: APAC Energy-efficient Lighting Technology – New Installation Market Value (US$ Mn) Forecast, 2018–2026
Figure 38: APAC Energy-efficient Lighting Technology – New Installation Market Volume (Million Units) Forecast, 2018–2026
Figure 39: APAC Energy-efficient Lighting Technology – New Installation Market Value Share Analysis, by Product Type, 2018 and 2026
Figure 40: APAC Energy-efficient Lighting Technology – New Installation Market Value Share Analysis, by Application, 2018 and 2026
Figure 41: APAC Energy-efficient Lighting Technology – New Installation Market Value Share Analysis, by Center CCT, 2018 and 2026
Figure 42: APAC Energy-efficient Lighting Technology – New Installation Market Value Share Analysis, by Country/Sub-region, 2018 and 2026
Figure 43: APAC Energy-efficient Lighting Technology Market Attractiveness Analysis, by Product Type
Figure 44: APAC Energy-efficient Lighting Technology Market Attractiveness Analysis, by Application
Figure 45: APAC Energy-efficient Lighting Technology Market Attractiveness Analysis, by Center CCT
Figure 46: APAC Energy-efficient Lighting Technology Market Attractiveness Analysis, by Country/Sub-region
Figure 47: MEA Energy-efficient Lighting Technology – New Installation Market Value (US$ Mn) Forecast, 2018–2026
Figure 48: MEA Energy-efficient Lighting Technology – New Installation Market Volume (Million Units) Forecast, 2018–2026
Figure 49: MEA Energy-efficient Lighting Technology – New Installation Market Value Share Analysis, by Product Type, 2018 and 2026
Figure 50: MEA Energy-efficient Lighting Technology – New Installation Market Value Share Analysis, by Application, 2018 and 2026
Figure 51: MEA Energy-efficient Lighting Technology – New Installation Market Value Share Analysis, by Center CCT, 2018 and 2026
Figure 52: MEA Energy-efficient Lighting Technology – New Installation Market Value Share Analysis, by Country/Sub-region, 2018 and 2026
Figure 53: MEA Energy-efficient Lighting Technology Market Attractiveness Analysis, by Product Type
Figure 54: MEA Energy-efficient Lighting Technology Market Attractiveness Analysis, by Application
Figure 55: MEA Energy-efficient Lighting Technology Market Attractiveness Analysis, by Center CCT
Figure 56: MEA Energy-efficient Lighting Technology Market Attractiveness Analysis, by Country/Sub-region
Figure 57: South America Energy-efficient Lighting Technology – New Installation Market Value (US$ Mn) Forecast, 2018–2026
Figure 58: South America Energy-efficient Lighting Technology – New Installation Market Volume (Million Units) Forecast, 2018–2026
Figure 59: South America Energy-efficient Lighting Technology – New Installation Market Value Share Analysis, by Product Type, 2018 and 2026
Figure 60: South America Energy-efficient Lighting Technology – New Installation Market Value Share Analysis, by Application, 2018 and 2026
Figure 61: South America Energy-efficient Lighting Technology – New Installation Market Value Share Analysis, by Center CCT, 2018 and 2026
Figure 62: South America Energy-efficient Lighting Technology – New Installation Market Value Share Analysis, by Country/Sub-region, 2018 and 2026
Figure 63: South America Energy-efficient Lighting Technology Market Attractiveness Analysis, by Product Type
Figure 64: South America Energy-efficient Lighting Technology Market Attractiveness Analysis, by Application
Figure 65: South America Energy-efficient Lighting Technology Market Attractiveness Analysis, by Center CCT
Figure 66: South America Energy-efficient Lighting Technology Market Attractiveness Analysis, by Country/Sub-region
Figure 67: Global Energy-efficient Lighting Technology – Replacement Market Value (US$ Mn) Forecast, by Product Type, 2016–2026
Figure 68: Global Energy-efficient Lighting Technology – Replacement Market Volume (Million Units) Forecast, by Product Type, 2016–2026
Figure 69: Global Energy-efficient Lighting Technology – Replacement Market Attractiveness Analysis, by Product Type
Figure 70: Global Energy-efficient Lighting Technology – Replacement Market Value (US$ Mn) Forecast, by Application, 2016–2026
Figure 71: Global Energy-efficient Lighting Technology – Replacement Market Volume (Million Units) Forecast, by Application, 2016–2026
Figure 72: Global Energy-efficient Lighting Technology – Replacement Market Attractiveness Analysis, by Application
Figure 73: Global Energy-efficient Lighting Technology – Replacement Market Attractiveness Analysis, by Center CCT
Figure 74: Global Energy-efficient Lighting Technology – Replacement Market Value (US$ Mn) Forecast, by Region, 2016–2026
Figure 75: Global Energy-efficient Lighting Technology – Replacement Market Volume (Million Units) Forecast, by Region, 2016–2026
Figure 76: Global Energy-efficient Lighting Technology – Replacement Market Attractiveness Analysis, by Region
Figure 77: North America Energy-efficient Lighting Technology – Replacement Market Value (US$ Mn) Forecast, 2018–2026
Figure 78: North America Energy-efficient Lighting Technology – Replacement Market Volume (Million Units) Forecast, 2018–2026
Figure 79: North America Energy-efficient Lighting Technology – Replacement Market Value Share Analysis, by Product Type, 2018 & 2026
Figure 80: North America Energy-efficient Lighting Technology – Replacement Market Value Share Analysis, by Application, 2018 and 2026
Figure 81: North America Energy-efficient Lighting Technology – Replacement Market Value Share Analysis, by Center CCT, 2018 and 2026
Figure 82: North America Energy-efficient Lighting Technology – Replacement Market Value Share Analysis, by Country/Sub-region, 2018 and 2026
Figure 83: North America Energy-efficient Lighting Technology Market Attractiveness Analysis, by Product Type
Figure 84: North America Energy-efficient Lighting Technology Market Attractiveness Analysis, by Application
Figure 85: North America Energy-efficient Lighting Technology Market Attractiveness Analysis, by Center CCT
Figure 86: North America Energy-efficient Lighting Technology Market Attractiveness Analysis, by Country/Sub-region
Figure 87: Europe Energy-efficient Lighting Technology – Replacement Market Value (US$ Mn) Forecast, 2018–2026
Figure 88: Europe Energy-efficient Lighting Technology – Replacement Market Volume (Million Units) Forecast, 2018–2026
Figure 89: Europe Energy-efficient Lighting Technology – Replacement Market Value Share Analysis, by Product Type, 2018 and 2026
Figure 90: Europe Energy-efficient Lighting Technology – Replacement Market Value Share Analysis, by Application, 2018 and 2026
Figure 91: Europe Energy-efficient Lighting Technology – Replacement Market Value Share Analysis, by Center CCT, 2018 and 2026
Figure 92: Europe Energy-efficient Lighting Technology – Replacement Market Value Share Analysis, by Country/Sub-region, 2018 and 2026
Figure 93: Europe Energy-efficient Lighting Technology Market Attractiveness Analysis, by Product Type
Figure 94: Europe Energy-efficient Lighting Technology Market Attractiveness Analysis, by Application
Figure 95: Europe Energy-efficient Lighting Technology Market Attractiveness Analysis, by Center CCT
Figure 96: Europe Energy-efficient Lighting Technology Market Attractiveness Analysis, by Country/Sub-region
Figure 97: APAC Energy-efficient Lighting Technology – Replacement Market Value (US$ Mn) Forecast, 2018–2026
Figure 98: APAC Energy-efficient Lighting Technology – Replacement Market Volume (Million Units) Forecast, 2018–2026
Figure 99: APAC Energy-efficient Lighting Technology – Replacement Market Value Share Analysis, by Product Type, 2018 and 2026
Figure 100: APAC Energy-efficient Lighting Technology – Replacement Market Value Share Analysis, by Application, 2018 and 2026
Figure 101: APAC Energy-efficient Lighting Technology – Replacement Market Value Share Analysis, by Center CCT, 2018 and 2026
Figure 102: APAC Energy-efficient Lighting Technology – Replacement Market Value Share Analysis, by Country/Sub-region, 2018 and 2026
Figure 103: APAC Energy-efficient Lighting Technology Market Attractiveness Analysis, by Product Type
Figure 104: APAC Energy-efficient Lighting Technology Market Attractiveness Analysis, by Application
Figure 105: APAC Energy-efficient Lighting Technology Market Attractiveness Analysis, by Center CCT
Figure 106: APAC Energy-efficient Lighting Technology Market Attractiveness Analysis, by Country/Sub-region
Figure 107: MEA Energy-efficient Lighting Technology – Replacement Market Value (US$ Mn) Forecast, 2018–2026
Figure 108: MEA Energy-efficient Lighting Technology – Replacement Market Volume (Million Units) Forecast, 2018–2026
Figure 109: MEA Energy-efficient Lighting Technology – Replacement Market Value Share Analysis, by Product Type, 2018 and 2026
Figure 110: MEA Energy-efficient Lighting Technology – Replacement Market Value Share Analysis, by Application, 2018 and 2026
Figure 111: MEA Energy-efficient Lighting Technology – Replacement Market Value Share Analysis, by Center CCT, 2018 and 2026
Figure 112: MEA Energy-efficient Lighting Technology – Replacement Market Value Share Analysis, by Country/Sub-region, 2018 and 2026
Figure 113: MEA Energy-efficient Lighting Technology Market Attractiveness Analysis, by Product Type
Figure 114: MEA Energy-efficient Lighting Technology Market Attractiveness Analysis, by Application
Figure 115: MEA Energy-efficient Lighting Technology Market Attractiveness Analysis, by Center CCT
Figure 116: MEA Energy-efficient Lighting Technology Market Attractiveness Analysis, by Country/Sub-region
Figure 117: South America Energy-efficient Lighting Technology – Replacement Market Value (US$ Mn) Forecast, 2018–2026
Figure 118: South America Energy-efficient Lighting Technology – Replacement Market Volume (Million Units) Forecast, 2018–2026
Figure 119: South America Energy-efficient Lighting Technology – Replacement Market Value Share Analysis, by Product Type, 2018 & 2026
Figure 120: South America Energy-efficient Lighting Technology – Replacement Market Value Share Analysis, by Application, 2018 and 2026
Figure 121: South America Energy-efficient Lighting Technology – Replacement Market Value Share Analysis, by Center CCT, 2018 and 2026
Figure 122: South America Energy-efficient Lighting Technology – Replacement Market Value Share Analysis, by Country/Sub-region, 2018 and 2026
Figure 123: South America Energy-efficient Lighting Technology Market Attractiveness Analysis, by Product Type
Figure 124: South America Energy-efficient Lighting Technology Market Attractiveness Analysis, by Application
Figure 125: South America Energy-efficient Lighting Technology Market Attractiveness Analysis, by Center CCT
Figure 126: South America Energy-efficient Lighting Technology Market Attractiveness Analysis, by Country/Sub-region
Copyright © Transparency Market Research, Inc. All Rights reserved
Trust Online

Energy-efficient Lighting Technology Market