
Reports
Reports
Electronic Shelf Label Market - Snapshot
Electronic shelf label (ESL) is an emerging system used for displaying product pricing and product information on shelves by using wireless communication networks such as radio frequency (RF) technology, and infrared (IR) technology to communicate with the back-end database. These labels help to eliminate the discrepancies in selling price of the products and displays reliable pricing to the customers. Moreover, it helps to enhance the operational efficiency of the store by eliminating the need to check and update paper labels. It also enables retailers to update pricing as frequently as needed and minimizes pricing errors for customers. With increasing applications in most end- use sectors, from organized retail stores to specialty stores, consumer electronics sector to drug stores/pharmacies, ESL systems have grown to become a necessity for nearly all stores dealing with electronic pricing and shelf management.
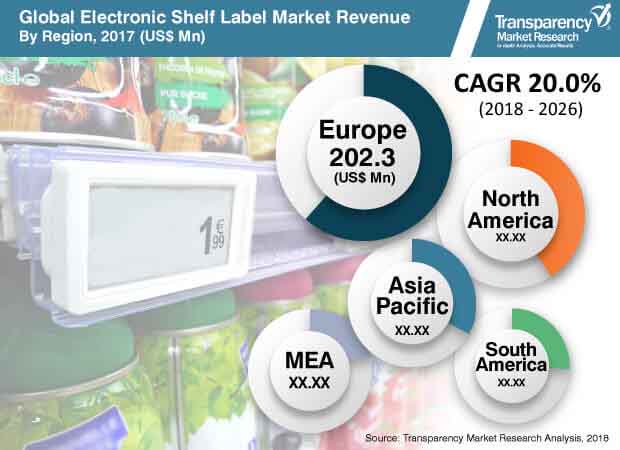
In more recent times, considerable technological advancement has taken place in the ESL market. Organized retail sectors and specialty stores widely use ESL systems for displaying products pricing on shelves. Rising demand from retailers for secure, fast, and cost efficient price labeling has augmented the demand for ESL systems. Growing adoption of store automation in retail stores across the world is primarily driving demand for ESL systems.This is anticipated to drive the market over the forecast period. Moreover,technological advancement and stringent regulations against misleading product prices is expected to fuel the ESLmarket in the near future. However, lack of awareness and usefulness of ESL systems, and high initial investment is projected to inhibit the growth of the market across the world. The ESL market is likely to reach a value of US$ 2,517.9 Mn by 2026 from US$ 497.7 Mn in 2017, expanding at a CAGR of 20.0% during the forecast period.
Based on component, the electronic shelf label market can be segmented into hardware, software and services. Hardware ESL system is the most effective way of displaying product pricing on shelves by using wireless communication networks. The hardware segment accounted for a significant market share globally in 2017 and is projected to hold its leading position over the forecast period. The hardware segment can be divided into labels (product) type and infrastructure. Labels type is further categorized into LCD ESL, segmented E-paper ESL, and full-graphic E-paper ESL. Under labels type, full-graphic E-paper ESL segment accounted for major share of the market due to its multi-color displays, high aesthetics, and wide visibility display. Full-graphic E-paper ESL is energy efficient and is able to project graphical objects such as callouts and logos that facilitate real-time product positioning. Thus, retailers are gradually adopting this label type. LCD ESL labels type sub-segment also accounted for prominent market share due to its low power consumption and bi-stable features. Infrastructure segment is sub-segmented into access points (transceivers & base stations) and handheld devices.
Software segment is projected to expand at a rapid pace during the forecast period. This segment is further bifurcated into pricing and shelf management software, and other digital infrastructure. Pricing and shelf management software sub-segment held the leading market share in 2017 due to its huge adoption rate among organized retailers.The services segment is categorized into support and maintenance, installation, and training and consulting. Among these, installation service sub-segment occupied major share of the global ESL market in 2017,whereas training and consulting sub-segment is projected to expand rapidly over the forecast period.
Based on communication technology, radio frequency (RF) technology segment accounted for the major share in the global electronic shelf label market in 2017 and is projected to maintain its position in the coming yearsdueto its extensive usage in diversified technology segments such as Wi-Fi, Bluetooth Low Energy, ZigBee, and Z-wave. This technology enables bi-directional communication by transmitting pricing and product information to the ESLs and simultaneously receives successful feedback updates. The market for NFC technology is expected to grow at a significant CAGR during the forecast period. It enables communication between tags and labels, and shoppers and store employees to examine the tags and labels manually.This technology is increasingly adopted in devices such as smartphones and POS systems. Thus, retailers are gradually integrating this technology with existing handheld devices to lower the overall installation cost of these labels. As a result, application of NFC technology in ESL systems is expected to witness potential growth in the coming years across the globe.
In terms of end-use, the global ESL market is categorized into organized retail stores, drug store/pharmacies, consumer electronics (standalone), and other specialty stores. Organized retail stores segment includes supermarkets & hypermarkets, and malls. The organized retail stores sector is the prominent user of ESL, while the other specialty stores sector is projected to expand at a rapid pace over the forecast period. The supermarkets & hypermarkets sub-segment accounted for a prominent share of the organized retail stores segment in 2017 due to rising adoption of self service, and is expected to expand steadily during the forecast period. Others specialty stores segment is another major retail store format in the ESL market and is expected to expand at a rapid pace over the forecast period. Other specialty stores segment is bifurcated into multi brand stores and company owned/brand stores. Among these, multi brand stores sub segment accounted for the major market share in 2017, whereas company owned/brand stores segment is projected to expand significantly over the forecast period.
The market in Europe is anticipated to contribute significantly to revenue in the near future due to a large base of existing users in the region. The market in North Americais anticipated to follow a similar trend between 2018 and 2026. Furthermore, the market in Asia Pacific and South America is likely to expand at a robust CAGR in the coming years.
Attracted by the progressively expanding ESL market and underlying embryonic demand, many retailers are driven to invest in advanced electronic shelf label hardware and software systems. Software developers and integrators and professional service providers across industries are strengthening their position in the ESL market. Product innovation and upgrade of research and development are constantly taking place in the ESLmarket. SES-imagotag is the global leader and specialized in digital price tag and shelf edge automation systems.
Prominent players in the ESL market and profiled in the study include Altierre Corp., Displaydata Ltd., Pricer AB, SES-imagotag, E Ink Holdings, Inc., Teraoka Seiko Co., Ltd. and many others.
The global Electronic Shelf Label market is expected to reach US$ 2,517.9 Mn in 2026.
The Electronic Shelf Label Market is growing at a CAGR of 20.0% over the next 5 years.
The major applications in Electronic Shelf Label market include organized retail stores, drug store/pharmacies, consumer electronics (standalone), and other specialty stores
The leading companies in the Electronic Shelf Label market include Altierre Corp., Displaydata Ltd., Pricer AB, SES-imagotag, E Ink Holdings, Inc., Teraoka Seiko Co., Ltd. and many others.
Europe to continue its leading position in Electronic Shelf Label Market, The market in the region is anticipated to expand at a CAGR of 19.4% during the forecast period.
Chapter 1. Preface
1.1. Research Scope
1.2. Market Segmentation
1.3. Research Objectives
1.4. Key Questions Answered
Chapter 2. Assumptions and Research Methodology
2.1. Report Assumptions
2.2. Acronyms Used
2.3. Research Methodology
Chapter 3. Executive Summary
3.1. Electronic Shelf Label Market Snapshot
Chapter 4. Market Overview
4.1. Market Taxonomy
4.2. Product Overview
4.3. Introduction
4.3.1. Global Electronic Shelf Label Market – Macro Economic Factors Overview
4.3.2. World GDP Indicator – For Top 20 Economies (2017)
4.3.3. Global Electronic Shelf Label Market Overview
4.4. Key Industry Developments
4.5. Electronic Shelf Label Market – Pricing Model Analysis
4.6. Key Trends Analysis
4.7. Porter’s Analysis
4.8. Ecosystem Analysis
4.9. Market Dynamics: Drivers and Restraints Snapshot Analysis
4.9.1. Drivers
4.9.2. Restraints
4.9.3. Opportunity
4.10. Opportunity Analysis
4.11. Analysis of Different Applications of ESL
4.12. Global Electronic Shelf Label Market Analysis and Forecast, 2016 - 2026
4.13. Market Opportunity Analysis
4.13.1. Market Opportunity Analysis – By Region (Global/North America/Europe/Asia Pacific/Middle East & Africa/South America)
4.13.1.1. North America Market Opportunity Analysis – by Country (U.S., Canada and Rest of North America)
4.13.1.2. Europe Market Opportunity Analysis – by Country (Germany, U.K., France and Rest of Europe)
4.13.1.3. Asia Pacific Market Opportunity Analysis – by Country (China, India, Japan and Rest of APAC)
4.13.1.4. MEA Market Opportunity Analysis – by Country (GCC, South Africa and Rest of MEA)
4.13.1.5. South America Market Opportunity Analysis – by Country (Brazil and Rest of South America)
4.13.2. Global Market Opportunity Analysis
4.13.2.1. By Component
4.13.2.2. By Communication Technology
4.13.2.3. By End-use
4.13.3. North America Market Opportunity Analysis
4.13.3.1. By Component
4.13.3.2. By Communication Technology
4.13.3.3. By End-use
4.13.4. Europe Market Opportunity Analysis
4.13.4.1. By Component
4.13.4.2. By Communication Technology
4.13.4.3. By End-use
4.13.5. Asia Pacific Market Opportunity Analysis
4.13.5.1. By Component
4.13.5.2. By Communication Technology
4.13.5.3. By End-use
4.13.6. MEA Market Opportunity Analysis
4.13.6.1. By Component
4.13.6.2. By Device Type
4.13.6.3. By End-use
4.13.7. South America Market Opportunity Analysis
4.13.7.1. By Component
4.13.7.2. By Communication Technology
4.13.7.3. By End-use
4.14. Market Outlook
4.15. Competitive Scenario and Trends
Chapter 5. Electronic Shelf Label Market Analysis, by Component
5.1. Key Segment Analysis
5.2. Overview and Definitions
5.3. Key Findings
5.4. Global Electronic Shelf Label Market Revenue Share Analysis, by Component
5.5. Electronic Shelf Label Market Analysis, by Component
5.5.1. Hardware
5.5.1.1. Labels (Product) Type
5.5.1.1.1. LCD ESL
5.5.1.1.2. Segmented E-paper ESL
5.5.1.1.3. Full-graphic E-paper ESL
5.5.1.2. Infrastructure
5.5.1.2.1. Access Points (Transceivers & Base Stations)
5.5.1.2.2. Handheld Devices
5.5.2. Software
5.5.2.1. Pricing and Shelf Management Software
5.5.2.2. Other Digital Infrastructure
5.5.3. Services
5.5.3.1. Support and Maintenance
5.5.3.2. Installation
5.5.3.3. Training and Consulting
Chapter 6. Electronic Shelf Label Market Analysis, by Communication Technology
6.1. Key Segment Analysis
6.2. Overview and Definitions
6.3. Key Findings
6.4. Global Electronic Shelf Label Market Revenue Share Analysis, by Communication Technology
6.5. Electronic Shelf Label Market Revenue Forecast (US$ Mn), by Communication Technology
6.5.1. Radio Frequency (RF)
6.5.2. Infrared (IR)
6.5.3. Near-Field Communication (NFC)
6.5.4. Beacon
Chapter 7. Electronic Shelf Label Market Analysis, by End-use
7.1. Key Segment Analysis
7.2. Overview and Definitions
7.3. Key Findings
7.4. Global Electronic Shelf Label Market Revenue Share Analysis, By End-use
7.5. Global Electronic Shelf Label Market Revenue Forecast (US$ Mn), By End-use
7.5.1. Organized Retail Stores
7.5.1.1. Supermarkets & Hypermarkets
7.5.1.2. Malls
7.5.2. Drugs Store/Pharmacies
7.5.3. Consumer Electronics (Standalone)
7.5.4. Other Specialty Stores
7.5.4.1. Multi Brand Stores
7.5.4.2. Company-owned/Brand Stores
Chapter 8. Global Electronic Shelf Label Market Analysis, by Region
8.1. Global Regulatory Scenario
8.2. Key Findings
8.3. Global Electronic Shelf Label Market Revenue Share Analysis, By Region
8.4. Global Electronic Shelf Label Market Revenue (US$ Mn) Forecast, By Region
8.4.1. North America
8.4.2. Europe
8.4.3. Asia Pacific
8.4.4. Middle East &Africa
8.4.5. South America
Chapter 9. North America Electronic Shelf Label Market Analysis
9.1. Key Trend Analysis
9.2. Regional Dynamics
9.3. North America Electronic Shelf Label Market Overview
9.4. North America Electronic Shelf Label Market Revenue (US$ Mn) Analysis and Forecast, By Component
9.4.1. Hardware
9.4.1.1. Labels (Product) Type
9.4.1.1.1. LCD ESL
9.4.1.1.2. Segmented E-paper ESL
9.4.1.1.3. Full-graphic E-paper ESL
9.4.1.2. Infrastructure
9.4.1.2.1. Access Points (Transceivers & Base Stations)
9.4.1.2.2. Handheld Devices
9.4.2. Software
9.4.2.1. Pricing and Shelf Management Software
9.4.2.2. Other Digital Infrastructure
9.4.3. Services
9.4.3.1. Support and Maintenance
9.4.3.2. Installation
9.4.3.3. Training and Consulting
9.5. North America Electronic Shelf Label Market Revenue (US$ Mn) Analysis and Forecast, By Communication Technology
9.5.1. Radio Frequency (RF)
9.5.2. Infrared (IR)
9.5.3. Near-Field Communication (NFC)
9.5.4. Beacon
9.6. North America Electronic Shelf Label Market Revenue (US$ Mn) Analysis and Forecast, By End-use
9.6.1. Organized Retail Stores
9.6.1.1. Supermarkets & Hypermarkets
9.6.1.2. Malls
9.6.2. Drugs Store/Pharmacies
9.6.3. Consumer Electronics (Standalone)
9.6.4. Other Specialty Stores
9.6.4.1. Multi Brand Stores
9.6.4.2. Company-owned/Brand Stores
9.7. North America Electronic Shelf Label Market Share Analysis, by Country/Sub-region, 2017 & 2026
9.8. North America Electronic Shelf Label Market Forecast, by Country/Sub-region
9.8.1. U.S.
9.8.2. Canada
9.8.3. Rest of America
Chapter 10. Europe Electronic Shelf Label Market Analysis
10.1. Key Trend Analysis
10.2. Regional Dynamics
10.3. Europe Electronic Shelf Label Market Overview
10.4. Europe Electronic Shelf Label Market Revenue (US$ Mn) Analysis and Forecast, By Component
10.4.1. Hardware
10.4.1.1. Labels (Product) Type
10.4.1.1.1. LCD ESL
10.4.1.1.2. Segmented E-paper ESL
10.4.1.1.3. Full-graphic E-paper ESL
10.4.1.2. Infrastructure
10.4.1.2.1. Access Points (Transceivers & Base Stations)
10.4.1.2.2. Handheld Devices
10.4.2. Software
10.4.2.1. Pricing and Shelf Management Software
10.4.2.2. Other Digital Infrastructure
10.4.3. Services
10.4.3.1. Support and Maintenance
10.4.3.2. Installation
10.4.3.3. Training and Consulting
10.5. Europe Electronic Shelf Label Market Revenue (US$ Mn) Analysis and Forecast, By Communication Technology
10.5.1. Radio Frequency (RF)
10.5.2. Infrared (IR)
10.5.3. Near-Field Communication (NFC)
10.5.4. Beacon
10.6. Europe Electronic Shelf Label Market Revenue (US$ Mn) Analysis and Forecast, By End-use
10.6.1. Organized Retail Stores
10.6.1.1. Supermarkets & Hypermarkets
10.6.1.2. Malls
10.6.2. Drugs Store/Pharmacies
10.6.3. Consumer Electronics (Standalone)
10.6.4. Other Specialty Stores
10.6.4.1. Multi Brand Stores
10.6.4.2. Company-owned/Brand Stores
10.7. Europe Electronic Shelf Label Market Share Analysis, by Country/Sub-region, 2017 & 2026
10.8. Europe Electronic Shelf Label Market Forecast, by Country/Sub-region
10.8.1. Germany
10.8.2. U.K.
10.8.3. France
10.8.4. Rest of Europe
Chapter 11. Asia Pacific Electronic Shelf Label Market Analysis
11.1. Key Trend Analysis
11.2. Regional Dynamics
11.3. Asia Pacific Electronic Shelf Label Market Overview
11.4. Asia Pacific Electronic Shelf Label Market Revenue (US$ Mn) Analysis and Forecast, By Component
11.4.1. Hardware
11.4.1.1. Labels (Product) Type
11.4.1.1.1. LCD ESL
11.4.1.1.2. Segmented E-paper ESL
11.4.1.1.3. Full-graphic E-paper ESL
11.4.1.2. Infrastructure
11.4.1.2.1. Access Points (Transceivers & Base Stations)
11.4.1.2.2. Handheld Devices
11.4.2. Software
11.4.2.1. Pricing and Shelf Management Software
11.4.2.2. Other Digital Infrastructure
11.4.3. Services
11.4.3.1. Support and Maintenance
11.4.3.2. Installation
11.4.3.3. Training and Consulting
11.5. Asia Pacific Electronic Shelf Label Market Revenue (US$ Mn) Analysis and Forecast, By Communication Technology
11.5.1. Radio Frequency (RF)
11.5.2. Infrared (IR)
11.5.3. Near-Field Communication (NFC)
11.5.4. Beacon
11.6. Asia Pacific Electronic Shelf Label Market Revenue (US$ Mn) Analysis and Forecast, By End-use
11.6.1. Organized Retail Stores
11.6.1.1. Supermarkets & Hypermarkets
11.6.1.2. Malls
11.6.2. Drugs Store/Pharmacies
11.6.3. Consumer Electronics (Standalone)
11.6.4. Other Specialty Stores
11.6.4.1. Multi Brand Stores
11.6.4.2. Company-owned/Brand Stores
11.7. Asia Pacific Electronic Shelf Label Market Share Analysis, by Country/Sub-region, 2017 & 2026
11.8. Asia Pacific Electronic Shelf Label Market Forecast, by Country/Sub-region
11.8.1. China
11.8.2. India
11.8.3. Japan
11.8.4. Rest of Asia Pacific
Chapter 12. MEA Electronic Shelf Label Market Analysis
12.1. Key Trend Analysis
12.2. Regional Dynamics
12.3. MEA Electronic Shelf Label Market Overview
12.4. MEA Electronic Shelf Label Market Revenue (US$ Mn) Analysis and Forecast, By Component
12.4.1. Hardware
12.4.1.1. Labels (Product) Type
12.4.1.1.1. LCD ESL
12.4.1.1.2. Segmented E-paper ESL
12.4.1.1.3. Full-graphic E-paper ESL
12.4.1.2. Infrastructure
12.4.1.2.1. Access Points (Transceivers & Base Stations)
12.4.1.2.2. Handheld Devices
12.4.2. Software
12.4.2.1. Pricing and Shelf Management Software
12.4.2.2. Other Digital Infrastructure
12.4.3. Services
12.4.3.1. Support and Maintenance
12.4.3.2. Installation
12.4.3.3. Training and Consulting
12.5. MEA Electronic Shelf Label Market Revenue (US$ Mn) Analysis and Forecast, By Communication Technology
12.5.1. Radio Frequency (RF)
12.5.2. Infrared (IR)
12.5.3. Near-Field Communication (NFC)
12.5.4. Beacon
12.6. MEA Electronic Shelf Label Market Revenue (US$ Mn) Analysis and Forecast, By End-use
12.6.1. Organized Retail Stores
12.6.1.1. Supermarkets & Hypermarkets
12.6.1.2. Malls
12.6.2. Drugs Store/Pharmacies
12.6.3. Consumer Electronics (Standalone)
12.6.4. Other Specialty Stores
12.6.4.1. Multi Brand Stores
12.6.4.2. Company-owned/Brand Stores
12.7. MEA Electronic Shelf Label Market Share Analysis, by Country/Sub-region, 2017 & 2026
12.8. MEA Electronic Shelf Label Market Forecast, by Country/Sub-region
12.8.1. GCC
12.8.2. South Africa
12.8.3. Rest of MEA
Chapter 13. South America Electronic Shelf Label Market Analysis
13.1. Key Trend Analysis
13.2. Regional Dynamics
13.3. South America Electronic Shelf Label Market Overview
13.4. South America Electronic Shelf Label Market Revenue (US$ Mn) Analysis and Forecast, By Component
13.4.1. Hardware
13.4.1.1. Labels (Product) Type
13.4.1.1.1. LCD ESL
13.4.1.1.2. Segmented E-paper ESL
13.4.1.1.3. Full-graphic E-paper ESL
13.4.1.2. Infrastructure
13.4.1.2.1. Access Points (Transceivers & Base Stations)
13.4.1.2.2. Handheld Devices
13.4.2. Software
13.4.2.1. Pricing and Shelf Management Software
13.4.2.2. Other Digital Infrastructure
13.4.3. Services
13.4.3.1. Support and Maintenance
13.4.3.2. Installation
13.4.3.3. Training and Consulting
13.5. South America Electronic Shelf Label Market Revenue (US$ Mn) Analysis and Forecast, By Communication Technology
13.5.1. Radio Frequency (RF)
13.5.2. Infrared (IR)
13.5.3. Near-Field Communication (NFC)
13.5.4. Beacon
13.6. South America Electronic Shelf Label Market Revenue (US$ Mn) Analysis and Forecast, By End-use
13.6.1. Organized Retail Stores
13.6.1.1. Supermarkets & Hypermarkets
13.6.1.2. Malls
13.6.2. Drugs Store/Pharmacies
13.6.3. Consumer Electronics (Standalone)
13.6.4. Other Specialty Stores
13.6.4.1. Multi Brand Stores
13.6.4.2. Company-owned/Brand Stores
13.7. South America Electronic Shelf Label Market Share Analysis, by Country/Sub-region, 2017 & 2026
13.8. South America Electronic Shelf Label Market Forecast, by Country/Sub-region
13.8.1. Brazil
13.8.2. Rest of South America
Chapter 14. Company Profiles
14.1. Competition Matrix
14.2. Competitive Landscape: Electronic Shelf Label Market Positioning of Key Players, 2017
14.3. Altierre Corp.
14.3.1. Company Details (HQ, Foundation Year, Employee Strength)
14.3.2. Market Presence, By Segment and Geography
14.3.3. Strategic Overview
14.3.4 . SWOT analysis
14.4. Displaydata Ltd.
14.4.1. Company Details (HQ, Foundation Year, Employee Strength)
14.4.2. Market Presence, By Segment and Geography
14.4.3. Strategic Overview
14.4.4. SWOT analysis
14.5. E Ink Corp.
14.5.1. Company Details (HQ, Foundation Year, Employee Strength)
14.5.2. Market Presence, By Segment and Geography
14.5.3. Strategic Overview
14.5.4. SWOT analysis
14.6. LG Innotek
14.6.1. Company Details (HQ, Foundation Year, Employee Strength)
14.6.2. Market Presence, By Segment and Geography
14.6.3. Strategic Overview
14.6.4 . SWOT analysis
14.6.5. Historical Revenue
14.7. M2Communication
14.7.1. Company Details (HQ, Foundation Year, Employee Strength)
14.7.2. Market Presence, By Segment and Geography
14.7.3. Strategic Overview
14.7.4. SWOT analysis
14.8. Pricer AB
14.8.1. Company Details (HQ, Foundation Year, Employee Strength)
14.8.2. Market Presence, By Segment and Geography
14.8.3. Strategic Overview
14.8.4. SWOT analysis
14.8.5. Historical Revenue
14.9. Samsung Electronics Co., Ltd.
14.9.1. Company Details (HQ, Foundation Year, Employee Strength)
14.9.2. Market Presence, By Segment and Geography
14.9.3. Strategic Overview
14.9.4. SWOT analysis
14.9.5. Historical Revenue
14.1. SES-imagotag
14.10.1. Company Details (HQ, Foundation Year, Employee Strength)
14.10.2. Market Presence, By Segment and Geography
14.10.3. Strategic Overview
14.10.4. SWOT analysis
14.10.5. Historical Revenue
14.11. SoluM
14.11.1. Company Details (HQ, Foundation Year, Employee Strength)
14.11.2. Market Presence, By Segment and Geography
14.11.3. Strategic Overview
14.11.4. SWOT analysis
14.12. Teraoka Seiko Co., Ltd.
14.12.1. Company Details (HQ, Foundation Year, Employee Strength)
14.12.2. Market Presence, By Segment and Geography
14.12.3. Strategic Overview
14.12.4. SWOT analysis
List of Tables
Table 1. World GDP Indicator – For Top 20 Economies
Table 2. Analysis of Different Applications of ESL
Table 3. Global Electronic Shelf Label Market Revenue (US$ Mn) Forecast, by Component, 2016–2026
Table 4. Global Electronic Shelf Label Market Revenue (US$ Mn) Forecast, by Hardware, by Region 2016–2026
Table 5. Global Electronic Shelf Label Market Revenue (US$ Mn) Forecast, by Labels (Product) Type, by Region 2016–2026
Table 6. Global Electronic Shelf Label Market Revenue (US$ Mn) Forecast, by Infrastructure, by Region 2016–2026
Table 7. Global Electronic Shelf Label Market Revenue (US$ Mn) Forecast, by Software, by Region 2016–2026
Table 8. Global Electronic Shelf Label Market Revenue (US$ Mn) Forecast, by Pricing and Shelf Management Software, by Region 2016–2026
Table 9. Global Electronic Shelf Label Market Revenue (US$ Mn) Forecast, by Other Digital Infrastructure, by Region 2016–2026
Table 10. Global Electronic Shelf Label Market Revenue (US$ Mn) Forecast, by Services, by Region 2016–2026
Table 11. Global Electronic Shelf Label Market Revenue (US$ Mn) Forecast, by Support and Maintenance, by Region 2016–2026
Table 12. Global Electronic Shelf Label Market Revenue (US$ Mn) Forecast, by Installation, by Region 2016–2026
Table 13. Global Electronic Shelf Label Market Revenue (US$ Mn) Forecast, by Training and Consulting, by Region 2016–2026
Table 14. Global Electronic Shelf Label Market Revenue (US$ Mn) Forecast, by Communication Technology, 2016–2026
Table 15. Global Electronic Shelf Label Market Revenue (US$ Mn) Forecast, by Radio Frequency (RF), by Region 2016–2026
Table 16. Global Electronic Shelf Label Market Revenue (US$ Mn) Forecast, by Infrared (IR), by Region 2016–2026
Table 17. Global Electronic Shelf Label Market Revenue (US$ Mn) Forecast, by Near Field Communication (NFC), by Region 2016–2026
Table 18. Global Electronic Shelf Label Market Revenue (US$ Mn) Forecast, by Beacon, by Region 2016–2026
Table 19. Global Electronic Shelf Label Market Revenue (US$ Mn) Forecast, by End-use, 2016–2026
Table 20. Global Electronic Shelf Label Market Revenue (US$ Mn) Forecast, by Organized Retail Stores, by Region 2016–2026
Table 21. Global Electronic Shelf Label Market Revenue (US$ Mn) Forecast, by Supermarkets& Hypermarkets, by Region 2016–2026
Table 22. Global Electronic Shelf Label Market Revenue (US$ Mn) Forecast, by Malls, by Region 2016–2026
Table 23. Global Electronic Shelf Label Market Revenue (US$ Mn) Forecast, by Drugs Store/Pharmacies, by Region 2016–2026
Table 24. Global Electronic Shelf Label Market Revenue (US$ Mn) Forecast, by Consumer Electronics (Standalone), by Region 2016–2026
Table 25. Global Electronic Shelf Label Market Revenue (US$ Mn) Forecast, by Other Specialty Stores, by Region 2016–2026
Table 26. Global Electronic Shelf Label Market Revenue (US$ Mn) Forecast, by Multi Brand Stores, by Region 2016–2026
Table 27. Global Electronic Shelf Label Market Revenue (US$ Mn) Forecast, by Company Owned/Brand Stores, by Region 2016–2026
Table 28. Global Electronic Shelf Label Market Revenue (US$ Mn) Forecast, by Region, 2016–2026
Table 29. North America Electronic Shelf Label Market Revenue (US$ Mn) Forecast, by Hardware, 2016–2026
Table 30. North America Electronic Shelf Label Market Revenue (US$ Mn) Forecast, by Software, 2016–2026
Table 31. North America Electronic Shelf Label Market Revenue (US$ Mn) Forecast, by Services, 2016–2026
Table 32. North America Electronic Shelf Label Market Revenue (US$ Mn) Forecast, by Organized Retail Stores, 2016–2026
Table 33. North America Electronic Shelf Label Market Revenue (US$ Mn) Forecast, by Other Specialty Stores, 2016–2026
Table 34. North America Electronic Shelf Label Market Revenue (US$ Mn) Forecast, by Country/Sub-region, 2016–2026
Table 35. Europe Electronic Shelf Label Market Revenue (US$ Mn) Forecast, by Hardware, 2016–2026
Table 36. Europe Electronic Shelf Label Market Revenue (US$ Mn) Forecast, by Software, 2016–2026
Table 37. Europe Electronic Shelf Label Market Revenue (US$ Mn) Forecast, by Services, 2016–2026
Table 38. Europe Electronic Shelf Label Market Revenue (US$ Mn) Forecast, by Organized Retail Stores, 2016–2026
Table 39. Europe Electronic Shelf Label Market Revenue (US$ Mn) Forecast, by Other Specialty Stores, 2016–2026
Table 40. Europe Electronic Shelf Label Market Revenue (US$ Mn) Forecast, by Country/Sub-region, 2016–2026
Table 41. Asia Pacific Electronic Shelf Label Market Revenue (US$ Mn) Forecast, by Hardware, 2016–2026
Table 42. Asia Pacific Electronic Shelf Label Market Revenue (US$ Mn) Forecast, by Software, 2016–2026
Table 43. Asia Pacific Electronic Shelf Label Market Revenue (US$ Mn) Forecast, by Services, 2016–2026
Table 44. Asia Pacific Electronic Shelf Label Market Revenue (US$ Mn) Forecast, by Organized Retail Stores, 2016–2026
Table 45. Asia Pacific Electronic Shelf Label Market Revenue (US$ Mn) Forecast, by Other Specialty Stores, 2016–2026
Table 46. Asia Pacific Electronic Shelf Label Market Revenue (US$ Mn) Forecast, by Country/Sub-region, 2016–2026
Table 47. MEA Electronic Shelf Label Market Revenue (US$ Mn) Forecast, by Hardware, 2016–2026
Table 48. MEA Electronic Shelf Label Market Revenue (US$ Mn) Forecast, by Software, 2016–2026
Table 49. MEA Electronic Shelf Label Market Revenue (US$ Mn) Forecast, by Services, 2016–2026
Table 50. MEA Electronic Shelf Label Market Revenue (US$ Mn) Forecast, by Organized Retail Stores, 2016–2026
Table 51. MEA Electronic Shelf Label Market Revenue (US$ Mn) Forecast, by Other Specialty Stores, 2016–2026
Table 52. MEA Electronic Shelf Label Market Revenue (US$ Mn) Forecast, by Country/Sub-region, 2016–2026
Table 53. South America Electronic Shelf Label Market Revenue (US$ Mn) Forecast, by Hardware, 2016–2026
Table 54. South America Electronic Shelf Label Market Revenue (US$ Mn) Forecast, by Software, 2016–2026
Table 55. South America Electronic Shelf Label Market Revenue (US$ Mn) Forecast, by Services, 2016–2026
Table 56. South America Electronic Shelf Label Market Revenue (US$ Mn) Forecast, by Organized Retail Stores, 2016–2026
Table 57. South America Electronic Shelf Label Market Revenue (US$ Mn) Forecast, by Other Specialty Stores, 2016–2026
Table 58. South America Electronic Shelf Label Market Revenue (US$ Mn) Forecast, by Country/Sub-region, 2016–2026
Table 59. Competition Matrix
List of Figures
Figure 1. Research Methodology
Figure 2. Global ICT Spending (US$ Bn)
Figure 3. Analysis of Preferred Pricing Model, 2017 (%)
Figure 4. Porter’s Analysis
Figure 5. Ecosystem Analysis
Figure 6. Global Electronic Shelf Label Market Revenue (US$ Mn) Forecast and YoY Growth (%), 2016–2026
Figure 7. Global Electronic Shelf Label Market Attractiveness, by Region, 2017-2026
Figure 8. North America Electronic Shelf Label Market Attractiveness, by Country, 2017-2026
Figure 9. Europe Electronic Shelf Label Market Attractiveness, by Country, 2017-2026
Figure 10. Asia Pacific Electronic Shelf Label Market Attractiveness, by Country, 2017-2026
Figure 11. Middle East & Africa (MEA) Electronic Shelf Label Market Attractiveness, by Country, 2017-2026
Figure 12. South America Electronic Shelf Label Market Attractiveness, by Country, 2017-2026
Figure 13. Global Electronic Shelf Label Market Attractiveness, by Component, 2017-2026
Figure 14. Global Electronic Shelf Label Market Attractiveness, by Communication Technology, 2017-2026
Figure 15. Global Electronic Shelf Label Market Attractiveness, by End-use, 2017-2026
Figure 16. North America Electronic Shelf Label Market Attractiveness, by Component, 2017-2026
Figure 17. North America Electronic Shelf Label Market Attractiveness, by Communication Technology, 2017-2026
Figure 18. North America Electronic Shelf Label Market Attractiveness, by End-use, 2017-2026
Figure 19. Europe Electronic Shelf Label Market Attractiveness, by Component, 2017-2026
Figure 20. Europe Electronic Shelf Label Market Attractiveness, by Communication Technology, 2017-2026
Figure 21. Europe Electronic Shelf Label Market Attractiveness, by End-use, 2017-2026
Figure 22. Asia Pacific Electronic Shelf Label Market Attractiveness, by Component, 2017-2026
Figure 23. Asia Pacific Electronic Shelf Label Market Attractiveness, by Communication Technology, 2017-2026
Figure 24. Asia Pacific Electronic Shelf Label Market Attractiveness, by End-use, 2017-2026
Figure 25. MEA Electronic Shelf Label Market Attractiveness, by Component, 2017-2026
Figure 26. MEA Electronic Shelf Label Market Attractiveness, by Communication Technology, 2017-2026
Figure 27. MEA Electronic Shelf Label Market Attractiveness, by End-use, 2017-2026
Figure 28. South America Electronic Shelf Label Market Attractiveness, by Component, 2017-2026
Figure 29. South America Electronic Shelf Label Market Attractiveness, by Communication Technology, 2017-2026
Figure 30. South America Electronic Shelf Label Market Attractiveness, by End-use, 2017-2026
Figure 31. Global Electronic Shelf Label Market Revenue Share (%), By Component, 2017
Figure 32. Global Electronic Shelf Label Market Revenue Share (%), By Communication Technology, 2017
Figure 33. Global Electronic Shelf Label Market Revenue Share (%), By End-use, 2017
Figure 34. Global Electronic Shelf Label Market Revenue Share Analysis by Component, 2017 and 2026
Figure 35. Global Electronic Shelf Label Market, by Hardware, Revenue (US$ Mn) Forecast and YoY Growth (%), 2016–2026
Figure 36. Global Electronic Shelf Label Market, by Software, Revenue (US$ Mn) Forecast and YoY Growth (%), 2016–2026
Figure 37. Global Electronic Shelf Label Market, by Services, Revenue (US$ Mn) Forecast and YoY Growth (%), 2016–2026
Figure 38. Global Electronic Shelf Label Market Revenue Share Analysis, by Communication Technology, 2017 and 2026
Figure 39. Global Electronic Shelf Label Market by Radio Frequency (RF), Revenue (US$ Mn) Forecast and YoY Growth (%), 2016–2026
Figure 40. Global Electronic Shelf Label Market by Infrared (IR), Revenue (US$ Mn) Forecast and YoY Growth (%), 2016–2026
Figure 41. Global Electronic Shelf Label Market by Near Field Communication (NFC), Revenue (US$ Mn) Forecast and YoY Growth (%), 2016–2026
Figure 42. Global Electronic Shelf Label Market by Beacon, Revenue (US$ Mn) Forecast and YoY Growth (%), 2016–2026
Figure 43. Global Electronic Shelf Label Market Revenue Share Analysis, by End-use, 2017 and 2026
Figure 44. Global Electronic Shelf Label Market by Organized Retail Stores, Revenue (US$ Mn) Forecast and YoY Growth (%), 2016–2026
Figure 45. Global Electronic Shelf Label Market by Drugs Store/Pharmacies, Revenue (US$ Mn) Forecast and YoY Growth (%), 2016–2026
Figure 46. Global Electronic Shelf Label Market by Consumer Electronics (Standalone), Revenue (US$ Mn) Forecast and YoY Growth (%), 2016–2026
Figure 47. Global Electronic Shelf Label Market by Other Specialty Stores, Revenue (US$ Mn) Forecast and YoY Growth (%), 2016–2026
Figure 48. Global Electronic Shelf Label Market Revenue Share Analysis, by Region, 2017 and 2026
Figure 49. North America Electronic Shelf Label Market Revenue (US$ Mn) Forecast and YoY Growth (%), 2016–2026
Figure 50. North America Electronic Shelf Label Market Revenue (US$ Mn) Forecast and YoY Growth (%), by Hardware, 2016–2026
Figure 51. North America Electronic Shelf Label Market Revenue (US$ Mn) Forecast and YoY Growth (%), by Software, 2016–2026
Figure 52. North America Electronic Shelf Label Market Revenue (US$ Mn) Forecast and YoY Growth (%), by Services, 2016–2026
Figure 53. North America Electronic Shelf Label Market Revenue (US$ Mn) Forecast and YoY Growth (%), by Radio Frequency (RF), 2016–2026
Figure 54. North America Electronic Shelf Label Market Revenue (US$ Mn) Forecast and YoY Growth (%), by Infrared (IR), 2016–2026
Figure 55. North America Electronic Shelf Label Market Revenue (US$ Mn) Forecast and YoY Growth (%), by Near-Field Communication (NFC), 2016–2026
Figure 56. North America Electronic Shelf Label Market Revenue (US$ Mn) Forecast and YoY Growth (%), by Beacon, 2016–2026
Figure 57. North America Electronic Shelf Label Market Revenue (US$ Mn) Forecast and YoY Growth (%), by Organized Retail Stores, 2016–2026
Figure 58. North America Electronic Shelf Label Market Revenue (US$ Mn) Forecast and YoY Growth (%), by Drugs Store/Pharmacies, 2016–2026
Figure 59. North America Electronic Shelf Label Market Revenue (US$ Mn) Forecast and YoY Growth (%), Consumer Electronics (Standalone), 2016–2026
Figure 60. North America Electronic Shelf Label Market Revenue (US$ Mn) Forecast and YoY Growth (%), by Other Specialty Stores, 2016–2026
Figure 61. North America Electronic Shelf Label Market, Revenue Share Analysis, by Country/Sub-region, 2017 & 2026
Figure 62. Europe Electronic Shelf Label Market Revenue (US$ Mn) Forecast and YoY Growth (%), 2016–2026
Figure 63. Europe Electronic Shelf Label Market Revenue (US$ Mn) Forecast and YoY Growth (%), by Hardware, 2016–2026
Figure 64. Europe Electronic Shelf Label Market Revenue (US$ Mn) Forecast and YoY Growth (%), by Software, 2016–2026
Figure 65. Europe Electronic Shelf Label Market Revenue (US$ Mn) Forecast and YoY Growth (%), by Services, 2016–2026
Figure 66. Europe Electronic Shelf Label Market Revenue (US$ Mn) Forecast and YoY Growth (%), by Radio Frequency (RF), 2016–2026
Figure 67. Europe Electronic Shelf Label Market Revenue (US$ Mn) Forecast and YoY Growth (%), by Infrared (IR), 2016–2026
Figure 68. Europe Electronic Shelf Label Market Revenue (US$ Mn) Forecast and YoY Growth (%), by Near-Field Communication (NFC), 2016–2026
Figure 69. Europe Electronic Shelf Label Market Revenue (US$ Mn) Forecast and YoY Growth (%), by Beacon, 2016–2026
Figure 70. Europe Electronic Shelf Label Market Revenue (US$ Mn) Forecast and YoY Growth (%), by Organized Retail Stores, 2016–2026
Figure 71. Europe Electronic Shelf Label Market Revenue (US$ Mn) Forecast and YoY Growth (%), by Drugs Store/Pharmacies, 2016–2026
Figure 72. Europe Electronic Shelf Label Market Revenue (US$ Mn) Forecast and YoY Growth (%), Consumer Electronics (Standalone), 2016–2026
Figure 73. Europe Electronic Shelf Label Market Revenue (US$ Mn) Forecast and YoY Growth (%), by Other Specialty Stores, 2016–2026
Figure 74. Europe Electronic Shelf Label Market, Revenue Share Analysis, by Country/Sub-region, 2017 & 2026
Figure 75. Asia Pacific Electronic Shelf Label Market Revenue (US$ Mn) Forecast and YoY Growth (%), 2016–2026
Figure 76. Asia Pacific Electronic Shelf Label Market Revenue (US$ Mn) Forecast and YoY Growth (%), by Hardware, 2016–2026
Figure 77. Asia Pacific Electronic Shelf Label Market Revenue (US$ Mn) Forecast and YoY Growth (%), by Software, 2016–2026
Figure 78. Asia Pacific Electronic Shelf Label Market Revenue (US$ Mn) Forecast and YoY Growth (%), by Services, 2016–2026
Figure 79. Asia Pacific Electronic Shelf Label Market Revenue (US$ Mn) Forecast and YoY Growth (%), by Radio Frequency (RF), 2016–2026
Figure 80. Asia Pacific Electronic Shelf Label Market Revenue (US$ Mn) Forecast and YoY Growth (%), by Infrared (IR), 2016–2026
Figure 81. Asia Pacific Electronic Shelf Label Market Revenue (US$ Mn) Forecast and YoY Growth (%), by Near-Field Communication (NFC), 2016–2026
Figure 82. Asia Pacific Electronic Shelf Label Market Revenue (US$ Mn) Forecast and YoY Growth (%), by Beacon, 2016–2026
Figure 83. Asia Pacific Electronic Shelf Label Market Revenue (US$ Mn) Forecast and YoY Growth (%), by Organized Retail Stores, 2016–2026
Figure 84. Asia Pacific Electronic Shelf Label Market Revenue (US$ Mn) Forecast and YoY Growth (%), by Drugs Store/Pharmacies, 2016–2026
Figure 85. Asia Pacific Electronic Shelf Label Market Revenue (US$ Mn) Forecast and YoY Growth (%), Consumer Electronics (Standalone), 2016–2026
Figure 86. Asia Pacific Electronic Shelf Label Market Revenue (US$ Mn) Forecast and YoY Growth (%), by Other Specialty Stores, 2016–2026
Figure 87. Asia Pacific Electronic Shelf Label Market, Revenue Share Analysis, by Country/Sub-region, 2017 & 2026
Figure 88. MEA Electronic Shelf Label Market Revenue (US$ Mn) Forecast and YoY Growth (%), 2016–2026
Figure 89. MEA Electronic Shelf Label Market Revenue (US$ Mn) Forecast and YoY Growth (%), by Hardware, 2016–2026
Figure 90. MEA Electronic Shelf Label Market Revenue (US$ Mn) Forecast and YoY Growth (%), by Software, 2016–2026
Figure 91. MEA Electronic Shelf Label Market Revenue (US$ Mn) Forecast and YoY Growth (%), by Services, 2016–2026
Figure 92. MEA Electronic Shelf Label Market Revenue (US$ Mn) Forecast and YoY Growth (%), by Radio Frequency (RF), 2016–2026
Figure 93. MEA Electronic Shelf Label Market Revenue (US$ Mn) Forecast and YoY Growth (%), by Infrared (IR), 2016–2026
Figure 94. MEA Electronic Shelf Label Market Revenue (US$ Mn) Forecast and YoY Growth (%), by Near-Field Communication (NFC), 2016–2026
Figure 95. MEA Electronic Shelf Label Market Revenue (US$ Mn) Forecast and YoY Growth (%), by Beacon, 2016–2026
Figure 96. MEA Electronic Shelf Label Market Revenue (US$ Mn) Forecast and YoY Growth (%), by Organized Retail Stores, 2016–2026
Figure 97. MEA Electronic Shelf Label Market Revenue (US$ Mn) Forecast and YoY Growth (%), by Drugs Store/Pharmacies, 2016–2026
Figure 98. MEA Electronic Shelf Label Market Revenue (US$ Mn) Forecast and YoY Growth (%), Consumer Electronics (Standalone), 2016–2026
Figure 99. MEA Electronic Shelf Label Market Revenue (US$ Mn) Forecast and YoY Growth (%), by Other Specialty Stores, 2016–2026
Figure 100. MEA Electronic Shelf Label Market, Revenue Share Analysis, by Country/Sub-region, 2017 & 2026
Figure 101. South America Electronic Shelf Label Market Revenue (US$ Mn) Forecast and YoY Growth (%), 2016–2026
Figure 102. South America Electronic Shelf Label Market Revenue (US$ Mn) Forecast and YoY Growth (%), by Hardware, 2016–2026
Figure 103. South America Electronic Shelf Label Market Revenue (US$ Mn) Forecast and YoY Growth (%), by Software, 2016–2026
Figure 104. South America Electronic Shelf Label Market Revenue (US$ Mn) Forecast and YoY Growth (%), by Services, 2016–2026
Figure 105. South America Electronic Shelf Label Market Revenue (US$ Mn) Forecast and YoY Growth (%), by Radio Frequency (RF), 2016–2026
Figure 106. South America Electronic Shelf Label Market Revenue (US$ Mn) Forecast and YoY Growth (%), by Infrared (IR), 2016–2026
Figure 107. South America Electronic Shelf Label Market Revenue (US$ Mn) Forecast and YoY Growth (%), by Near-Field Communication (NFC), 2016–2026
Figure 108. South America Electronic Shelf Label Market Revenue (US$ Mn) Forecast and YoY Growth (%), by Beacon, 2016–2026
Figure 109. South America Electronic Shelf Label Market Revenue (US$ Mn) Forecast and YoY Growth (%), by Organized Retail Stores, 2016–2026
Figure 110. South America Electronic Shelf Label Market Revenue (US$ Mn) Forecast and YoY Growth (%), by Drugs Store/Pharmacies, 2016–2026
Figure 111. South America Electronic Shelf Label Market Revenue (US$ Mn) Forecast and YoY Growth (%), Consumer Electronics (Standalone), 2016–2026
Figure 112. South America Electronic Shelf Label Market Revenue (US$ Mn) Forecast and YoY Growth (%), by Other Specialty Stores, 2016–2026
Figure 113. South America Electronic Shelf Label Market, Revenue Share Analysis, by Country/Sub-region, 2017 & 2026
Figure 114. Competitive Landscape: Electronic Shelf Label Market Positioning of Key Players, 2017
Copyright © Transparency Market Research, Inc. All Rights reserved
Trust Online

Electronic Shelf Label Market Insights, 2018 – 2026