
Reports
Reports
Analysts’ Viewpoint on Edge Computing Market
Edge computing is a new technology that is built on a distributed computing system. This essentially implies that many users can access data from different linked devices. Edge computing solutions are used to minimize network burden and decrease the operation time to milliseconds. Development of the Internet of Things (IoT) technology is one of the primary factors driving the global edge computing market. Technological advancements and increase in usage of 2G, 3G, and 4G long-term evolution (LTE) wireless networks are fueling the demand for IoT edge computing solutions. Furthermore, rise in demand for IoT security solutions to improve security and flexibility of online communications is augmenting the global edge computing market.
Edge computing helps improve cloud computing systems by processing data at the network's edge, close to the source of the data. Widespread usage and acceptance of IoT, which causes cloud foundation overload, is a key factor driving the edge computing market. Transmission of big amount of data places a significant strain on the network. Edge computing examines all data at the source's edge, analyzing it and communicating only important information on it, rather than frequently broadcasting data over the network. Edge computing architecture is built on existing open-source technologies and security. Many telecommunication service providers are adopting edge computing in order to modernize their networks. Thus, the global edge computing market is expected to grow at a decent pace during the forecast period.
Rise in number of connected devices and growth of IoT have resulted in a significant increase in data. This is driving the demand for efficient data access and evaluation. Companies are increasingly relying on centralized cloud computing and storage solutions. For instance, according to Accenture, IIoT is projected to contribute US$ 14.2 Trn to the global economy by 2030. Migrating the complete IT infrastructure to the cloud raises concerns about latency and cost feasibility. As a result, enterprises that use IoT sensors, actuators, and other IoT devices are increasingly interested in edge computing solutions such as edge nodes, devices, and hyper-localized data centers. Furthermore, edge computing augments the existing cloud paradigm by bringing data processing closer to the data source, thus allowing enterprises to make faster decisions. For instance, the Purdue University collaborated with an edge computing solution provider to research and optimize plant growth and food production processes using IoT sensors and devices. The partnership allows the university to use wireless and edge computing technology to gather, collate, process, and communicate massive amounts of data generated by the sensors. The technology helps the university save time and expense by accelerating and improving the accuracy of their research and allowing for faster communication. Thus, growth in adoption of IoT across industries is one of the key factors that is likely to boost the demand for edge computing during the forecast period.
Rise in customer demand and different technology breakthroughs have resulted in the expansion of infrastructure for autonomous and connected vehicles. Autonomous vehicles provide weather, light, and road conditions; and use that information to navigate, control, and drive. Several companies have begun to reinvent edge cloud computing to facilitate autonomous and connected automobile technologies. In April 2021, Honda and Verizon announced a research agreement to investigate how a new connected safety technology uses 5G and multi-access edge computing or mobile edge computing to enable quick, reliable communication between road infrastructure and automobiles in order to prevent road collisions. The companies aim to deliver rapid, dependable, and low-latency data transfer at the edge, which is critical for connected vehicles.
Edge computing in autonomous cars can provide more accurate and faster data usage, allowing edge data centers to dump non-critical data while retaining crucial data within the vehicle. Edge computing, when combined with Artificial Intelligence (AI) and Machine Learning (ML), may also help attain situational awareness in a fraction of time by providing local processing capacity to accelerate the processing of massive data created by autonomous vehicles. Thus, smart driving can efficiently avoid traffic bottlenecks and help reduce road accidents. Several autonomous vehicle manufacturers are projected to invest in the technology in the near future due to the benefits of edge computing. This is likely to bolster the edge computing market.
In terms of revenue, North America is anticipated to hold prominent share of the global market by the end of 2022. The convergence of IIoT and edge computing is creating ideal conditions for firms in the U.S. to transition to link manufacturing. Several companies have started providing platforms for building edge-enabled solutions. Telus Communications and MobiledgeX, Inc. worked together to create the MobiledgeX Early Access Program. The initiative has enabled developers to create, test, and evaluate the usefulness of edge-enabled apps in a low-latency environment.
Rise in usage of connected devices such as smartphones, tablets, and iPad is driving the demand for edge computing solutions in North America. Key players in the region are focusing on launching edge computing solutions to gain a competitive advantage in the market. In May 2020, IBM Corporation and Red Hat, Inc. launched new edge computing solutions, such as IBM Edge Application Manager and IBM Telco Network Cloud Manager, for various organizations in the 5G era. These solutions help enterprises accelerate their transition to edge computing.
Asia Pacific is likely to demonstrate robust growth in the market, led the presence of prominent industry players such as ADLINK Technology Inc., Huawei Technologies Co., Ltd., and Samsung. These leading players are concentrating on new product development in order to expand their product range.
The global edge computing market is consolidated, with a few large-scale vendors controlling a majority of the share. Most of the firms are spending significantly on comprehensive research and development activities, primarily to introduce innovative products. Expansion of product portfolios and mergers and acquisitions are the main strategies adopted by key players. Amazon Web Services (AWS), Inc., Atos, Cisco System, Inc., Dell Technologies, EdgeIQ, Foghorn, HPE, Huawei, IBM Corporation, Litmus Automation, Microsoft Corporation, and Nokia are the prominent entities operating in this market.
Each of these players has been profiled in the edge computing market report based on parameters such as company overview, financial overview, business strategies, product portfolio, business segments, and recent developments.
|
Attribute |
Detail |
|
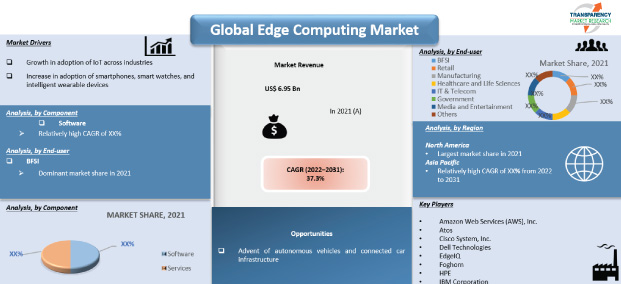
Market Size Value in 2021 |
US$ 6.95 Bn |
|
Market Forecast Value in 2031 |
US$ 161.66 Bn |
|
Growth Rate (CAGR) |
37.3% |
|
Forecast Period |
2022–2031 |
|
Historical Data Available for |
2017–2020 |
|
Quantitative Units |
US$ Bn for Value |
|
Market Analysis |
It includes cross segment analysis at global as well as regional level. Furthermore, qualitative analysis includes drivers, restraints, opportunities, key trends, Porter’s Five Forces analysis, value chain analysis, and key trend analysis. |
|
Competition Landscape |
|
|
Format |
Electronic (PDF) + Excel |
|
Market Segmentation |
|
|
Regions Covered |
|
|
Countries Covered |
|
|
Companies Profiled |
|
|
Customization Scope |
Available upon request |
|
Pricing |
Available upon request |
The edge computing market is expected to reach US$ 161.66 Bn By 2031.
The edge computing market is estimated to grow at a CAGR of 37.3% during the forecast period.
Growth in adoption of IoT across industries is set to drive the global edge computing market.
North America is a more attractive region for vendors in the edge computing market.
Amazon Web Services (AWS), Inc., Atos, Cisco Systems, Inc., Dell Technologies, EdgeIQ, Foghorn, HPE, Huawei, IBM Corporation, Litmus Automation, Microsoft Corporation, and Nokia.
1. Preface
1.1. Market Introduction
1.2. Market Segmentation
1.3. Key Research Objectives
2. Assumptions and Research Methodology
2.1. Research Methodology
2.1.1. List of Primary and Secondary Sources
2.2. Key Assumptions for Data Modelling
3. Executive Summary: Global Edge Computing Market
4. Market Overview
4.1. Market Definition
4.2. Technology/ Product Roadmap
4.3. Market Factor Analysis
4.3.1. Forecast Factors
4.3.2. Ecosystem/ Value Chain Analysis
4.3.3. Market Dynamics (Growth Influencers)
4.3.3.1. Drivers
4.3.3.2. Restraints
4.3.3.3. Opportunities
4.3.3.4. Impact Analysis of Drivers and Restraints
4.4. COVID-19 Impact Analysis
4.4.1. Impact of COVID-19 on Edge Computing Market
4.4.2. End-user Sentiment Analysis: Comparative Analysis on Spending
4.4.2.1. Increase in Spending
4.4.2.2. Decrease in Spending
4.4.3. Short Term and Long Term Impact on the Market
4.5. Market Opportunity Assessment – by Region (North America/ Europe/ Asia Pacific/ Middle East & Africa/ South America)
4.5.1. By Component
4.5.2. By Application
4.5.3. By End-user
5. Global Edge Computing Market Analysis and Forecast
5.1. Market Revenue Analysis (US$ Bn), 2016-2031
5.1.1. Historic Growth Trends, 2016-2021
5.1.2. Forecast Trends, 2022-2031
5.2. Pricing Model Analysis/ Price Trend Analysis
6. Global Edge Computing Market Analysis, by Component
6.1. Overview and Definitions
6.2. Key Segment Analysis
6.3. Edge Computing Market Size (US$ Bn) Forecast, by Component, 2018 - 2031
6.3.1. Hardware
6.3.2. Software
6.3.3. Services
7. Global Edge Computing Market Analysis, by Application
7.1. Overview and Definitions
7.2. Key Segment Analysis
7.3. Edge Computing Market Size (US$ Bn) Forecast, by Application, 2018 - 2031
7.3.1. Smart Cities
7.3.2. Augmented Reality (AR) and Virtual Reality (VR)
7.3.3. Industrial Internet of Things (IIoT)
7.3.4. Remote Monitoring
7.3.5. Others (Autonomous Vehicles and Gaming)
8. Global Edge Computing Market Analysis, by End-user
8.1. Overview and Definitions
8.2. Key Segment Analysis
8.3. Edge Computing Market Size (US$ Bn) Forecast, by End-user, 2018 - 2031
8.3.1. BFSI
8.3.2. Retail
8.3.3. Manufacturing
8.3.4. Healthcare and Life Sciences
8.3.5. IT & Telecom
8.3.6. Government
8.3.7. Media and Entertainment
8.3.8. Others (Energy & Utilities and Transportation & Logistics)
9. Global Edge Computing Market Analysis and Forecasts, by Region
9.1. Key Findings
9.2. Market Size (US$ Bn) Forecast by Region, 2018-2031
9.2.1. North America
9.2.2. Europe
9.2.3. Asia Pacific
9.2.4. Middle East & Africa
9.2.5. South America
10. North America Edge Computing Market Analysis and Forecast
10.1. Regional Outlook
10.2. Edge Computing Market Size (US$ Bn) Analysis and Forecast, 2018 - 2031
10.2.1. By Component
10.2.2. By Application
10.2.3. By End-user
10.3. Edge Computing Market Size (US$ Bn) Forecast, by Country, 2018 - 2031
10.3.1. U.S.
10.3.2. Canada
10.3.3. Mexico
11. Europe Edge Computing Market Analysis and Forecast
11.1. Regional Outlook
11.2. Edge Computing Market Size (US$ Bn) Analysis and Forecast, 2018 - 2031
11.2.1. By Component
11.2.2. By Application
11.2.3. By End-user
11.3. Edge Computing Market Size (US$ Bn) Forecast, by Country & Sub-region, 2018 - 2031
11.3.1. Germany
11.3.2. UK
11.3.3. France
11.3.4. Italy
11.3.5. Spain
11.3.6. Rest of Europe
12. Asia Pacific Edge Computing Market Analysis and Forecast
12.1. Regional Outlook
12.2. Edge Computing Market Size (US$ Bn) Analysis and Forecast, 2018 - 2031
12.2.1. By Component
12.2.2. By Application
12.2.3. By End-user
12.3. Edge Computing Market Size (US$ Bn) Forecast, by Country & Sub-region, 2018 - 2031
12.3.1. China
12.3.2. India
12.3.3. Japan
12.3.4. ASEAN
12.3.5. Rest of Asia Pacific
13. Middle East & Africa Edge Computing Market Analysis and Forecast
13.1. Regional Outlook
13.2. Edge Computing Market Size (US$ Bn) Analysis and Forecast, 2018 - 2031
13.2.1. By Component
13.2.2. By Application
13.2.3. By End-user
13.3. Edge Computing Market Size (US$ Bn) Forecast, by Country & Sub-region, 2018 - 2031
13.3.1. Saudi Arabia
13.3.2. The United Arab Emirates
13.3.3. South Africa
13.3.4. Rest of Middle East & Africa
14. South America Edge Computing Market Analysis and Forecast
14.1. Regional Outlook
14.2. Edge Computing Market Size (US$ Bn) Analysis and Forecast, 2018 - 2031
14.2.1. By Component
14.2.2. By Application
14.2.3. By End-user
14.3. Edge Computing Market Size (US$ Bn) Forecast, by Country & Sub-region, 2018 - 2031
14.3.1. Brazil
14.3.2. Argentina
14.3.3. Rest of South America
15. Competition Landscape
15.1. Market Competition Matrix, by Leading Players
15.2. Market Revenue Share Analysis (%), by Leading Players (2021)
15.3. Competitive Scenario
15.3.1. List of Emerging, Prominent and Leading Players
15.3.2. Major Mergers & Acquisitions, Expansions, Partnership, Contacts, Deals, etc.
16. Company Profiles
16.1. Amazon Web Services (AWS), Inc.
16.1.1. Business Overview
16.1.2. Company Revenue
16.1.3. Product Portfolio
16.1.4. Geographic Footprint
16.1.5. Strategic Partnership
16.1.6. Merger & Acquisition
16.1.7. Business Expansion
16.1.8. New Product Launch
16.1.9. Innovation etc.
16.2. Atos
16.2.1. Business Overview
16.2.2. Company Revenue
16.2.3. Product Portfolio
16.2.4. Geographic Footprint
16.2.5. Strategic Partnership
16.2.6. Merger & Acquisition
16.2.7. Business Expansion
16.2.8. New Product Launch
16.2.9. Innovation etc.
16.3. Cisco System, Inc.
16.3.1. Business Overview
16.3.2. Company Revenue
16.3.3. Product Portfolio
16.3.4. Geographic Footprint
16.3.5. Strategic Partnership
16.3.6. Merger & Acquisition
16.3.7. Business Expansion
16.3.8. New Product Launch
16.3.9. Innovation etc.
16.4. Dell Technologies
16.4.1. Business Overview
16.4.2. Company Revenue
16.4.3. Product Portfolio
16.4.4. Geographic Footprint
16.4.5. Strategic Partnership
16.4.6. Merger & Acquisition
16.4.7. Business Expansion
16.4.8. New Product Launch
16.4.9. Innovation etc.
16.5. EdgeIQ
16.5.1. Business Overview
16.5.2. Company Revenue
16.5.3. Product Portfolio
16.5.4. Geographic Footprint
16.5.5. Strategic Partnership
16.5.6. Merger & Acquisition
16.5.7. Business Expansion
16.5.8. New Product Launch
16.5.9. Innovation etc.
16.6. Foghorn
16.6.1. Business Overview
16.6.2. Company Revenue
16.6.3. Product Portfolio
16.6.4. Geographic Footprint
16.6.5. Strategic Partnership
16.6.6. Merger & Acquisition
16.6.7. Business Expansion
16.6.8. New Product Launch
16.6.9. Innovation etc.
16.7. HPE
16.7.1. Business Overview
16.7.2. Company Revenue
16.7.3. Product Portfolio
16.7.4. Geographic Footprint
16.7.5. Strategic Partnership
16.7.6. Merger & Acquisition
16.7.7. Business Expansion
16.7.8. New Product Launch
16.7.9. Innovation etc.
16.8. Huawei
16.8.1. Business Overview
16.8.2. Company Revenue
16.8.3. Product Portfolio
16.8.4. Geographic Footprint
16.8.5. Strategic Partnership
16.8.6. Merger & Acquisition
16.8.7. Business Expansion
16.8.8. New Product Launch
16.8.9. Innovation etc.
16.9. IBM Corporation
16.9.1. Business Overview
16.9.2. Company Revenue
16.9.3. Product Portfolio
16.9.4. Geographic Footprint
16.9.5. Strategic Partnership
16.9.6. Merger & Acquisition
16.9.7. Business Expansion
16.9.8. New Product Launch
16.9.9. Innovation etc.
16.10. Litmus Automation
16.10.1. Business Overview
16.10.2. Company Revenue
16.10.3. Product Portfolio
16.10.4. Geographic Footprint
16.10.5. Strategic Partnership
16.10.6. Merger & Acquisition
16.10.7. Business Expansion
16.10.8. New Product Launch
16.10.9. Innovation etc.
16.11. Microsoft Corporation
16.11.1. Business Overview
16.11.2. Company Revenue
16.11.3. Product Portfolio
16.11.4. Geographic Footprint
16.11.5. Strategic Partnership
16.11.6. Merger & Acquisition
16.11.7. Business Expansion
16.11.8. New Product Launch
16.11.9. Innovation etc.
16.12. Nokia
16.12.1. Business Overview
16.12.2. Company Revenue
16.12.3. Product Portfolio
16.12.4. Geographic Footprint
16.12.5. Strategic Partnership
16.12.6. Merger & Acquisition
16.12.7. Business Expansion
16.12.8. New Product Launch
16.12.9. Innovation etc.
16.13. Others
16.13.1. Business Overview
16.13.2. Company Revenue
16.13.3. Product Portfolio
16.13.4. Geographic Footprint
16.13.5. Strategic Partnership
16.13.6. Merger & Acquisition
16.13.7. Business Expansion
16.13.8. New Product Launch
16.13.9. Innovation etc.
17. Key Takeaways
List of Tables
Table 1: Acronyms Used in the Edge Computing Market
Table 2: North America Edge Computing Market Revenue Analysis, by Country, 2021 - 2031 (US$ Bn)
Table 3: Europe Edge Computing Market Revenue Analysis, by Country, 2021 - 2031 (US$ Bn)
Table 4: Asia Pacific Edge Computing Market Revenue Analysis, by Country, 2021 - 2031 (US$ Bn)
Table 5: Middle East & Africa Edge Computing Market Revenue Analysis, by Country, 2021 and 2031 (US$ Bn)
Table 6: South America Edge Computing Market Revenue Analysis, by Country, 2021 - 2031 (US$ Bn)
Table 7: Forecast Factors: Relevance and Impact (1/2)
Table 8: Forecast Factors: Relevance and Impact (2/2)
Table 9: Impact Analysis of Drivers & Restraints
Table 10 : List of Companies, Transactions Per Second (TPS), Features, and Pricing
Table 11: List of Companies, Transactions Per Second (TPS), Features, and Pricing
Table 12: Global Edge Computing Market Value (US$ Bn) Forecast, by Component, 2018 – 2031
Table 13: Global Edge Computing Market Value (US$ Bn) Forecast, by Application, 2018 – 2031
Table 14: Global Edge Computing Market Value (US$ Bn) Forecast, by End-user, 2018 – 2031
Table 15: Global Edge Computing Market Volume (US$ Bn) Forecast, by Region, 2018 - 2031
Table 16: North America Edge Computing Market Value (US$ Bn) Forecast, by Component, 2018 – 2031
Table 17: North America Edge Computing Market Value (US$ Bn) Forecast, by Application, 2018 – 2031
Table 18: North America Edge Computing Market Value (US$ Bn) Forecast, by End-user, 2018 – 2031
Table 19: North America Edge Computing Market Value (US$ Bn) Forecast, by Country, 2018 - 2031
Table 20: U.S. Edge Computing Market Revenue CAGR Breakdown (%), by Growth Term
Table 21: Canada Edge Computing Market Revenue CAGR Breakdown (%), by Growth Term
Table 22: Mexico Edge Computing Market Revenue CAGR Breakdown (%), by Growth Term
Table 23: Europe Edge Computing Market Value (US$ Bn) Forecast, by Component, 2018 – 2031
Table 24: Europe Edge Computing Market Value (US$ Bn) Forecast, by Application, 2018 – 2031
Table 25: Europe Edge Computing Market Value (US$ Bn) Forecast, by End-user, 2018 – 2031
Table 26: Europe Edge Computing Market Value (US$ Bn) Forecast, by Country, 2018 - 2031
Table 27: Germany Edge Computing Market Revenue CAGR Breakdown (%), by Growth Term
Table 28: UK Edge Computing Market Revenue CAGR Breakdown (%), by Growth Term
Table 29: France Edge Computing Market Revenue CAGR Breakdown (%), by Growth Term
Table 30: Italy Edge Computing Market Revenue CAGR Breakdown (%), by Growth Term
Table 31: Spain Edge Computing Market Revenue CAGR Breakdown (%), by Growth Term
Table 32: Asia Pacific Edge Computing Market Value (US$ Bn) Forecast, by Component, 2018 – 2031
Table 33: Asia Pacific Edge Computing Market Value (US$ Bn) Forecast, by Application, 2018 – 2031
Table 34: Asia Pacific Edge Computing Market Value (US$ Bn) Forecast, by End-user, 2018 – 2031
Table 35: Asia Pacific Edge Computing Market Value (US$ Bn) Forecast, by Country, 2018 - 2031
Table 36: China Edge Computing Market Revenue CAGR Breakdown (%), by Growth Term
Table 37: India Edge Computing Market Revenue CAGR Breakdown (%), by Growth Term
Table 38: Japan Edge Computing Market Revenue CAGR Breakdown (%), by Growth Term
Table 39: ASEAN Edge Computing Market Revenue CAGR Breakdown (%), by Growth Term
Table 40: Middle East & Africa Edge Computing Market Value (US$ Bn) Forecast, by Component, 2018 – 2031
Table 41: Middle East & Africa Edge Computing Market Value (US$ Bn) Forecast, by Application, 2018 – 2031
Table 42: Middle East & Africa Edge Computing Market Value (US$ Bn) Forecast, by End-user, 2018 – 2031
Table 43: Middle East & Africa Edge Computing Market Value (US$ Bn) Forecast, by Country, 2018 - 2031
Table 44: Saudi Arabia Edge Computing Market Revenue CAGR Breakdown (%), by Growth Term
Table 45: The United Arab Emirates Edge Computing Market Revenue CAGR Breakdown (%), by Growth Term
Table 46: South Africa Edge Computing Market Revenue CAGR Breakdown (%), by Growth Term
Table 47: South America Edge Computing Market Value (US$ Bn) Forecast, by Component, 2018 – 2031
Table 48: South America Edge Computing Market Value (US$ Bn) Forecast, by Application, 2018 – 2031
Table 49: South America Edge Computing Market Value (US$ Bn) Forecast, by End-user, 2018 – 2031
Table 50: South America Edge Computing Market Value (US$ Bn) Forecast, by Country, 2018 - 2031
Table 51: Brazil Edge Computing Market Revenue CAGR Breakdown (%), by Growth Term
Table 52: Argentina Edge Computing Market Revenue CAGR Breakdown (%), by Growth Term
Table 53: Mergers & Acquisitions, Partnerships (1/2)
Table 54: Mergers & Acquisitions, Partnership (2/2)
List of Figures
Figure 1: Global Edge Computing Market Size (US$ Bn) Forecast, 2018–2031
Figure 2: Global Edge Computing Market Revenue (US$ Bn) Opportunity Assessment, by Region, 2021E
Figure 3: Top Segment Analysis of Edge Computing Market
Figure 4: Global Edge Computing Market Revenue (US$ Bn) Opportunity Assessment, by Region, 2031F
Figure 5: GDP (US$ Bn), Top Economies (2015-2020)
Figure 6: Gross Domestic Product (GDP) per Capita; Analysis (US$), By Major Countries, 2015-2020
Figure 7: Global Edge Computing Market Attractiveness Assessment, by Component
Figure 8: Global Edge Computing Market Attractiveness Assessment, by Application
Figure 9: Global Edge Computing Market Attractiveness Assessment, by End-user
Figure 10: Global Edge Computing Market Attractiveness Assessment, by Region
Figure 11: Global Edge Computing Market Revenue (US$ Bn) Historic Trends, 2016 - 2020
Figure 12: Global Edge Computing Market Revenue Opportunity (US$ Bn) Historic Trends, 2016 - 2020
Figure 13: Global Edge Computing Market Value Share Analysis, by Component, 2021
Figure 14: Global Edge Computing Market Value Share Analysis, by Component, 2031
Figure 15: Global Edge Computing Market Absolute Opportunity (US$ Bn), by Hardware, 2021 – 2031
Figure 15: Global Edge Computing Market Absolute Opportunity (US$ Bn), by Software, 2021 – 2031
Figure 16: Global Edge Computing Market Absolute Opportunity (US$ Bn), by Services, 2021 – 2031
Figure 17: Global Edge Computing Market Value Share Analysis, by Application, 2021
Figure 18: Global Edge Computing Market Value Share Analysis, by Application, 2031
Figure 19: Global Edge Computing Market Absolute Opportunity (US$ Bn), by Smart Cities, 2021 – 2031
Figure 20: Global Edge Computing Market Absolute Opportunity (US$ Bn), by Augmented Reality (AR) and Virtual Reality (VR), 2021 – 2031
Figure 20: Global Edge Computing Market Absolute Opportunity (US$ Bn), by Industrial Internet of Things (IIoT), 2021 – 2031
Figure 20: Global Edge Computing Market Absolute Opportunity (US$ Bn), by Remote Monitoring, 2021 – 2031
Figure 20: Global Edge Computing Market Absolute Opportunity (US$ Bn), by Others (Autonomous Vehicles and Gaming), 2021 – 2031
Figure 21: Global Edge Computing Market Value Share Analysis, by End-user, 2021
Figure 22: Global Edge Computing Market Value Share Analysis, by End-user, 2031
Figure 23: Global Edge Computing Market Absolute Opportunity (US$ Bn), by BFSI, 2021 – 2031
Figure 24: Global Edge Computing Market Absolute Opportunity (US$ Bn), by Retail, 2021 – 2031
Figure 25: Global Edge Computing Market Absolute Opportunity (US$ Bn), by Manufacturing, 2021 – 2031
Figure 26: Global Edge Computing Market Absolute Opportunity (US$ Bn), by Healthcare & Life Sciences, 2021 – 2031
Figure 27: Global Edge Computing Market Absolute Opportunity (US$ Bn), by IT & Telecom, 2021 – 2031
Figure 28: Global Edge Computing Market Absolute Opportunity (US$ Bn), by Government, 2021 – 2031
Figure 29: Global Edge Computing Market Absolute Opportunity (US$ Bn), by Media and Entertainment, 2021 – 2031
Figure 30: Global Edge Computing Market Absolute Opportunity (US$ Bn), by Others (Energy & Utilities and Transportation & Logistics) , 2021 – 2031
Figure 31: Global Edge Computing Market Opportunity (US$ Bn), by Region
Figure 32: Global Edge Computing Market Opportunity Share (%), by Region, 2021 – 2031
Figure 33: Global Edge Computing Market Size (US$ Bn), by Region, 2021 & 2031
Figure 34: Global Edge Computing Market Value Share Analysis, by Region, 2021
Figure 35: Global Edge Computing Market Value Share Analysis, by Region, 2031
Figure 36: North America Edge Computing Market Absolute Opportunity (US$ Bn), 2021 – 2031
Figure 37: Europe Edge Computing Market Absolute Opportunity (US$ Bn), 2021 – 2031
Figure 38: Asia Pacific Edge Computing Market Absolute Opportunity (US$ Bn), 2021 – 2031
Figure 39: Middle East & Africa Edge Computing Market Absolute Opportunity (US$ Bn), 2021 – 2031
Figure 40: South America Edge Computing Market Absolute Opportunity (US$ Bn), 2021 – 2031
Figure 31: Global Edge Computing Market Opportunity (US$ Bn), by Region
Figure 32: Global Edge Computing Market Opportunity Share (%), by Region, 2021–2031
Figure 33: Global Edge Computing Market Size (US$ Bn), by Region, 2021 & 2031
Figure 34: Global Edge Computing Market Value Share Analysis, by Region, 2021
Figure 35: Global Edge Computing Market Value Share Analysis, by Region, 2031
Figure 36: North America Edge Computing Market Absolute Opportunity (US$ Bn), 2021 – 2031
Figure 37: Europe Edge Computing Market Absolute Opportunity (US$ Bn), 2021 – 2031
Figure 38: Asia Pacific Edge Computing Market Absolute Opportunity (US$ Bn), 2021 – 2031
Figure 39: Middle East & Africa Edge Computing Market Absolute Opportunity (US$ Bn), 2021 – 2031
Figure 40: South America Edge Computing Market Absolute Opportunity (US$ Bn), 2021 – 2031
Figure 41: North America Edge Computing Revenue Opportunity Share, by Component
Figure 42: North America Edge Computing Revenue Opportunity Share, by Application
Figure 43: North America Edge Computing Revenue Opportunity Share, by End-user
Figure 44: North America Edge Computing Revenue Opportunity Share, by Country
Figure 45: North America Edge Computing Market Value Share Analysis, by Component, 2021
Figure 46: North America Edge Computing Market Value Share Analysis, by Component, 2031
Figure 47: North America Edge Computing Market Absolute Opportunity (US$ Bn), by Hardware, 2021 – 2031
Figure 47: North America Edge Computing Market Absolute Opportunity (US$ Bn), by Software, 2021 – 2031
Figure 48: North America Edge Computing Market Absolute Opportunity (US$ Bn), by Services, 2021 – 2031
Figure 49: North America Edge Computing Market Value Share Analysis, by Application, 2021
Figure 50: North America Edge Computing Market Value Share Analysis, by Application, 2031
Figure 51: North America Edge Computing Market Absolute Opportunity (US$ Bn), by Smart Cities, 2021 – 2031
Figure 52: North America Edge Computing Market Absolute Opportunity (US$ Bn), by Augmented Reality (AR) and Virtual Reality (VR), 2021 – 2031
Figure 52: North America Edge Computing Market Absolute Opportunity (US$ Bn), by Industrial Internet of Things (IIoT), 2021 – 2031
Figure 52: North America Edge Computing Market Absolute Opportunity (US$ Bn), by Remote Monitoring, 2021 – 2031
Figure 52: North America Edge Computing Market Absolute Opportunity (US$ Bn), by Others (Autonomous Vehicles and Gaming), 2021 – 2031
Figure 53: North America Edge Computing Market Value Share Analysis, by End-user, 2021
Figure 54: North America Edge Computing Market Value Share Analysis, by End-user, 2031
Figure 55: North America Edge Computing Market Absolute Opportunity (US$ Bn), by BFSI, 2021 – 2031
Figure 56: North America Edge Computing Market Absolute Opportunity (US$ Bn), by Retail, 2021 – 2031
Figure 57: North America Edge Computing Market Absolute Opportunity (US$ Bn), by Manufacturing, 2021 – 2031
Figure 58: North America Edge Computing Market Absolute Opportunity (US$ Bn), by Healthcare & Life Sciences, 2021 – 2031
Figure 59: North America Edge Computing Market Absolute Opportunity (US$ Bn), by IT & Telecom, 2021 – 2031
Figure 60: North America Edge Computing Market Absolute Opportunity (US$ Bn), by Government, 2021 – 2031
Figure 61: North America Edge Computing Market Absolute Opportunity (US$ Bn), by Media and Entertainment, 2021 – 2031
Figure 62: North America Edge Computing Market Absolute Opportunity (US$ Bn), by Others (Energy & Utilities and Transportation & Logistics), 2021 – 2031
Figure 63: North America Edge Computing Market Value Share Analysis, by Country, 2021
Figure 64: North America Edge Computing Market Value Share Analysis, by Country, 2031
Figure 65: U.S. Edge Computing Market Opportunity Growth Analysis (US$ Bn) Forecast, 2021 – 2031
Figure 66: Canada Edge Computing Market Opportunity Growth Analysis (US$ Bn) Forecast, 2021 – 2031
Figure 67: Mexico Edge Computing Market Opportunity Growth Analysis (US$ Bn) Forecast, 2021 – 2031
Figure 68: Europe Edge Computing Revenue Opportunity Share, by Component
Figure 69: Europe Edge Computing Revenue Opportunity Share, by Application
Figure 70: Europe Edge Computing Revenue Opportunity Share, by End-user
Figure 71: Europe Edge Computing Revenue Opportunity Share, by Country
Figure 72: Europe Edge Computing Market Value Share Analysis, by Component, 2021
Figure 73: Europe Edge Computing Market Value Share Analysis, by Component, 2031
Figure 74: Europe Edge Computing Market Absolute Opportunity (US$ Bn), by Hardware, 2021 – 2031
Figure 74: Europe Edge Computing Market Absolute Opportunity (US$ Bn), by Software, 2021 – 2031
Figure 75: Europe Edge Computing Market Absolute Opportunity (US$ Bn), by Services, 2021 – 2031
Figure 76: Europe Edge Computing Market Value Share Analysis, by Application, 2021
Figure 77: Europe Edge Computing Market Value Share Analysis, by Application, 2031
Figure 78: Europe Edge Computing Market Absolute Opportunity (US$ Bn), by Smart Cities, 2021 – 2031
Figure 79: Europe Edge Computing Market Absolute Opportunity (US$ Bn), by Augmented Reality (AR) and Virtual Reality (VR), 2021 – 2031
Figure 79: Europe Edge Computing Market Absolute Opportunity (US$ Bn), by Industrial Internet of Things (IIoT), 2021 – 2031
Figure 79: Europe Edge Computing Market Absolute Opportunity (US$ Bn), by Remote Monitoring, 2021 – 2031
Figure 79: Europe Edge Computing Market Absolute Opportunity (US$ Bn), by Others (Autonomous Vehicles and Gaming), 2021 – 2031
Figure 80: Europe Edge Computing Market Value Share Analysis, by End-user, 2021
Figure 81: Europe Edge Computing Market Value Share Analysis, by End-user, 2031
Figure 82: Europe Edge Computing Market Absolute Opportunity (US$ Bn), by BFSI, 2021 – 2031
Figure 83: Europe Edge Computing Market Absolute Opportunity (US$ Bn), by Retail, 2021 – 2031
Figure 84: Europe Edge Computing Market Absolute Opportunity (US$ Bn), by Manufacturing, 2021 – 2031
Figure 85: Europe Edge Computing Market Absolute Opportunity (US$ Bn), by Healthcare & Life Sciences, 2021 – 2031
Figure 86: Europe Edge Computing Market Absolute Opportunity (US$ Bn), by IT & Telecom, 2021 – 2031
Figure 87: Europe Edge Computing Market Absolute Opportunity (US$ Bn), by Government, 2021 – 2031
Figure 88: Europe Edge Computing Market Absolute Opportunity (US$ Bn), by Media and Entertainment, 2021 – 2031
Figure 89: Europe Edge Computing Market Absolute Opportunity (US$ Bn), by Others (Energy & Utilities and Transportation & Logistics), 2021 – 2031
Figure 90: Europe Edge Computing Market Value Share Analysis, by Country, 2021
Figure 91: Europe Edge Computing Market Value Share Analysis, by Country, 2031
Figure 92: Germany Edge Computing Market Opportunity Growth Analysis (US$ Bn) Forecast, 2021 – 2031
Figure 93: UK Edge Computing Market Opportunity Growth Analysis (US$ Bn) Forecast, 2021 – 2031
Figure 94: France Edge Computing Market Opportunity Growth Analysis (US$ Bn) Forecast, 2021 – 2031
Figure 95: Italy Edge Computing Market Opportunity Growth Analysis (US$ Bn) Forecast, 2021 – 2031
Figure 96: Spain Edge Computing Market Opportunity Growth Analysis (US$ Bn) Forecast, 2021 – 2031
Figure 97: Asia Pacific Edge Computing Revenue Opportunity Share, by Component
Figure 98: Asia Pacific Edge Computing Revenue Opportunity Share, by Application
Figure 99: Asia Pacific Edge Computing Revenue Opportunity Share, by End-user
Figure 100: Asia Pacific Edge Computing Revenue Opportunity Share, by Country
Figure 101: Asia Pacific Edge Computing Market Value Share Analysis, by Component, 2021
Figure 102: Asia Pacific Edge Computing Market Value Share Analysis, by Component, 2031
Figure 103: Asia Pacific Edge Computing Market Absolute Opportunity (US$ Bn), by Hardware, 2021 – 2031
Figure 103: Asia Pacific Edge Computing Market Absolute Opportunity (US$ Bn), by Software, 2021 – 2031
Figure 104: Asia Pacific Edge Computing Market Absolute Opportunity (US$ Bn), by Services, 2021 – 2031
Figure 105: Asia Pacific Edge Computing Market Value Share Analysis, by Application, 2021
Figure 106: Asia Pacific Edge Computing Market Value Share Analysis, by Application, 2031
Figure 107: Asia Pacific Edge Computing Market Absolute Opportunity (US$ Bn), by Smart Cities, 2021 – 2031
Figure 108: Asia Pacific Edge Computing Market Absolute Opportunity (US$ Bn), by Augmented Reality (AR) and Virtual Reality (VR), 2021 – 2031
Figure 108: Asia Pacific Edge Computing Market Absolute Opportunity (US$ Bn), by Industrial Internet of Things (IIoT), 2021 – 2031
Figure 108: Asia Pacific Edge Computing Market Absolute Opportunity (US$ Bn), by Remote Monitoring, 2021 – 2031
Figure 108: Asia Pacific Edge Computing Market Absolute Opportunity (US$ Bn), by Others (Autonomous Vehicles and Gaming), 2021 – 2031
Figure 109: Asia Pacific Edge Computing Market Value Share Analysis, by End-user, 2021
Figure 110: Asia Pacific Edge Computing Market Value Share Analysis, by End-user, 2031
Figure 111: Asia Pacific Edge Computing Market Absolute Opportunity (US$ Bn), by BFSI, 2021 – 2031
Figure 112: Asia Pacific Edge Computing Market Absolute Opportunity (US$ Bn), by Retail, 2021 – 2031
Figure 113: Asia Pacific Edge Computing Market Absolute Opportunity (US$ Bn), by Manufacturing, 2021 – 2031
Figure 114: Asia Pacific Edge Computing Market Absolute Opportunity (US$ Bn), by Healthcare & Life Sciences, 2021 – 2031
Figure 115: Asia Pacific Edge Computing Market Absolute Opportunity (US$ Bn), by IT & Telecom, 2021 – 2031
Figure 116: Asia Pacific Edge Computing Market Absolute Opportunity (US$ Bn), by Government, 2021 – 2031
Figure 117: Asia Pacific Edge Computing Market Absolute Opportunity (US$ Bn), by Media and Entertainment, 2021 – 2031
Figure 118: Asia Pacific Edge Computing Market Absolute Opportunity (US$ Bn), by Others(Energy & Utilities and Transportation & Logistics), 2021 – 2031
Figure 119: Asia Pacific Edge Computing Market Value Share Analysis, by Country, 2021
Figure 120: Asia Pacific Edge Computing Market Value Share Analysis, by Country, 2031
Figure 121: China Edge Computing Market Opportunity Growth Analysis (US$ Bn) Forecast, 2021 – 2031
Figure 122: India Edge Computing Market Opportunity Growth Analysis (US$ Bn) Forecast, 2021 – 2031
Figure 123: Japan Edge Computing Market Opportunity Growth Analysis (US$ Bn) Forecast, 2021 – 2031
Figure 124: Australia Edge Computing Market Opportunity Growth Analysis (US$ Bn) Forecast, 2021 – 2031
Figure 125: Middle East & Africa Edge Computing Revenue Opportunity Share, by Component
Figure 126: Middle East & Africa Edge Computing Revenue Opportunity Share, by Application
Figure 127: Middle East & Africa Edge Computing Revenue Opportunity Share, by End-user
Figure 128: Middle East & Africa Edge Computing Revenue Opportunity Share, by Country
Figure 129: Middle East & Africa Edge Computing Market Value Share Analysis, by Component, 2021
Figure 130: Middle East & Africa Edge Computing Market Value Share Analysis, by Component, 2031
Figure 131: Middle East & Africa Edge Computing Market Absolute Opportunity (US$ Bn), by Hardware, 2021 – 2031
Figure 131: Middle East & Africa Edge Computing Market Absolute Opportunity (US$ Bn), by Software, 2021 – 2031
Figure 132: Middle East & Africa Edge Computing Market Absolute Opportunity (US$ Bn), by Services, 2021 – 2031
Figure 133: Middle East & Africa Edge Computing Market Value Share Analysis, by Application, 2021
Figure 134: Middle East & Africa Edge Computing Market Value Share Analysis, by Application, 2031
Figure 135: Middle East & Africa Edge Computing Market Absolute Opportunity (US$ Bn), by Smart Cities, 2021 – 2031
Figure 136: Middle East & Africa Edge Computing Market Absolute Opportunity (US$ Bn), by Augmented Reality (AR) and Virtual Reality (VR), 2021 – 2031
Figure 135: Middle East & Africa Edge Computing Market Absolute Opportunity (US$ Bn), by Industrial Internet of Things (IIoT), 2021 – 2031
Figure 135: Middle East & Africa Edge Computing Market Absolute Opportunity (US$ Bn), by Remote Monitoring, 2021 – 2031
Figure 135: Middle East & Africa Edge Computing Market Absolute Opportunity (US$ Bn), by Others (Autonomous Vehicles and Gaming), 2021 – 2031
Figure 137: Middle East & Africa Edge Computing Market Value Share Analysis, by End-user, 2021
Figure 138: Middle East & Africa Edge Computing Market Value Share Analysis, by End-user, 2031
Figure 139: Middle East & Africa Edge Computing Market Absolute Opportunity (US$ Bn), by BFSI, 2021 – 2031
Figure 140: Middle East & Africa Edge Computing Market Absolute Opportunity (US$ Bn), by Retail, 2021 – 2031
Figure 141: Middle East & Africa Edge Computing Market Absolute Opportunity (US$ Bn), by Healthcare & Life Sciences, 2021 – 2031
Figure 142: Middle East & Africa Edge Computing Market Absolute Opportunity (US$ Bn), by IT & Telecom, 2021 – 2031
Figure 143: Middle East & Africa Edge Computing Market Absolute Opportunity (US$ Bn), by Government, 2021 – 2031
Figure 144: Middle East & Africa Edge Computing Market Absolute Opportunity (US$ Bn), by Media and Entertainment, 2021 – 2031
Figure 145: Middle East & Africa Edge Computing Market Absolute Opportunity (US$ Bn), by Others (Energy & Utilities and Transportation & Logistics), 2021 – 2031
Figure 146: Middle East & Africa Edge Computing Market Value Share Analysis, by Country, 2021
Figure 147: Middle East & Africa Edge Computing Market Value Share Analysis, by Country, 2031
Figure 148: Saudi Arabia Edge Computing Market Opportunity Growth Analysis (US$ Bn) Forecast, 2021 – 2031
Figure 149: The United Arab Emirates Edge Computing Market Opportunity Growth Analysis (US$ Bn) Forecast, 2021 – 2031
Figure 150: South Africa Edge Computing Market Opportunity Growth Analysis (US$ Bn) Forecast, 2021 – 2031
Figure 151: South America Edge Computing Revenue Opportunity Share, by Component
Figure 152: South America Edge Computing Revenue Opportunity Share, by Application
Figure 153: South America Edge Computing Revenue Opportunity Share, by End-user
Figure 154: South America Edge Computing Revenue Opportunity Share, by Country
Figure 155: South America Edge Computing Market Value Share Analysis, by Component, 2021
Figure 156: South America Edge Computing Market Value Share Analysis, by Component, 2031
Figure 157: South America Edge Computing Market Absolute Opportunity (US$ Bn), by Hardware, 2021 – 2031
Figure 157: South America Edge Computing Market Absolute Opportunity (US$ Bn), by Software, 2021 – 2031
Figure 158: South America Edge Computing Market Absolute Opportunity (US$ Bn), by Services, 2021 – 2031
Figure 159: South America Edge Computing Market Value Share Analysis, by Application, 2021
Figure 160: South America Edge Computing Market Value Share Analysis, by Application, 2031
Figure 161: South America Edge Computing Market Absolute Opportunity (US$ Bn), by Smart Cities, 2021 – 2031
Figure 162: South America Edge Computing Market Absolute Opportunity (US$ Bn), by Augmented Reality (AR) and Virtual Reality (VR), 2021 – 2031
Figure 161: South America Edge Computing Market Absolute Opportunity (US$ Bn), by Industrial Internet of Things (IIoT), 2021 – 2031
Figure 161: South America Edge Computing Market Absolute Opportunity (US$ Bn), by Remote Monitoring, 2021 – 2031
Figure 161: South America Edge Computing Market Absolute Opportunity (US$ Bn), by Others (Autonomous Vehicles and Gaming), 2021 – 2031
Figure 163: South America Edge Computing Market Value Share Analysis, by End-user, 2021
Figure 164: South America Edge Computing Market Value Share Analysis, by End-user, 2031
Figure 165: South America Edge Computing Market Absolute Opportunity (US$ Bn), by BFSI, 2021 – 2031
Figure 166: South America Edge Computing Market Absolute Opportunity (US$ Bn), by Retail, 2021 – 2031
Figure 167: South America Edge Computing Market Absolute Opportunity (US$ Bn), by Manufacturing, 2021 – 2031
Figure 168: South America Edge Computing Market Absolute Opportunity (US$ Bn), by Healthcare & Life Sciences, 2021 – 2031
Figure 169: South America Edge Computing Market Absolute Opportunity (US$ Bn), by IT & Telecom, 2021 – 2031
Figure 170: South America Edge Computing Market Absolute Opportunity (US$ Bn), by Government, 2021 – 2031
Figure 171: South America Edge Computing Market Absolute Opportunity (US$ Bn), by Media and Entertainment, 2021 – 2031
Figure 172: South America Edge Computing Market Absolute Opportunity (US$ Bn), by Others (Energy & Utilities and Transportation & Logistics), 2021 – 2031
Figure 173: South America Edge Computing Market Value Share Analysis, by Country, 2021
Figure 174: South America Edge Computing Market Value Share Analysis, by Country, 2031
Figure 175: Brazil Edge Computing Market Opportunity Growth Analysis (US$ Bn) Forecast, 2021 – 2031
Figure 176: Argentina Edge Computing Market Opportunity Growth Analysis (US$ Bn) Forecast, 2021 – 2031
Copyright © Transparency Market Research, Inc. All Rights reserved
Trust Online

Edge Computing Market