
Reports
Reports
Analysts’ Viewpoint on E-scrap and Printed Circuit Board (PCB) E-scrap Market Scenario
Growth prospects for the e-scrap and printed circuit board (PCB) e-scrap market appear promising, due to rise in adoption of electronic products and increase in concerns regarding the environmental impact of e-waste. Several electronic gadgets have shorter lifecycles or usage, as consumers frequently prefer buying trending and updated devices. Development of new e-waste scrap collection methods, recycling technologies, and treatment processes is expected to offer lucrative growth opportunities for players in the market. Modern recycling technologies emphasize approaches that promote environment-friendly and cost-effective recycling. Companies in the market are focusing on e-waste in the information and communication technology sector to maintain their business expansion post the COVID-19 pandemic.
E-waste is any discarded electrical or electronic equipment. Household e-waste includes fridges, freezers, computers, electronic devices, solar panels, TVs, monitors, and LED bulbs. E-waste equipment and devices are either obsolete, have ceased to function, or are no longer wanted. Consumer electronic devices such as cellular phones, video cassette players/recorders, radios, stereo equipment, tape players/recorders, answering machines, phonographs, compact disc players/recorders, and calculators are often recycled. E-waste recycling has been gaining traction for the last few years owing to rise in concerns regarding the adverse impact of electronic disposal on human health and the environment.
Various technologies have advanced at a rapid pace in the last few years, with new gadgets being introduced regularly. Consumers prefer the latest electronic devices. Increase in disposable income and the availability of financial services such as EMI, buy now pay later, and zero down payments are prompting users to frequently change devices. Thus, rise in usage of advanced electronic and home appliances is expected to boost the demand for PCB e-waste recycling during the forecast period. TVs, computers, laptops, e-readers, cell phones, and other electronic products have gained exponential popularity in the last few decades. Several electronics manufacturers and retailers accept discarded electronic scraps for recycling.
Expansion of recycling and reuse infrastructure and growth in the printed circuit board connectors market are likely to fuel the global e-scrap and printed circuit board (PCB) e-scrap market. Regional market players, such as Sims Limited, are expanding their network of processing facilities to primarily support metal and electronic recycling. Sims Limited is focused on boosting its presence in Australia. The company specializes in the complete reuse and recycling of redundant computer equipment, TVs, mobile phones, and other electronic materials.
Supportive government programs are also contributing to the growth in market value of e-scrap and printed circuit board (PCB) e-scrap. Governments across the globe are supporting electronic recycling through public-private investments. In October 2022, the Global Environment Facility (GEF) announced a seven-year, US$ 9 Mn UN effort to free eight Caribbean countries ‒ Antigua and Barbuda, Barbados, Belize, Saint Kitts and Nevis, Saint Lucia, Saint Vincent and the Grenadines, Suriname, and Trinidad and Tobago – of notoriously harmful, cancer-causing chemicals. According to the UN Environment Program, the world was expected to generate up to 50 million tons of electronic and electrical waste in 2019, which is equivalent to the weight of all commercial airliners ever built. Less than 20% of the e-waste is formally recycled, with the remaining 80% either destined for landfill or being recycled informally.
However, the lack of infrastructure and financial resources in developing economies is expected to hinder the global e-scrap and printed circuit board (PCB) e-scrap market during the forecast period.
In terms of component, the global e-scrap and printed circuit board (PCB) e-scrap market has been segregated into motherboards, connectors, hard drives, memory cards, RAM, displays, cables, and others. The motherboards segment held major of the market in 2021. Expansion of the telecommunication market, rapid miniaturization, shorter product lifecycles, and the availability of devices at affordable prices are driving the segment.
The connectors segment is expected to grow significantly during the forecast period due to expansion in electronics and electronic vehicle industries. Electronic connectors are used for electrically connecting or disconnecting circuits. They are employed in installation, assembly, and supply of power to electrical devices.
Based on source, the global e-scrap and printed circuit board (PCB) e-scrap market has been classified into household appliances, IT & telecommunication hardware, smartphones & tablets, computers & laptops, industrial electronics, printers & scanners, entertainment devices (TVs, speakers, etc.), and others. According to the emerging trends of the e-scrap and printed circuit board (PCB) e-scrap market, the smartphones & tablets segment held major share of 19% of the market in 2021. Growth of the segment can be ascribed to increase in adoption of smartphones & tablets worldwide. The world produces around 50 million metric tons of e-waste annually, 10% of which includes small electronics such as smartphones. Rare and valuable materials in smartphones and tablets end up in landfills. According to a study published by researchers from Plymouth University, smartphones contain 900 mg of tungsten, 70 mg of cobalt, 90 mg of silver, 36 mg of gold, and other rare materials.
Europe dominated the global e-scrap and printed circuit board (PCB) e-scrap market in 2021. The region was closely followed by Asia Pacific and North America, respectively, in the same year. The market scope for e-scrap and printed circuit board (PCB) e-scrap appears promising in Europe due to increase in the collection of e-waste. According to the study - The Global E-waste Monitor 2020, in 2019, Europe recorded the highest collection and recycling rate of 42.5%, followed by Asia (11.7%), the Americas (9.4%), Oceania (8.8%), and Africa (0.9%).
Asia Pacific is the fastest-growing market for the e-scrap and printed circuit board (PCB) e-scrap market due to surge in the usage of electronic devices, rise in the recycling of e-waste, and the expansion of the smart home appliances market in the region. Demand for e-scrap and printed circuit board (PCB) e-scrap is higher in Middle East & Africa than that in South America; however, the market in South America is estimated to grow at a faster pace as compared to that in Middle East & Africa.
The global e-scrap and printed circuit board (PCB) e-scrap market is consolidated, with a small number of large-scale vendors controlling majority of the market share. Key firms are investing significantly in comprehensive R&D to enhance their market share. Expansion of service portfolios and mergers & acquisitions are major strategies adopted by market players. Aurubis AG, Boliden Group, DOWA ECO-SYSTEM Co., Ltd., ERI, E-scrap, Inc., Quantum Lifecycle Partners, Sims Limited, Spas Recycling Pvt. Ltd., Umicore, and Zolopik E-Waste Recycling Trivendent Technologies Pvt. Ltd. are prominent entities operating in this market.
Each of these players has been profiled in the e-scrap and printed circuit board (PCB) e-scrap market report based on parameters such as company overview, financial overview, business strategies, product portfolio, business segments, and recent developments.
|
Attribute |
Detail |
|
Market Size Value in 2021 |
US$ 69.2 Bn |
|
Market Forecast Value in 2031 |
US$ 230.3 Bn |
|
Growth Rate (CAGR) |
12.9% |
|
Forecast Period |
2022–2031 |
|
Historical Data Available for |
2017–2020 |
|
Quantitative Units |
US$ Bn for Value and Million Units and Metric Tons for Volume |
|
Market Analysis |
It includes cross segment analysis at global as well as regional level. Furthermore, qualitative analysis includes drivers, restraints, opportunities, key trends, Porter’s Five Forces analysis, value chain analysis, and key trend analysis. |
|
Competition Landscape |
|
|
Format |
Electronic (PDF) + Excel |
|
Market Segmentation |
|
|
Regions Covered |
|
|
Countries Covered |
|
|
Companies Profiled |
|
|
Customization Scope |
Available upon request |
|
Pricing |
Available upon request |
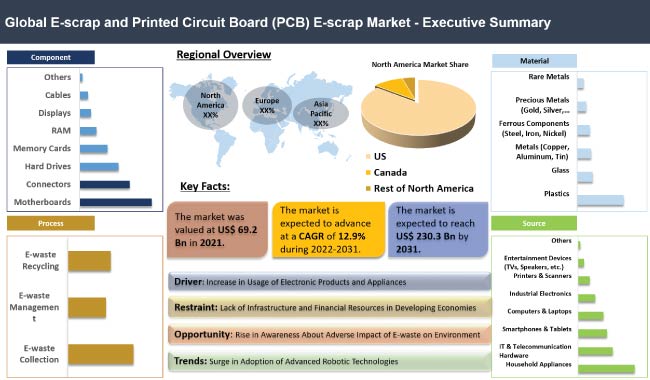
The e-scrap and printed circuit board (PCB) e-scrap market stood at US$ 69.2 Bn in 2021.
The e-scrap and printed circuit board (PCB) e-scrap market is expected to advance at a CAGR of 12.9% by 2031.
The e-scrap and printed circuit board (PCB) e-scrap market is estimated to reach a value of US$ 230.3 Bn in 2031.
The U.S. accounted for 17% share of the global e-scrap and printed circuit board (PCB) e-scrap market in 2021.
The IT & telecommunication hardware segment is expected to hold approximately 10% share of the e-scrap and printed circuit board (PCB) e-scrap market.
Increase in adoption of electronic products and appliances and expansion of recycle and reuse infrastructure.
Asia Pacific is more lucrative region in the global e-scrap and printed circuit board (PCB) e-scrap market.
Aurubis AG, Boliden Group, DOWA ECO-SYSTEM Co.,Ltd., ERI, E-Scrap, Inc., Quantum Lifecycle Partners, Sims Limited, Spas Recycling Pvt Ltd., Umicore, and Zolopik E-Waste Recycling Trivendent Technologies Pvt. Ltd.
1. Preface
1.1. Market Introduction
1.2. Market and Segments Definition
1.3. Market Taxonomy
1.4. Research Methodology
1.5. Assumption and Acronyms
2. Executive Summary
2.1. Global E-scrap and Printed Circuit Board (PCB) E-scrap Market Overview
2.2. Regional Outline
2.3. Industry Outline
2.4. Market Dynamics Snapshot
2.5. Competition Blueprint
3. Market Dynamics
3.1. Macro-economic Factors
3.2. Drivers
3.3. Restraints
3.4. Opportunities
3.5. Key Trends
3.6. Regulatory Scenario
4. Associated Industry and Key Indicator Assessment
4.1. Parent Industry Overview – Global Waste Recycling Industry Overview
4.2. Supply Chain Analysis
4.3. Pricing Trend Analysis
4.4. Technology Roadmap Analysis
4.5. Industry SWOT Analysis
4.6. Porter Five Forces Analysis
4.7. COVID-19 Impact and Recovery Analysis
5. E-scrap and Printed Circuit Board (PCB) E-scrap Market Analysis, by Component
5.1. E-scrap and Printed Circuit Board (PCB) E-scrap Market Size (US$ Bn) and Volume (Million Units) Analysis & Forecast, by Component, 2017–2031
5.1.1. Motherboards
5.1.2. Connectors
5.1.3. Hard Drives
5.1.4. Memory Cards
5.1.5. RAM
5.1.6. Displays
5.1.7. Cables
5.1.8. Others
5.2. Market Attractiveness Analysis, by Component
6. E-scrap and Printed Circuit Board (PCB) E-scrap Market Analysis, by Material
6.1. E-scrap and Printed Circuit Board (PCB) E-scrap Market Size (US$ Bn) and Volume (Metric Tons) Analysis & Forecast, by Material, 2017–2031
6.1.1. Plastics
6.1.2. Glass
6.1.3. Metals (Copper, Aluminum, Tin)
6.1.4. Ferrous Components (Steel, Iron, Nickel)
6.1.5. Precious Metals (Gold, Silver, Palladium, etc.)
6.1.6. Rare Metals
6.2. Market Attractiveness Analysis, by Material
7. E-scrap and Printed Circuit Board (PCB) E-scrap Market Analysis, by Source
7.1. E-scrap and Printed Circuit Board (PCB) E-scrap Market Size (US$ Bn) Analysis & Forecast, by Source, 2017–2031
7.1.1. Household Appliances
7.1.2. IT & Telecommunication Hardware
7.1.3. Smartphones & Tablets
7.1.4. Computers & Laptops
7.1.5. Industrial Electronics
7.1.6. Printers & Scanners
7.1.7. Entertainment Devices (TVs, Speakers, etc.)
7.1.8. Others
7.2. Market Attractiveness Analysis, by Source
8. E-scrap and Printed Circuit Board (PCB) E-scrap Market Analysis, by Process
8.1. E-scrap and Printed Circuit Board (PCB) E-scrap Market Size (US$ Bn) Analysis & Forecast, by Process, 2017–2031
8.1.1. E-waste Collection
8.1.2. E-waste Management
8.1.3. E-waste Recycling
8.2. Market Attractiveness Analysis, by Process
9. E-scrap and Printed Circuit Board (PCB) E-scrap Market Analysis and Forecast, by Region
9.1. E-scrap and Printed Circuit Board (PCB) E-scrap Market Size (US$ Bn) and Volume (Million Units & Metric Tons) Analysis & Forecast, by Region, 2017–2031
9.1.1. North America
9.1.2. Europe
9.1.3. Asia Pacific
9.1.4. Middle East & Africa
9.1.5. South America
9.2. Market Attractiveness Analysis, by Region
10. North America E-scrap and Printed Circuit Board (PCB) E-scrap Market Analysis and Forecast
10.1. Market Snapshot
10.2. Drivers and Restraints: Impact Analysis
10.3. E-scrap and Printed Circuit Board (PCB) E-scrap Market Size (US$ Bn) and Volume (Million Units) Analysis & Forecast, by Component, 2017–2031
10.3.1. Motherboards
10.3.2. Connectors
10.3.3. Hard Drives
10.3.4. Memory Cards
10.3.5. RAM
10.3.6. Displays
10.3.7. Cables
10.3.8. Others
10.4. E-scrap and Printed Circuit Board (PCB) E-scrap Market Size (US$ Bn) and Volume (Metric Tons) Analysis & Forecast, by Material, 2017–2031
10.4.1. Plastics
10.4.2. Glass
10.4.3. Metals (Copper, Aluminum, Tin)
10.4.4. Ferrous Components (Steel, Iron, Nickel)
10.4.5. Precious Metals (Gold, Silver, Palladium, etc.)
10.4.6. Rare Metals
10.5. E-scrap and Printed Circuit Board (PCB) E-scrap Market Size (US$ Bn) Analysis & Forecast, by Source, 2017–2031
10.5.1. Household Appliances
10.5.2. IT & Telecommunication Hardware
10.5.3. Smartphones & Tablets
10.5.4. Computers & Laptops
10.5.5. Industrial Electronics
10.5.6. Printers & Scanners
10.5.7. Entertainment Devices (TVs, Speakers, etc.)
10.5.8. Others
10.6. E-scrap and Printed Circuit Board (PCB) E-scrap Market Size (US$ Bn) Analysis & Forecast, by Process, 2017–2031
10.6.1. E-waste Collection
10.6.2. E-waste Management
10.6.3. E-waste Recycling
10.7. E-scrap and Printed Circuit Board (PCB) E-scrap Market Size (US$ Bn) and Volume (Million Units & Metric Tons) Analysis & Forecast, by Country and Sub-region, 2017–2031
10.7.1. The U.S.
10.7.2. Canada
10.7.3. Rest of North America
10.8. Market Attractiveness Analysis
10.8.1. By Component
10.8.2. By Material
10.8.3. By Source
10.8.4. By Process
10.8.5. By Country/Sub-region
11. Europe E-scrap and Printed Circuit Board (PCB) E-scrap Market Analysis and Forecast
11.1. Market Snapshot
11.2. Drivers and Restraints: Impact Analysis
11.3. E-scrap and Printed Circuit Board (PCB) E-scrap Market Size (US$ Bn) and Volume (Million Units) Analysis & Forecast, by Component, 2017–2031
11.3.1. Motherboards
11.3.2. Connectors
11.3.3. Hard Drives
11.3.4. Memory Cards
11.3.5. RAM
11.3.6. Displays
11.3.7. Cables
11.3.8. Others
11.4. E-scrap and Printed Circuit Board (PCB) E-scrap Market Size (US$ Bn) and Volume (Metric Tons) Analysis & Forecast, by Material, 2017–2031
11.4.1. Plastics
11.4.2. Glass
11.4.3. Metals (Copper, Aluminum, Tin)
11.4.4. Ferrous Components (Steel, Iron, Nickel)
11.4.5. Precious Metals (Gold, Silver, Palladium, etc.)
11.4.6. Rare Metals
11.5. E-scrap and Printed Circuit Board (PCB) E-scrap Market Size (US$ Bn) Analysis & Forecast, by Source, 2017–2031
11.5.1. Household Appliances
11.5.2. IT & Telecommunication Hardware
11.5.3. Smartphones & Tablets
11.5.4. Computers & Laptops
11.5.5. Industrial Electronics
11.5.6. Printers & Scanners
11.5.7. Entertainment Devices (TVs, Speakers, etc.)
11.5.8. Others
11.6. E-scrap and Printed Circuit Board (PCB) E-scrap Market Size (US$ Bn) Analysis & Forecast, by Process, 2017–2031
11.6.1. E-waste Collection
11.6.2. E-waste Management
11.6.3. E-waste Recycling
11.7. E-scrap and Printed Circuit Board (PCB) E-scrap Market Size (US$ Bn) and Volume (Million Units & Metric Tons) Analysis & Forecast, by Country and Sub-region, 2017–2031
11.7.1. The U.K.
11.7.2. Germany
11.7.3. France
11.7.4. Rest of Europe
11.8. Market Attractiveness Analysis
11.8.1. By Component
11.8.2. By Material
11.8.3. By Source
11.8.4. By Process
11.8.5. By Country/Sub-region
12. Asia Pacific E-scrap and Printed Circuit Board (PCB) E-scrap Market Analysis and Forecast
12.1. Market Snapshot
12.2. Drivers and Restraints: Impact Analysis
12.3. E-scrap and Printed Circuit Board (PCB) E-scrap Market Size (US$ Bn) and Volume (Million Units) Analysis & Forecast, by Component, 2017–2031
12.3.1. Motherboards
12.3.2. Connectors
12.3.3. Hard Drives
12.3.4. Memory Cards
12.3.5. RAM
12.3.6. Displays
12.3.7. Cables
12.3.8. Others
12.4. E-scrap and Printed Circuit Board (PCB) E-scrap Market Size (US$ Bn) and Volume (Metric Tons) Analysis & Forecast, by Material, 2017–2031
12.4.1. Plastics
12.4.2. Glass
12.4.3. Metals (Copper, Aluminum, Tin)
12.4.4. Ferrous Components (Steel, Iron, Nickel)
12.4.5. Precious Metals (Gold, Silver, Palladium, etc.)
12.4.6. Rare Metals
12.5. E-scrap and Printed Circuit Board (PCB) E-scrap Market Size (US$ Bn) Analysis & Forecast, by Source, 2017–2031
12.5.1. Household Appliances
12.5.2. IT & Telecommunication Hardware
12.5.3. Smartphones & Tablets
12.5.4. Computers & Laptops
12.5.5. Industrial Electronics
12.5.6. Printers & Scanners
12.5.7. Entertainment Devices (TVs, Speakers, etc.)
12.5.8. Others
12.6. E-scrap and Printed Circuit Board (PCB) E-scrap Market Size (US$ Bn) Analysis & Forecast, by Process, 2017–2031
12.6.1. E-waste Collection
12.6.2. E-waste Management
12.6.3. E-waste Recycling
12.7. E-scrap and Printed Circuit Board (PCB) E-scrap Market Size (US$ Bn) and Volume (Million Units & Metric Tons) Analysis & Forecast, by Country and Sub-region, 2017–2031
12.7.1. China
12.7.2. Japan
12.7.3. India
12.7.4. South Korea
12.7.5. ASEAN
12.7.6. Rest of Asia Pacific
12.8. Market Attractiveness Analysis
12.8.1. By Component
12.8.2. By Material
12.8.3. By Source
12.8.4. By Process
12.8.5. By Country/Sub-region
13. Middle East & Africa E-scrap and Printed Circuit Board (PCB) E-scrap Market Analysis and Forecast
13.1. Market Snapshot
13.2. Drivers and Restraints: Impact Analysis
13.3. E-scrap and Printed Circuit Board (PCB) E-scrap Market Size (US$ Bn) and Volume (Million Units) Analysis & Forecast, by Component, 2017–2031
13.3.1. Motherboards
13.3.2. Connectors
13.3.3. Hard Drives
13.3.4. Memory Cards
13.3.5. RAM
13.3.6. Displays
13.3.7. Cables
13.3.8. Others
13.4. E-scrap and Printed Circuit Board (PCB) E-scrap Market Size (US$ Bn) and Volume (Metric Tons) Analysis & Forecast, by Material, 2017–2031
13.4.1. Plastics
13.4.2. Glass
13.4.3. Metals (Copper, Aluminum, Tin)
13.4.4. Ferrous Components (Steel, Iron, Nickel)
13.4.5. Precious Metals (Gold, Silver, Palladium, etc.)
13.4.6. Rare Metals
13.5. E-scrap and Printed Circuit Board (PCB) E-scrap Market Size (US$ Bn) Analysis & Forecast, by Source, 2017–2031
13.5.1. Household Appliances
13.5.2. IT & Telecommunication Hardware
13.5.3. Smartphones & Tablets
13.5.4. Computers & Laptops
13.5.5. Industrial Electronics
13.5.6. Printers & Scanners
13.5.7. Entertainment Devices (TVs, Speakers, etc.)
13.5.8. Others
13.6. E-scrap and Printed Circuit Board (PCB) E-scrap Market Size (US$ Bn) Analysis & Forecast, by Process, 2017–2031
13.6.1. E-waste Collection
13.6.2. E-waste Management
13.6.3. E-waste Recycling
13.7. E-scrap and Printed Circuit Board (PCB) E-scrap Market Size (US$ Bn) and Volume (Million Units & Metric Tons) Analysis & Forecast, by Country and Sub-region, 2017–2031
13.7.1. GCC
13.7.2. South Africa
13.7.3. Rest of Middle East & Africa
13.8. Market Attractiveness Analysis
13.8.1. By Component
13.8.2. By Material
13.8.3. By Source
13.8.4. By Process
13.8.5. By Country/Sub-region
14. South America E-scrap and Printed Circuit Board (PCB) E-scrap Market Analysis and Forecast
14.1. Market Snapshot
14.2. Drivers and Restraints: Impact Analysis
14.3. E-scrap and Printed Circuit Board (PCB) E-scrap Market Size (US$ Bn) and Volume (Million Units) Analysis & Forecast, by Component, 2017–2031
14.3.1. Motherboards
14.3.2. Connectors
14.3.3. Hard Drives
14.3.4. Memory Cards
14.3.5. RAM
14.3.6. Displays
14.3.7. Cables
14.3.8. Others
14.4. E-scrap and Printed Circuit Board (PCB) E-scrap Market Size (US$ Bn) and Volume (Metric Tons) Analysis & Forecast, by Material, 2017–2031
14.4.1. Plastics
14.4.2. Glass
14.4.3. Metals (Copper, Aluminum, Tin)
14.4.4. Ferrous Components (Steel, Iron, Nickel)
14.4.5. Precious Metals (Gold, Silver, Palladium, etc.)
14.4.6. Rare Metals
14.5. E-scrap and Printed Circuit Board (PCB) E-scrap Market Size (US$ Bn) Analysis & Forecast, by Source, 2017–2031
14.5.1. Household Appliances
14.5.2. IT & Telecommunication Hardware
14.5.3. Smartphones & Tablets
14.5.4. Computers & Laptops
14.5.5. Industrial Electronics
14.5.6. Printers & Scanners
14.5.7. Entertainment Devices (TVs, Speakers, etc.)
14.5.8. Others
14.6. E-scrap and Printed Circuit Board (PCB) E-scrap Market Size (US$ Bn) Analysis & Forecast, by Process, 2017–2031
14.6.1. E-waste Collection
14.6.2. E-waste Management
14.6.3. E-waste Recycling
14.7. E-scrap and Printed Circuit Board (PCB) E-scrap Market Size (US$ Bn) and Volume (Million Units & Metric Tons) Analysis & Forecast, by Country and Sub-region, 2017–2031
14.7.1. Brazil
14.7.2. Rest of South America
14.8. Market Attractiveness Analysis
14.8.1. By Component
14.8.2. By Material
14.8.3. By Source
14.8.4. By Process
14.8.5. By Country/Sub-region
15. Competition Assessment
15.1. Global E-scrap and Printed Circuit Board (PCB) E-scrap Market Competition Matrix - a Dashboard View
15.1.1. Global E-scrap and Printed Circuit Board (PCB) E-scrap Market Company Share Analysis, by Value (2021)
15.1.2. Technological Differentiator
16. Company Profiles (Global Manufacturers/Suppliers)
16.1. Aurubis AG
16.1.1. Overview
16.1.2. Product Portfolio
16.1.3. Sales Footprint
16.1.4. Key Subsidiaries or Distributors
16.1.5. Strategy and Recent Developments
16.1.6. Key Financials
16.2. Boliden Group
16.2.1. Overview
16.2.2. Product Portfolio
16.2.3. Sales Footprint
16.2.4. Key Subsidiaries or Distributors
16.2.5. Strategy and Recent Developments
16.2.6. Key Financials
16.3. DOWA ECO-SYSTEM Co., Ltd.
16.3.1. Overview
16.3.2. Product Portfolio
16.3.3. Sales Footprint
16.3.4. Key Subsidiaries or Distributors
16.3.5. Strategy and Recent Developments
16.3.6. Key Financials
16.4. ERI
16.4.1. Overview
16.4.2. Product Portfolio
16.4.3. Sales Footprint
16.4.4. Key Subsidiaries or Distributors
16.4.5. Strategy and Recent Developments
16.4.6. Key Financials
16.5. E-scrap, Inc.
16.5.1. Overview
16.5.2. Product Portfolio
16.5.3. Sales Footprint
16.5.4. Key Subsidiaries or Distributors
16.5.5. Strategy and Recent Developments
16.5.6. Key Financials
16.6. Quantum Lifecycle Partners
16.6.1. Overview
16.6.2. Product Portfolio
16.6.3. Sales Footprint
16.6.4. Key Subsidiaries or Distributors
16.6.5. Strategy and Recent Developments
16.6.6. Key Financials
16.7. Sims Limited
16.7.1. Overview
16.7.2. Product Portfolio
16.7.3. Sales Footprint
16.7.4. Key Subsidiaries or Distributors
16.7.5. Strategy and Recent Developments
16.7.6. Key Financials
16.8. Spas Recycling Pvt. Ltd.
16.8.1. Overview
16.8.2. Product Portfolio
16.8.3. Sales Footprint
16.8.4. Key Subsidiaries or Distributors
16.8.5. Strategy and Recent Developments
16.8.6. Key Financials
16.9. Umicore
16.9.1. Overview
16.9.2. Product Portfolio
16.9.3. Sales Footprint
16.9.4. Key Subsidiaries or Distributors
16.9.5. Strategy and Recent Developments
16.9.6. Key Financials
16.10. Zolopik E-Waste Recycling Trivendent Technologies Pvt. Ltd.
16.10.1. Overview
16.10.2. Product Portfolio
16.10.3. Sales Footprint
16.10.4. Key Subsidiaries or Distributors
16.10.5. Strategy and Recent Developments
16.10.6. Key Financials
17. Recommendation
17.1. Opportunity Assessment
17.1.1. By Component
17.1.2. By Material
17.1.3. By Source
17.1.4. By Process
17.1.5. By Region
List of Tables
Table 01: Global E-scrap and Printed Circuit Board (PCB) E-scrap Market Value (US$ Bn) Forecast, by Component, 2017‒2031
Table 02: Global E-scrap and Printed Circuit Board (PCB) E-scrap Market Volume (Million Units) Forecast, by Component, 2017‒2031
Table 03: Global E-scrap and Printed Circuit Board (PCB) E-scrap Market Value (US$ Bn) Forecast, by Material, 2017‒2031
Table 04: Global E-scrap and Printed Circuit Board (PCB) E-scrap Market Volume (Metric Tons) Forecast, Material, 2017‒2031
Table 05: Global E-scrap and Printed Circuit Board (PCB) E-scrap Market Value (US$ Bn) Forecast, by Source, 2017‒2031
Table 06: Global E-scrap and Printed Circuit Board (PCB) E-scrap Market Value (US$ Bn) Forecast, by Process, 2017‒2031
Table 07: Global E-scrap and Printed Circuit Board (PCB) E-scrap Market Value (US$ Bn) Forecast, by Region, 2017‒2031
Table 08: Global E-scrap and Printed Circuit Board (PCB) E-scrap Market Volume (Million Units) Forecast, by Region, 2017‒2031
Table 09: Global E-scrap and Printed Circuit Board (PCB) E-scrap Market Volume (Metric Tons) Forecast, by Region, 2017‒2031
Table 10: North America E-scrap and Printed Circuit Board (PCB) E-scrap Market Value (US$ Bn) Forecast, by Component, 2017‒2031
Table 11: North America E-scrap and Printed Circuit Board (PCB) E-scrap Market Volume (Million Units) Forecast, by Component, 2017‒2031
Table 12: North America E-scrap and Printed Circuit Board (PCB) E-scrap Market Value (US$ Bn) Forecast, by Material, 2017‒2031
Table 13: North America E-scrap and Printed Circuit Board (PCB) E-scrap Market Volume (Metric Tons) Forecast, Material, 2017‒2031
Table 14: North America E-scrap and Printed Circuit Board (PCB) E-scrap Market Value (US$ Bn) Forecast, by Source, 2017‒2031
Table 15: North America E-scrap and Printed Circuit Board (PCB) E-scrap Market Value (US$ Bn) Forecast, by Process, 2017‒2031
Table 16: North America E-scrap and Printed Circuit Board (PCB) E-scrap Market Value (US$ Bn) Forecast, by Country & Sub-region, 2017‒2031
Table 17: North America E-scrap and Printed Circuit Board (PCB) E-scrap Market Volume (Million Units) Forecast, Country & Sub-region, 2017‒2031
Table 18: North America E-scrap and Printed Circuit Board (PCB) E-scrap Market Volume (Metric Tons) Forecast, Country & Sub-region, 2017‒2031
Table 19: Europe E-scrap and Printed Circuit Board (PCB) E-scrap Market Value (US$ Bn) Forecast, by Component, 2017‒2031
Table 20: Europe E-scrap and Printed Circuit Board (PCB) E-scrap Market Volume (Million Units) Forecast, by Component, 2017‒2031
Table 21: Europe E-scrap and Printed Circuit Board (PCB) E-scrap Market Value (US$ Bn) Forecast, by Material, 2017‒2031
Table 22: Europe E-scrap and Printed Circuit Board (PCB) E-scrap Market Volume (Metric Tons) Forecast, Material, 2017‒2031
Table 23: Europe E-scrap and Printed Circuit Board (PCB) E-scrap Market Value (US$ Bn) Forecast, by Source, 2017‒2031
Table 24: Europe E-scrap and Printed Circuit Board (PCB) E-scrap Market Value (US$ Bn) Forecast, by Process, 2017‒2031
Table 25: Europe E-scrap and Printed Circuit Board (PCB) E-scrap Market Value (US$ Bn) Forecast, by Country & Sub-region, 2017‒2031
Table 26: Europe E-scrap and Printed Circuit Board (PCB) E-scrap Market Volume (Million Units) Forecast, Country & Sub-region, 2017‒2031
Table 27: Europe E-scrap and Printed Circuit Board (PCB) E-scrap Market Volume (Metric Tons) Forecast, Country & Sub-region, 2017‒2031
Table 28: Asia Pacific E-scrap and Printed Circuit Board (PCB) E-scrap Market Value (US$ Bn) Forecast, by Component, 2017‒2031
Table 29: Asia Pacific E-scrap and Printed Circuit Board (PCB) E-scrap Market Volume (Million Units) Forecast, by Component, 2017‒2031
Table 30: Asia Pacific E-scrap and Printed Circuit Board (PCB) E-scrap Market Value (US$ Bn) Forecast, by Material, 2017‒2031
Table 31: Asia Pacific E-scrap and Printed Circuit Board (PCB) E-scrap Market Volume (Metric Tons) Forecast, Material, 2017‒2031
Table 32: Asia Pacific E-scrap and Printed Circuit Board (PCB) E-scrap Market Value (US$ Bn) Forecast, by Source, 2017‒2031
Table 33: Asia Pacific E-scrap and Printed Circuit Board (PCB) E-scrap Market Value (US$ Bn) Forecast, by Process, 2017‒2031
Table 34: Asia Pacific E-scrap and Printed Circuit Board (PCB) E-scrap Market Value (US$ Bn) Forecast, by Country & Sub-region, 2017‒2031
Table 35: Asia Pacific E-scrap and Printed Circuit Board (PCB) E-scrap Market Volume (Million Units) Forecast, Country & Sub-region, 2017‒2031
Table 36: Asia Pacific E-scrap and Printed Circuit Board (PCB) E-scrap Market Volume (Metric Tons) Forecast, Country & Sub-region, 2017‒2031
Table 37: Middle East & Africa E-scrap and Printed Circuit Board (PCB) E-scrap Market Value (US$ Bn) Forecast, by Component, 2017‒2031
Table 38: Middle East & Africa E-scrap and Printed Circuit Board (PCB) E-scrap Market Volume (Million Units) Forecast, by Component, 2017‒2031
Table 39: Middle East & Africa E-scrap and Printed Circuit Board (PCB) E-scrap Market Value (US$ Bn) Forecast, by Material, 2017‒2031
Table 40: Middle East & Africa E-scrap and Printed Circuit Board (PCB) E-scrap Market Volume (Metric Tons) Forecast, Material, 2017‒2031
Table 41: Middle East & Africa E-scrap and Printed Circuit Board (PCB) E-scrap Market Value (US$ Bn) Forecast, by Source, 2017‒2031
Table 42: Middle East & Africa E-scrap and Printed Circuit Board (PCB) E-scrap Market Value (US$ Bn) Forecast, by Process, 2017‒2031
Table 43: Middle East & Africa E-scrap and Printed Circuit Board (PCB) E-scrap Market Value (US$ Bn) Forecast, by Country & Sub-region, 2017‒2031
Table 44: Middle East & Africa E-scrap and Printed Circuit Board (PCB) E-scrap Market Volume (Million Units) Forecast, Country & Sub-region, 2017‒2031
Table 45: Middle East & Africa E-scrap and Printed Circuit Board (PCB) E-scrap Market Volume (Metric Tons) Forecast, Country & Sub-region, 2017‒2031
Table 46: South America E-scrap and Printed Circuit Board (PCB) E-scrap Market Value (US$ Bn) Forecast, by Component, 2017‒2031
Table 47: South America E-scrap and Printed Circuit Board (PCB) E-scrap Market Volume (Million Units) Forecast, by Component, 2017‒2031
Table 48: South America E-scrap and Printed Circuit Board (PCB) E-scrap Market Value (US$ Bn) Forecast, by Material, 2017‒2031
Table 49: South America E-scrap and Printed Circuit Board (PCB) E-scrap Market Volume (Metric Tons) Forecast, Material, 2017‒2031
Table 50: South America E-scrap and Printed Circuit Board (PCB) E-scrap Market Value (US$ Bn) Forecast, by Source, 2017‒2031
Table 51: South America E-scrap and Printed Circuit Board (PCB) E-scrap Market Value (US$ Bn) Forecast, by Process, 2017‒2031
Table 52: South America E-scrap and Printed Circuit Board (PCB) E-scrap Market Value (US$ Bn) Forecast, by Country & Sub-region, 2017‒2031
Table 53: South America E-scrap and Printed Circuit Board (PCB) E-scrap Market Volume (Million Units) Forecast, Country & Sub-region, 2017‒2031
Table 54: South America E-scrap and Printed Circuit Board (PCB) E-scrap Market Volume (Metric Tons) Forecast, Country & Sub-region, 2017‒2031
List of Figures
Figure 01: Global E-scrap and Printed Circuit Board (PCB) E-scrap Market Share Analysis, by Region, 2022 and 2031
Figure 02: Global E-scrap and Printed Circuit Board (PCB) E-scrap Price Trend Analysis (Average Price, US$ Thousand)
Figure 03: Global E-scrap and Printed Circuit Board (PCB) E-scrap Market Size & Forecast, Value (US$ Bn), 2017-2031
Figure 04: Global E-scrap and Printed Circuit Board (PCB) E-scrap Market Size & Forecast, Volume (Million Units), 2017-2031
Figure 05: Global E-scrap and Printed Circuit Board (PCB) E-scrap Market Size & Forecast, Volume (Metric Tons), 2017-2031
Figure 06: Global E-scrap and Printed Circuit Board (PCB) E-scrap Market, Year-on-Year Growth, Global Overview, 2018-2031
Figure 07: Global E-scrap and Printed Circuit Board (PCB) E-scrap Market Projections by Component, Value (US$ Bn), 2017-2031
Figure 08: Global E-scrap and Printed Circuit Board (PCB) E-scrap Market, Incremental Opportunity, by Component, Value (US$ Bn ), 2022-2031
Figure 09: Global E-scrap and Printed Circuit Board (PCB) E-scrap Market Share Analysis, by Component, 2022 and 2031
Figure 10: Global E-scrap and Printed Circuit Board (PCB) E-scrap Market Projections by Material, Value (US$ Bn), 2017-2031
Figure 11: Global E-scrap and Printed Circuit Board (PCB) E-scrap Market, Incremental Opportunity, by Material, Value (US$ Bn), 2022-2031
Figure 12: Global E-scrap and Printed Circuit Board (PCB) E-scrap Market Share Analysis, by Material, 2022 and 2031
Figure 13: Global E-scrap and Printed Circuit Board (PCB) E-scrap Market Projections By Source, Value (US$ Bn ), 2017-2031
Figure 14: Global E-scrap and Printed Circuit Board (PCB) E-scrap Market, Incremental Opportunity, By Source, Value (US$ Bn ), 2022-2031
Figure 15: Global E-scrap and Printed Circuit Board (PCB) E-scrap Market Share Analysis, by Source, 2022 and 2031
Figure 16: Global E-scrap and Printed Circuit Board (PCB) E-scrap Market Projections by Process, Value (US$ Bn), 2017-2031
Figure 17: Global E-scrap and Printed Circuit Board (PCB) E-scrap Market, Incremental Opportunity, by Process, Value (US$ Bn), 2022-2031
Figure 18: Global E-scrap and Printed Circuit Board (PCB) E-scrap Market Share Analysis, by Process, 2022 and 2031
Figure 19: Global E-scrap and Printed Circuit Board (PCB) E-scrap Market Projections by Region, Value (US$ Bn), 2017-2031
Figure 20: Global E-scrap and Printed Circuit Board (PCB) E-scrap Market, Incremental Opportunity, by Region, Value (US$ Bn), 2022-2031
Figure 21: Global E-scrap and Printed Circuit Board (PCB) E-scrap Market Share Analysis, by Region, 2022 and 2031
Figure 22: North America E-scrap and Printed Circuit Board (PCB) E-scrap Market Size & Forecast, Value (US$ Bn), 2017-2031
Figure 23: North America E-scrap and Printed Circuit Board (PCB) E-scrap Market Size & Forecast, Volume (Million Units), 2017-2031
Figure 24: North America E-scrap and Printed Circuit Board (PCB) E-scrap Market Size & Forecast, Volume (Metric Tons), 2017-2031
Figure 25: North America E-scrap and Printed Circuit Board (PCB) E-scrap Market, Year-on-Year Growth, North America Overview, 2018-2031
Figure 26: North America E-scrap and Printed Circuit Board (PCB) E-scrap Market Projections by Component, Value (US$ Bn), 2017-2031
Figure 27: North America E-scrap and Printed Circuit Board (PCB) E-scrap Market, Incremental Opportunity, by Component, Value (US$ Bn ), 2022-2031
Figure 28: North America E-scrap and Printed Circuit Board (PCB) E-scrap Market Share Analysis, by Component, 2022 and 2031
Figure 29: North America E-scrap and Printed Circuit Board (PCB) E-scrap Market Projections by Material, Value (US$ Bn), 2017-2031
Figure 30: North America E-scrap and Printed Circuit Board (PCB) E-scrap Market, Incremental Opportunity, by Material, Value (US$ Bn), 2022-2031
Figure 31: North America E-scrap and Printed Circuit Board (PCB) E-scrap Market Share Analysis, by Material, 2022 and 2031
Figure 32: North America E-scrap and Printed Circuit Board (PCB) E-scrap Market Projections By Source, Value (US$ Bn ), 2017-2031
Figure 33: North America E-scrap and Printed Circuit Board (PCB) E-scrap Market, Incremental Opportunity, By Source, Value (US$ Bn ), 2022-2031
Figure 34: North America E-scrap and Printed Circuit Board (PCB) E-scrap Market Share Analysis, by Source, 2022 and 2031
Figure 35: North America E-scrap and Printed Circuit Board (PCB) E-scrap Market Projections by Process, Value (US$ Bn), 2017-2031
Figure 36: North America E-scrap and Printed Circuit Board (PCB) E-scrap Market, Incremental Opportunity, by Process, Value (US$ Bn), 2022-2031
Figure 37: North America E-scrap and Printed Circuit Board (PCB) E-scrap Market Share Analysis, by Process, 2022 and 2031
Figure 38: North America E-scrap and Printed Circuit Board (PCB) E-scrap Market Projections by Country, Value (US$ Bn), 2017-2031
Figure 39: North America E-scrap and Printed Circuit Board (PCB) E-scrap Market, Incremental Opportunity, by Country, Value (US$ Bn), 2022-2031
Figure 40: North America E-scrap and Printed Circuit Board (PCB) E-scrap Market Share Analysis, by Country, 2022 and 2031
Figure 41: Europe E-scrap and Printed Circuit Board (PCB) E-scrap Market Size & Forecast, Value (US$ Bn), 2017-2031
Figure 42: Europe E-scrap and Printed Circuit Board (PCB) E-scrap Market Size & Forecast, Volume (Million Units), 2017-2031
Figure 43: Europe E-scrap and Printed Circuit Board (PCB) E-scrap Market Size & Forecast, Volume (Metric Tons), 2017-2031
Figure 44: Europe E-scrap and Printed Circuit Board (PCB) E-scrap Market, Year-on-Year Growth, Europe Overview, 2018-2031
Figure 45: Europe E-scrap and Printed Circuit Board (PCB) E-scrap Market Projections by Component, Value (US$ Bn), 2017-2031
Figure 46: Europe E-scrap and Printed Circuit Board (PCB) E-scrap Market, Incremental Opportunity, by Component, Value (US$ Bn ), 2022-2031
Figure 47: Europe E-scrap and Printed Circuit Board (PCB) E-scrap Market Share Analysis, by Component, 2022 and 2031
Figure 48: Europe E-scrap and Printed Circuit Board (PCB) E-scrap Market Projections by Material, Value (US$ Bn), 2017-2031
Figure 49: Europe E-scrap and Printed Circuit Board (PCB) E-scrap Market, Incremental Opportunity, by Material, Value (US$ Bn), 2022-2031
Figure 50: Europe E-scrap and Printed Circuit Board (PCB) E-scrap Market Share Analysis, by Material, 2022 and 2031
Figure 51: Europe E-scrap and Printed Circuit Board (PCB) E-scrap Market Projections By Source, Value (US$ Bn ), 2017-2031
Figure 52: Europe E-scrap and Printed Circuit Board (PCB) E-scrap Market, Incremental Opportunity, By Source, Value (US$ Bn ), 2022-2031
Figure 53: Europe E-scrap and Printed Circuit Board (PCB) E-scrap Market Share Analysis, by Source, 2022 and 2031
Figure 54: Europe E-scrap and Printed Circuit Board (PCB) E-scrap Market Projections by Process, Value (US$ Bn), 2017-2031
Figure 55: Europe E-scrap and Printed Circuit Board (PCB) E-scrap Market, Incremental Opportunity, by Process, Value (US$ Bn), 2022-2031
Figure 56: Europe E-scrap and Printed Circuit Board (PCB) E-scrap Market Share Analysis, by Process, 2022 and 2031
Figure 57: Europe E-scrap and Printed Circuit Board (PCB) E-scrap Market Projections by Country, Value (US$ Bn), 2017-2031
Figure 58: Europe E-scrap and Printed Circuit Board (PCB) E-scrap Market, Incremental Opportunity, by Country, Value (US$ Bn), 2022-2031
Figure 59: Europe E-scrap and Printed Circuit Board (PCB) E-scrap Market Share Analysis, by Country, 2022 and 2031
Figure 60: Asia Pacific E-scrap and Printed Circuit Board (PCB) E-scrap Market Size & Forecast, Value (US$ Bn), 2017-2031
Figure 61: Asia Pacific E-scrap and Printed Circuit Board (PCB) E-scrap Market Size & Forecast, Volume (Million Units), 2017-2031
Figure 62: Asia Pacific E-scrap and Printed Circuit Board (PCB) E-scrap Market Size & Forecast, Volume (Metric Tons), 2017-2031
Figure 63: Asia Pacific E-scrap and Printed Circuit Board (PCB) E-scrap Market, Year-on-Year Growth, Asia Pacific Overview, 2018-2031
Figure 64: Asia Pacific E-scrap and Printed Circuit Board (PCB) E-scrap Market Projections by Component, Value (US$ Bn), 2017-2031
Figure 65: Asia Pacific E-scrap and Printed Circuit Board (PCB) E-scrap Market, Incremental Opportunity, by Component, Value (US$ Bn ), 2022-2031
Figure 66: Asia Pacific E-scrap and Printed Circuit Board (PCB) E-scrap Market Share Analysis, by Component, 2022 and 2031
Figure 67: Asia Pacific E-scrap and Printed Circuit Board (PCB) E-scrap Market Projections by Material, Value (US$ Bn), 2017-2031
Figure 68: Asia Pacific E-scrap and Printed Circuit Board (PCB) E-scrap Market, Incremental Opportunity, by Material, Value (US$ Bn), 2022-2031
Figure 69: Asia Pacific E-scrap and Printed Circuit Board (PCB) E-scrap Market Share Analysis, by Material, 2022 and 2031
Figure 70: Asia Pacific E-scrap and Printed Circuit Board (PCB) E-scrap Market Projections By Source, Value (US$ Bn ), 2017-2031
Figure 71: Asia Pacific E-scrap and Printed Circuit Board (PCB) E-scrap Market, Incremental Opportunity, By Source, Value (US$ Bn ), 2022-2031
Figure 72: Asia Pacific E-scrap and Printed Circuit Board (PCB) E-scrap Market Share Analysis, by Source, 2022 and 2031
Figure 73: Asia Pacific E-scrap and Printed Circuit Board (PCB) E-scrap Market Projections by Process, Value (US$ Bn), 2017-2031
Figure 74: Asia Pacific E-scrap and Printed Circuit Board (PCB) E-scrap Market, Incremental Opportunity, by Process, Value (US$ Bn), 2022-2031
Figure 75: Asia Pacific E-scrap and Printed Circuit Board (PCB) E-scrap Market Share Analysis, by Process, 2022 and 2031
Figure 76: Asia Pacific E-scrap and Printed Circuit Board (PCB) E-scrap Market Projections by Country, Value (US$ Bn), 2017-2031
Figure 77: Asia Pacific E-scrap and Printed Circuit Board (PCB) E-scrap Market, Incremental Opportunity, by Country, Value (US$ Bn), 2022-2031
Figure 78: Asia Pacific E-scrap and Printed Circuit Board (PCB) E-scrap Market Share Analysis, by Country, 2022 and 2031
Figure 79: Middle East & Africa E-scrap and Printed Circuit Board (PCB) E-scrap Market Size & Forecast, Value (US$ Bn), 2017-2031
Figure 80: Middle East & Africa E-scrap and Printed Circuit Board (PCB) E-scrap Market Size & Forecast, Volume (Million Units), 2017-2031
Figure 81: Middle East & Africa E-scrap and Printed Circuit Board (PCB) E-scrap Market Size & Forecast, Volume (Metric Tons), 2017-2031
Figure 82: Middle East & Africa E-scrap and Printed Circuit Board (PCB) E-scrap Market, Year-on-Year Growth, Middle East & Africa Overview, 2018-2031
Figure 83: Middle East & Africa E-scrap and Printed Circuit Board (PCB) E-scrap Market Projections by Component, Value (US$ Bn), 2017-2031
Figure 84: Middle East & Africa E-scrap and Printed Circuit Board (PCB) E-scrap Market, Incremental Opportunity, by Component, Value (US$ Bn ), 2022-2031
Figure 85: Middle East & Africa E-scrap and Printed Circuit Board (PCB) E-scrap Market Share Analysis, by Component, 2022 and 2031
Figure 86: Middle East & Africa E-scrap and Printed Circuit Board (PCB) E-scrap Market Projections by Material, Value (US$ Bn), 2017-2031
Figure 87: Middle East & Africa E-scrap and Printed Circuit Board (PCB) E-scrap Market, Incremental Opportunity, by Material, Value (US$ Bn), 2022-2031
Figure 88: Middle East & Africa E-scrap and Printed Circuit Board (PCB) E-scrap Market Share Analysis, by Material, 2022 and 2031
Figure 89: Middle East & Africa E-scrap and Printed Circuit Board (PCB) E-scrap Market Projections By Source, Value (US$ Bn ), 2017-2031
Figure 90: Middle East & Africa E-scrap and Printed Circuit Board (PCB) E-scrap Market, Incremental Opportunity, By Source, Value (US$ Bn ), 2022-2031
Figure 91: Middle East & Africa E-scrap and Printed Circuit Board (PCB) E-scrap Market Share Analysis, by Source, 2022 and 2031
Figure 92: Middle East & Africa E-scrap and Printed Circuit Board (PCB) E-scrap Market Projections by Process, Value (US$ Bn), 2017-2031
Figure 93: Middle East & Africa E-scrap and Printed Circuit Board (PCB) E-scrap Market, Incremental Opportunity, by Process, Value (US$ Bn), 2022-2031
Figure 94: Middle East & Africa E-scrap and Printed Circuit Board (PCB) E-scrap Market Share Analysis, by Process, 2022 and 2031
Figure 95: Middle East & Africa E-scrap and Printed Circuit Board (PCB) E-scrap Market Projections by Country, Value (US$ Bn), 2017-2031
Figure 96: Middle East & Africa E-scrap and Printed Circuit Board (PCB) E-scrap Market, Incremental Opportunity, by Country, Value (US$ Bn), 2022-2031
Figure 97: Middle East & Africa E-scrap and Printed Circuit Board (PCB) E-scrap Market Share Analysis, by Country, 2022 and 2031
Figure 98: South America E-scrap and Printed Circuit Board (PCB) E-scrap Market Size & Forecast, Value (US$ Bn), 2017-2031
Figure 99: South America E-scrap and Printed Circuit Board (PCB) E-scrap Market Size & Forecast, Volume (Million Units), 2017-2031
Figure 100: South America E-scrap and Printed Circuit Board (PCB) E-scrap Market Size & Forecast, Volume (Metric Tons), 2017-2031
Figure 101: South America E-scrap and Printed Circuit Board (PCB) E-scrap Market, Year-on-Year Growth, South America Overview, 2018-2031
Figure 102: South America E-scrap and Printed Circuit Board (PCB) E-scrap Market Projections by Component, Value (US$ Bn), 2017-2031
Figure 103: South America E-scrap and Printed Circuit Board (PCB) E-scrap Market, Incremental Opportunity, by Component, Value (US$ Bn ), 2022-2031
Figure 104: South America E-scrap and Printed Circuit Board (PCB) E-scrap Market Share Analysis, by Component, 2022 and 2031
Figure 105: South America E-scrap and Printed Circuit Board (PCB) E-scrap Market Projections by Material, Value (US$ Bn), 2017-2031
Figure 106: South America E-scrap and Printed Circuit Board (PCB) E-scrap Market, Incremental Opportunity, by Material, Value (US$ Bn), 2022-2031
Figure 107: South America E-scrap and Printed Circuit Board (PCB) E-scrap Market Share Analysis, by Material, 2022 and 2031
Figure 108: South America E-scrap and Printed Circuit Board (PCB) E-scrap Market Projections By Source, Value (US$ Bn ), 2017-2031
Figure 109: South America E-scrap and Printed Circuit Board (PCB) E-scrap Market, Incremental Opportunity, By Source, Value (US$ Bn ), 2022-2031
Figure 110: South America E-scrap and Printed Circuit Board (PCB) E-scrap Market Share Analysis, by Source, 2022 and 2031
Figure 111: South America E-scrap and Printed Circuit Board (PCB) E-scrap Market Projections by Process, Value (US$ Bn), 2017-2031
Figure 112: South America E-scrap and Printed Circuit Board (PCB) E-scrap Market, Incremental Opportunity, by Process, Value (US$ Bn), 2022-2031
Figure 113: South America E-scrap and Printed Circuit Board (PCB) E-scrap Market Share Analysis, by Process, 2022 and 2031
Figure 114: South America E-scrap and Printed Circuit Board (PCB) E-scrap Market Projections by Country, Value (US$ Bn), 2017-2031
Figure 115: South America E-scrap and Printed Circuit Board (PCB) E-scrap Market, Incremental Opportunity, by Country, Value (US$ Bn), 2022-2031
Figure 116: South America E-scrap and Printed Circuit Board (PCB) E-scrap Market Share Analysis, by Country, 2022 and 2031
Copyright © Transparency Market Research, Inc. All Rights reserved
Trust Online

E-Scrap and Printed Circuit Board (PCB) E-Scrap Market