
Reports
Reports
Analysts’ Viewpoint on Global GDS Market Scenario
Digital transformation in various industries has led to rapid saturation of data over the past decade. Several businesses including Online Travel Agencies (OTA) have shifted to an advanced distribution management system in order to make informed strategic decisions. This is likely to increase the adoption of Global Distribution System (GDS) software in various industries, since it helps identify trends and patterns to optimize business processes. Surge in demand for improved GDS in the fragmented hotel industry is expected to create new opportunities for the global GDS market during the forecast period. Small and mid-sized hotels, and independent hotels have been historically left out of the traditional GDS channel due to technological connectivity issues. Technological developments and usage of meta-search technology to aggregate hotel content from OTAs have created opportunities for various types of distribution systems in the hotel industry.
Global Distribution System (GDS) is a computer-based network that connects reservation inventory. GDS is commonly used in the tourism industry, primarily by airlines, hotels, and car rental companies. The system allows service providers such as travel agencies and OTAs to sell tickets for the same flight, hotel, or car rental. An advanced global distribution management system is a massive database that stores and updates large amounts of data about inventory and hotel rates for travel agents and websites.
GDS acts as an intermediary for a travel agent and a hotel’s (or airline's) online reservation system. More than 600,000 travel agents use GDS to locate and book hotel reservations through e-commerce platforms. This Business-to-Business (B2B) system offers real-time data about hotel room availability and enables hotels to connect with a large number of potential guests. Economic growth, political stability, and aggressive tourism campaigns are key factors boosting the adoption of GDS, premises distribution systems, and cloud-based distribution systems in aviation and hospitality industries.
GDS assists travel agents/agencies in finding hotel rooms that meet their needs. It provides a single access point for thousands of travel agents to book rooms, allowing them to reach a large number of customers located all over the world. According to AltexSoft, GDS systems provided by Amadeus, Sabre, and Travelport are used by various hotel properties. Furthermore, increase in integration of GDS with hotels helps provide real-time access to the hotel's booking system. Companies in the hospitality industry are significantly investing in marketing programs to increase their customer base. Adoption of GDS can help decrease marketing expenditure. Thus, integration of hotels with GDS helps provide a cost-effective alternative to marketing.
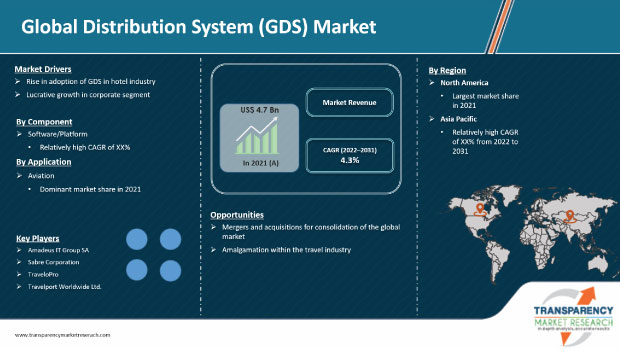
Various mergers and acquisitions have taken place in the global travel industry, which includes civil, aviation, and hospitality industries. Independent travel agents, online agents, and travel agencies are focused on adopting sophisticated GDS software to search for the best available travel and accommodations and rates for their clients. For instance, in October 2021, Sabre Corporation signed a partnership agreement with Emirates to deliver the latter’s content with personalized offers to Sabre-connected travel buyers and agencies through Sabre’s GDS. These consolidations among airlines have increased the customer base for GDS providers, leading to optimal utilization of airline seat capacity and increase in profit negotiation advantage for airline travel providers. Similarly, the hotel industry has also experienced consolidation among travel agencies, including large OTAs. Thus, various mergers in civil aviation and hospitality industries have enabled GDS providers to increase their customer base and global presence.
The GDS market in Asia Pacific is anticipated to grow at a rapid pace during the forecast period, followed by that in Europe and North America. Rise in technological developments in civil aviation and hospitality industries generates the need for GDS to drive revenue and expand the customer base. India and China are growth engines of the market in Asia Pacific. The market in Asia Pacific is projected to grow at the fastest CAGR during the forecast period.
North America held prominent share of the global GDS market in 2021. Rise in demand for cloud-based GDS solutions is expected to drive the market in North America during the forecast period. North America and Europe are expected to retain their position throughout the forecast period. Presence of major GDS providers in the U.S. and that of SMEs and travel industries in Europe is augmenting the market in these regions.
During the initial days of the COVID-19 pandemic, demand for GDS declined significantly due to government-imposed rules and regulations on the travel and tourism industry. However, post the peak of the pandemic, GDS has managed to consistently remain one of the most efficient booking distribution platforms used by travel agents for booking flights, hotel rooms, and cars. According to Euromonitor International, the hospitality industry is highly fragmented, representing less than 30% of room revenue by the top 10 players in the global hotel chain in every region, except North America and Australia. The chain of hotels that currently offer services through GDS represents a small percentage of the total hotel inventory.
Many industries such as civil, aviation, hospitality, and car rental have leveraged benefits of GDS such as high operational productivity, increase in profits, and better customer service. This is expected to augment the global GDS market in the next few years.
The global GDS market is highly fragmented, with vendors looking for ways to successfully tap into growth opportunities and strengthen their presence in the market. Companies operating in the market are partnering with regional travel agencies to expand their market presence. Vendors are also focusing on adopting M&A strategies, launching new solutions, and improving their services to enhance their global distribution system market share in 2022. The next few years are expected to offer scope for setting up GDS solutions in untapped markets. Amadeus IT Group SA, eZee Centrix, Pegasus GDS, Sabre Corporation, SiteMinder Distribution Limited, Sirena-Travel CJSC, infini Travel Information, Inc., TraveloPro, Travelport Worldwide Ltd., Trawex, TravelSky Technology Limited, FlightsLogic, and Kiu System Solutions are prominent players operating in the market.
Each of these players has been profiled in the GDS market report based on parameters such as company overview, financial overview, business strategies, product portfolio, business segments, and recent developments.
|
Attribute |
Detail |
|
Market Size Value in 2021 |
US$ 4.7 Bn |
|
Market Forecast Value in 2031 |
US$ 7 Bn |
|
Growth Rate (CAGR) |
4.3% |
|
Forecast Period |
2022–2031 |
|
Historical Data Available for |
2017–2020 |
|
Quantitative Units |
US$ Bn for Value |
|
Market Analysis |
Includes cross-segment analysis at global as well as regional level. Furthermore, qualitative analysis includes drivers, restraints, opportunities, key trends, ecosystem analysis, and COVID-19 impact analysis. |
|
Competition Landscape |
|
|
Format |
Electronic (PDF) + Excel |
|
Market Segmentation |
|
|
Regions Covered |
|
|
Countries Covered |
|
|
Companies Profiled |
|
|
Customization Scope |
Available upon request |
|
Pricing |
Available upon request |
The GDS market is anticipated to grow at a CAGR of 4.3% during the forecast period
The cloud based segment was the largest segment of the global GDS market
Rise in adoption of GDS in the hotel industry and lucrative growth in corporate segments
Amalgamation within the travel industry is projected to generate significant opportunities for growth of the global GDS market during the forecast period
Asia Pacific is a more attractive region for vendors in the GDS market
Amadeus IT Group SA, eZee Centrix, Pegasus GDS, Sabre Corporation, SiteMinder Distribution Limited, Sirena-Travel CJSC, infini Travel Information, Inc., TraveloPro, Travelport Worldwide Ltd., Trawex, TravelSky Technology Limited, FlightsLogic, and Kiu System Solutions
1. Preface
1.1. Market Introduction
1.2. Market Segmentation
1.3. Key Research Objectives
2. Assumptions and Research Methodology
2.1. Research Methodology
2.1.1. List of Primary and Secondary Sources
2.2. Key Assumptions for Data Modelling
3. Executive Summary: Global GDS Market
4. Market Overview
4.1. Market Definition
4.2. Technology/ Product Roadmap
4.3. Market Factor Analysis
4.3.1. Forecast Factors
4.3.2. Ecosystem/ Value Chain Analysis
4.3.3. Market Dynamics (Growth Influencers)
4.3.3.1. Drivers
4.3.3.2. Restraints
4.3.3.3. Opportunities
4.3.3.4. Impact Analysis of Drivers and Restraints
4.4. COVID-19 Impact Analysis
4.4.1. Impact of COVID-19 on Global GDS Market
4.4.2. Application Sentiment Analysis: Comparative Analysis on Spending
4.4.2.1. Increase in Spending
4.4.2.2. Decrease in Spending
4.4.3. Short Term and Long Term Impact on the Market
4.5. Market Opportunity Assessment – by Region (North America/ Europe/ Asia Pacific/ Middle East & Africa/ South America)
4.5.1. By Component
4.5.2. By Application
5. Global GDS Market Analysis and Forecast
5.1. Market Revenue Analysis (US$ Mn), 2016-2031
5.1.1. Historic Growth Trends, 2016-2021
5.1.2. Forecast Trends, 2022-2031
6. Global GDS Market Analysis, by Component
6.1. Overview and Definitions
6.2. Key Segment Analysis
6.3. Global GDS Market Size (US$ Mn) Forecast, by Component, 2018 - 2031
6.3.1. Software/Platform
6.3.1.1. On-premise
6.3.1.2. Cloud Based
6.3.2. Service
6.3.2.1. Managed/ Outsourced
6.3.2.2. Professional Services
6.3.2.2.1. Consulting & Training
6.3.2.2.2. Implementation
6.3.2.2.3. Support & Maintenance
7. Global GDS Market Analysis, by Application
7.1. Overview and Definitions
7.2. Key Segment Analysis
7.3. Global GDS Market Size (US$ Mn) Forecast, by Application, 2018 - 2031
7.3.1. Aviation
7.3.2. Cruise
7.3.3. Hotels and Resort
7.3.4. Car Rental
7.3.5. Others
8. Global GDS Market Analysis and Forecasts, by Region
8.1. Key Findings
8.2. Market Size (US$ Mn) Forecast by Region, 2018-2031
8.2.1. North America
8.2.2. Europe
8.2.3. Asia Pacific
8.2.4. Middle East & Africa
8.2.5. South America
9. North America Global GDS Market Analysis and Forecast
9.1. Regional Outlook
9.2. Global GDS Market Size (US$ Mn) Analysis and Forecast, 2018 - 2031
9.2.1. By Component
9.2.2. By Application
9.3. Global GDS Market Size (US$ Mn) Forecast, by Country, 2018 - 2031
9.3.1. U.S.
9.3.2. Canada
9.3.3. Mexico
10. Europe Global GDS Market Analysis and Forecast
10.1. Regional Outlook
10.2. Global GDS Market Size (US$ Mn) Analysis and Forecast, 2018 - 2031
10.2.1. By Component
10.2.2. By Application
10.3. Global GDS Market Size (US$ Mn) Forecast, by Country & Sub-region, 2018 - 2031
10.3.1. Germany
10.3.2. UK
10.3.3. France
10.3.4. Italy
10.3.5. Spain
10.3.6. Rest of Europe
11. Asia Pacific Global GDS Market Analysis and Forecast
11.1. Regional Outlook
11.2. Global GDS Market Size (US$ Mn) Analysis and Forecast, 2018 - 2031
11.2.1. By Component
11.2.2. By Application
11.3. Global GDS Market Size (US$ Mn) Forecast, by Country & Sub-region, 2018 - 2031
11.3.1. China
11.3.2. India
11.3.3. Japan
11.3.4. ASEAN
11.3.5. Rest of Asia Pacific
12. Middle East & Africa Global GDS Market Analysis and Forecast
12.1. Regional Outlook
12.2. Global GDS Market Size (US$ Mn) Analysis and Forecast, 2018 - 2031
12.2.1. By Component
12.2.2. By Application
12.3. Global GDS Market Size (US$ Mn) Forecast, by Country & Sub-region, 2018 - 2031
12.3.1. Saudi Arabia
12.3.2. The United Arab Emirates
12.3.3. South Africa
12.3.4. Rest of Middle East & Africa
13. South America Global GDS Market Analysis and Forecast
13.1. Regional Outlook
13.2. Global GDS Market Size (US$ Mn) Analysis and Forecast, 2018 - 2031
13.2.1. By Component
13.2.2. By Application
13.3. Global GDS Market Size (US$ Mn) Forecast, by Country & Sub-region, 2018 - 2031
13.3.1. Brazil
13.3.2. Argentina
13.3.3. Rest of South America
14. Competition Landscape
14.1. Market Competition Matrix, by Leading Players
14.2. Market Revenue Share Analysis (%), by Leading Players (2021)
14.3. Competitive Scenario
14.3.1. List of Emerging, Prominent and Leading Players
14.3.2. Major Mergers & Acquisitions, Expansions, Partnership, Contacts, Deals, etc.
15. Company Profiles
15.1. Amadeus IT Group SA
15.1.1. Business Overview
15.1.2. Company Revenue
15.1.3. Product Portfolio
15.1.4. Geographic Footprint
15.1.5. Strategic Partnership, Merger & Acquisition, Business Expansion, New Product Launch, Innovation etc.
15.2. eZee Centrix
15.2.1. Business Overview
15.2.2. Company Revenue
15.2.3. Product Portfolio
15.2.4. Geographic Footprint
15.2.5. Strategic Partnership, Merger & Acquisition, Business Expansion, New Product Launch, Innovation etc.
15.3. Pegasus GDS
15.3.1. Business Overview
15.3.2. Company Revenue
15.3.3. Product Portfolio
15.3.4. Geographic Footprint
15.3.5. Strategic Partnership, Merger & Acquisition, Business Expansion, New Product Launch, Innovation etc.
15.4. Sabre Corporation
15.4.1. Business Overview
15.4.2. Company Revenue
15.4.3. Product Portfolio
15.4.4. Geographic Footprint
15.4.5. Strategic Partnership, Merger & Acquisition, Business Expansion, New Product Launch, Innovation etc.
15.5. SiteMinder Distribution Limited
15.5.1. Business Overview
15.5.2. Company Revenue
15.5.3. Product Portfolio
15.5.4. Geographic Footprint
15.5.5. Strategic Partnership, Merger & Acquisition, Business Expansion, New Product Launch, Innovation etc.
15.6. Sirena-Travel CJSC
15.6.1. Business Overview
15.6.2. Company Revenue
15.6.3. Product Portfolio
15.6.4. Geographic Footprint
15.6.5. Strategic Partnership, Merger & Acquisition, Business Expansion, New Product Launch, Innovation etc.
15.7. infini Travel Information, Inc.
15.7.1. Business Overview
15.7.2. Company Revenue
15.7.3. Product Portfolio
15.7.4. Geographic Footprint
15.7.5. Strategic Partnership, Merger & Acquisition, Business Expansion, New Product Launch, Innovation etc.
15.8. TraveloPro
15.8.1. Business Overview
15.8.2. Company Revenue
15.8.3. Product Portfolio
15.8.4. Geographic Footprint
15.8.5. Strategic Partnership, Merger & Acquisition, Business Expansion, New Product Launch, Innovation etc.
15.9. Travelport Worldwide Ltd.
15.9.1. Business Overview
15.9.2. Company Revenue
15.9.3. Product Portfolio
15.9.4. Geographic Footprint
15.9.5. Strategic Partnership, Merger & Acquisition, Business Expansion, New Product Launch, Innovation etc.
15.10. Trawex
15.10.1. Business Overview
15.10.2. Company Revenue
15.10.3. Product Portfolio
15.10.4. Geographic Footprint
15.10.5. Strategic Partnership, Merger & Acquisition, Business Expansion, New Product Launch, Innovation etc.
15.11. TravelSky Technology Limited
15.11.1. Business Overview
15.11.2. Company Revenue
15.11.3. Product Portfolio
15.11.4. Geographic Footprint
15.11.5. Strategic Partnership, Merger & Acquisition, Business Expansion, New Product Launch, Innovation etc.
15.12. FlightsLogic
15.12.1. Business Overview
15.12.2. Company Revenue
15.12.3. Product Portfolio
15.12.4. Geographic Footprint
15.12.5. Strategic Partnership, Merger & Acquisition, Business Expansion, New Product Launch, Innovation etc.
15.13. Kiu System Solutions
15.13.1. Business Overview
15.13.2. Company Revenue
15.13.3. Product Portfolio
15.13.4. Geographic Footprint
15.13.5. Strategic Partnership, Merger & Acquisition, Business Expansion, New Product Launch, Innovation etc.
15.14. Others
16. Key Takeaways
List of Tables
Table 1: Acronyms Used in Global GDS Market
Table 2: North America Global GDS Market Revenue Analysis, by Country, 2022 - 2031 (US$ Mn)
Table 3: Europe Global GDS Market Revenue Analysis, by Country, 2022 - 2031 (US$ Mn)
Table 4: Asia Pacific Global GDS Market Revenue Analysis, by Country, 2022 - 2031 (US$ Mn)
Table 5: Middle East & Africa Global GDS Market Revenue Analysis, by Country, 2021 and 2031 (US$ Mn)
Table 6: South America Global GDS Market Revenue Analysis, by Country, 2022 - 2031 (US$ Mn)
Table 7: Forecast Factors: Relevance and Impact (1/2)
Table 8: Forecast Factors: Relevance and Impact (2/2)
Table 9: Impact Analysis of Drivers & Restraints
Table 10: Global GDS Market Value (US$ Mn) Forecast, by Component, 2018 – 2031
Table 11: Global GDS Market Value (US$ Mn) Forecast, by Application, 2018 – 2031
Table 12: Global GDS Market Volume (US$ Mn) Forecast, by Region, 2018 - 2031
Table 13: North America Global GDS Market Value (US$ Mn) Forecast, by Component, 2018 – 2031
Table 14: North America Global GDS Market Value (US$ Mn) Forecast, by Application, 2018 – 2031
Table 15: North America Global GDS Market Value (US$ Mn) Forecast, by Country, 2018 - 2031
Table 16: U.S. Global GDS Market Revenue CAGR Breakdown (%), by Growth Term
Table 17: Canada Global GDS Market Revenue CAGR Breakdown (%), by Growth Term
Table 18: Mexico Global GDS Market Revenue CAGR Breakdown (%), by Growth Term
Table 19: Europe Global GDS Market Value (US$ Mn) Forecast, by Component, 2018 – 2031
Table 20: Europe Global GDS Market Value (US$ Mn) Forecast, by Application, 2018 – 2031
Table 21: Europe Global GDS Market Value (US$ Mn) Forecast, by Country, 2018 - 2031
Table 22: Germany Global GDS Market Revenue CAGR Breakdown (%), by Growth Term
Table 23: UK Global GDS Market Revenue CAGR Breakdown (%), by Growth Term
Table 24: France Global GDS Market Revenue CAGR Breakdown (%), by Growth Term
Table 25: Spain Global GDS Market Revenue CAGR Breakdown (%), by Growth Term
Table 26: Italy Global GDS Market Revenue CAGR Breakdown (%), by Growth Term
Table 27: Asia Pacific Global GDS Market Value (US$ Mn) Forecast, by Component, 2018 – 2031
Table 28: Asia Pacific Global GDS Market Value (US$ Mn) Forecast, by Application, 2018 – 2031
Table 29: Asia Pacific Global GDS Market Value (US$ Mn) Forecast, by Country, 2018 - 2031
Table 30: China Global GDS Market Revenue CAGR Breakdown (%), by Growth Term
Table 31: India Global GDS Market Revenue CAGR Breakdown (%), by Growth Term
Table 32: Japan Global GDS Market Revenue CAGR Breakdown (%), by Growth Term
Table 33: ASEAN Global GDS Market Revenue CAGR Breakdown (%), by Growth Term
Table 34: Middle East & Africa Global GDS Market Value (US$ Mn) Forecast, by Component, 2018 – 2031
Table 35: Middle East & Africa Global GDS Market Value (US$ Mn) Forecast, by Application, 2018 – 2031
Table 36: Middle East & Africa Global GDS Market Value (US$ Mn) Forecast, by Country, 2018 - 2031
Table 37: Saudi Arabia Global GDS Market Revenue CAGR Breakdown (%), by Growth Term
Table 38: The United Arab Emirates Global GDS Market Revenue CAGR Breakdown (%), by Growth Term
Table 39: South Africa Global GDS Market Revenue CAGR Breakdown (%), by Growth Term
Table 40: South America Global GDS Market Value (US$ Mn) Forecast, by Component, 2018 – 2031
Table 41: South America Global GDS Market Value (US$ Mn) Forecast, by Application, 2018 – 2031
Table 42: South America Global GDS Market Value (US$ Mn) Forecast, by Country, 2018 – 2031
Table 43: Brazil Global GDS Market Revenue CAGR Breakdown (%), by Growth Term
Table 44: Argentina Global GDS Market Revenue CAGR Breakdown (%), by Growth Term
Table 45: Mergers & Acquisitions, Expansions (1/2)
Table 46: Mergers & Acquisitions, Expansions (2/2)
List of Figures
Figure 1: Global GDS Market Size (US$ Mn) Forecast, 2018–2031
Figure 2: Global GDS Market Revenue (US$ Mn) Opportunity Assessment, by Region, 2022E
Figure 3: Top Segment Analysis of Global GDS Market
Figure 4: Global GDS Market Revenue (US$ Mn) Opportunity Assessment, by Region, 2031F
Figure 5: Global GDS Market Attractiveness Assessment, by Component
Figure 6: Global GDS Market Attractiveness Assessment, by Application
Figure 7: Global GDS Market Attractiveness Assessment, by Region
Figure 8: Global GDS Market Revenue (US$ Mn) Historic Trends, 2016 - 2021
Figure 9: Global GDS Market Revenue Opportunity (US$ Mn) Historic Trends, 2016 - 2021
Figure 10: Global GDS Market Value Share Analysis, by Component, 2022
Figure 11: Global GDS Market Value Share Analysis, by Component, 2031
Figure 12: Global GDS Market Absolute Opportunity (US$ Mn), by Software/Platform, 2022 – 2031
Figure 13: Global GDS Market Absolute Opportunity (US$ Mn), by Service, 2022 – 2031
Figure 14: Global GDS Market Value Share Analysis, by Application, 2022
Figure 15: Global GDS Market Value Share Analysis, by Application, 2031
Figure 16: Global GDS Market Absolute Opportunity (US$ Mn), by Aviation, 2022 – 2031
Figure 17: Global GDS Market Absolute Opportunity (US$ Mn), by Cruise, 2022 – 2031
Figure 18: Global GDS Market Absolute Opportunity (US$ Mn), by Hotel and Resort, 2022 – 2031
Figure 19: Global GDS Market Absolute Opportunity (US$ Mn), by Car Rental, 2022 – 2031
Figure 20: Global GDS Market Absolute Opportunity (US$ Mn), by Others, 2022 – 2031
Figure 21: Global GDS Market Opportunity (US$ Mn), by Region
Figure 22: Global GDS Market Opportunity Share (%), by Region, 2022–2031
Figure 23: Global GDS Market Size (US$ Mn), by Region, 2022 & 2031
Figure 24: Global GDS Market Value Share Analysis, by Region, 2022
Figure 25: Global GDS Market Value Share Analysis, by Region, 2031
Figure 26: North America Global GDS Market Absolute Opportunity (US$ Mn), 2022 – 2031
Figure 27: Europe Global GDS Market Absolute Opportunity (US$ Mn), 2022 – 2031
Figure 28: Asia Pacific Global GDS Market Absolute Opportunity (US$ Mn), 2022 – 2031
Figure 29: Middle East & Africa Global GDS Market Absolute Opportunity (US$ Mn), 2022 – 2031
Figure 30: South America Global GDS Market Absolute Opportunity (US$ Mn), 2022 – 2031
Figure 31: North America Global GDS Market Revenue Opportunity Share, by Component
Figure 32: North America Global GDS Market Revenue Opportunity Share, by Region
Figure 33: North America Global GDS Market Revenue Opportunity Share, by Application
Figure 34: North America Global GDS Market Value Share Analysis, by Component, 2022
Figure 35: North America Global GDS Market Value Share Analysis, by Component, 2031
Figure 36: North America Global GDS Market Absolute Opportunity (US$ Mn), by Software/Platform, 2022 – 2031
Figure 37: North America Global GDS Market Absolute Opportunity (US$ Mn), by Service, 2022 – 2031
Figure 38: North America Global GDS Market Value Share Analysis, by Application, 2022
Figure 39: North America Global GDS Market Value Share Analysis, by Application, 2031
Figure 40: North America Global GDS Market Absolute Opportunity (US$ Mn), by Aviation, 2022 – 2031
Figure 41: North America Global GDS Market Absolute Opportunity (US$ Mn), by Cruise, 2022 – 2031
Figure 42: North America Global GDS Market Absolute Opportunity (US$ Mn), by Hotel and Resort, 2022 – 2031
Figure 43: North America Global GDS Market Absolute Opportunity (US$ Mn), by Car Rental, 2022 – 2031
Figure 44: North America Global GDS Market Absolute Opportunity (US$ Mn), by Others, 2022 – 2031
Figure 45: North America Global GDS Market Value Share Analysis, by Country, 2022
Figure 46: North America Global GDS Market Value Share Analysis, by Country, 2031
Figure 47: U.S. Global GDS Market Opportunity Growth Analysis (US$ Mn) Forecast, 2022 – 2031
Figure 48: Canada Global GDS Market Opportunity Growth Analysis (US$ Mn) Forecast, 2022 – 2031
Figure 49: Mexico Global GDS Market Opportunity Growth Analysis (US$ Mn) Forecast, 2022 – 2031
Figure 50: Europe Global GDS Market Revenue Opportunity Share, by Component
Figure 51: Europe Global GDS Market Revenue Opportunity Share, by Region
Figure 52: Europe Global GDS Market Revenue Opportunity Share, by Application
Figure 53: Europe Global GDS Market Value Share Analysis, by Component, 2022
Figure 54: Europe Global GDS Market Value Share Analysis, by Component, 2031
Figure 55: Europe Global GDS Market Absolute Opportunity (US$ Mn), by Software/Platform, 2022 – 2031
Figure 56: Europe Global GDS Market Absolute Opportunity (US$ Mn), by Service, 2022 – 2031
Figure 57: Europe Global GDS Market Value Share Analysis, by Application, 2022
Figure 58: Europe Global GDS Market Value Share Analysis, by Application, 2031
Figure 59: Europe Global GDS Market Absolute Opportunity (US$ Mn), by Aviation, 2022 – 2031
Figure 60: Europe Global GDS Market Absolute Opportunity (US$ Mn), by Cruise, 2022 – 2031
Figure 61: Europe Global GDS Market Absolute Opportunity (US$ Mn), by Hotel and Resort, 2022 – 2031
Figure 62: Europe Global GDS Market Absolute Opportunity (US$ Mn), by Car Rental, 2022 – 2031
Figure 63: Europe Global GDS Market Absolute Opportunity (US$ Mn), by Others, 2022 – 2031
Figure 64: Europe Global GDS Market Value Share Analysis, by Country, 2022
Figure 65: Europe Global GDS Market Value Share Analysis, by Country, 2031
Figure 66: Germany Global GDS Market Opportunity Growth Analysis (US$ Mn) Forecast, 2022 – 2031
Figure 67: U.K. Global GDS Market Opportunity Growth Analysis (US$ Mn) Forecast, 2022 – 2031
Figure 68: France Global GDS Market Opportunity Growth Analysis (US$ Mn) Forecast, 2022 – 2031
Figure 69: Spain Global GDS Market Opportunity Growth Analysis (US$ Mn) Forecast, 2022 – 2031
Figure 70: Italy Global GDS Market Opportunity Growth Analysis (US$ Mn) Forecast, 2022 – 2031
Figure 71: Asia Pacific Global GDS Market Revenue Opportunity Share, by Component
Figure 72: Asia Pacific Global GDS Market Revenue Opportunity Share, by Region
Figure 73: Asia Pacific Global GDS Market Revenue Opportunity Share, by Application
Figure 74: Asia Pacific Global GDS Market Value Share Analysis, by Component, 2022
Figure 75: Asia Pacific Global GDS Market Value Share Analysis, by Component, 2031
Figure 76: Asia Pacific Global GDS Market Absolute Opportunity (US$ Mn), by Software/Platform, 2022 – 2031
Figure 77: Asia Pacific Global GDS Market Absolute Opportunity (US$ Mn), by Service, 2022 – 2031
Figure 78: Asia Pacific Global GDS Market Value Share Analysis, by Application, 2022
Figure 79: Asia Pacific Global GDS Market Value Share Analysis, by Application, 2031
Figure 80: Asia Pacific Global GDS Market Absolute Opportunity (US$ Mn), by Aviation, 2022 – 2031
Figure 81: Asia Pacific Global GDS Market Absolute Opportunity (US$ Mn), by Cruise, 2022 – 2031
Figure 82: Asia Pacific Global GDS Market Absolute Opportunity (US$ Mn), by Hotel and Resort, 2022 – 2031
Figure 83: Asia Pacific Global GDS Market Absolute Opportunity (US$ Mn), by Car Rental, 2022 – 2031
Figure 84: Asia Pacific Global GDS Market Absolute Opportunity (US$ Mn), by Others, 2022 – 2031
Figure 85: Asia Pacific Global GDS Market Value Share Analysis, by Country, 2022
Figure 86: Asia Pacific Global GDS Market Value Share Analysis, by Country, 2031
Figure 87: China Global GDS Market Opportunity Growth Analysis (US$ Mn) Forecast, 2022 – 2031
Figure 88: India Global GDS Market Opportunity Growth Analysis (US$ Mn) Forecast, 2022 – 2031
Figure 89: Japan Global GDS Market Opportunity Growth Analysis (US$ Mn) Forecast, 2022 – 2031
Figure 90: ASEAN Global GDS Market Opportunity Growth Analysis (US$ Mn) Forecast, 2022 – 2031
Figure 91: Middle East & Africa Global GDS Market Revenue Opportunity Share, by Component
Figure 92: Middle East & Africa Global GDS Market Revenue Opportunity Share, by Region
Figure 93: Middle East & Africa Global GDS Market Revenue Opportunity Share, by Application
Figure 94: Middle East & Africa Global GDS Market Value Share Analysis, by Component, 2022
Figure 95: Middle East & Africa Global GDS Market Value Share Analysis, by Component, 2031
Figure 96: Middle East & Africa Global GDS Market Absolute Opportunity (US$ Mn), by Software/Platform, 2022 – 2031
Figure 97: Middle East & Africa Global GDS Market Absolute Opportunity (US$ Mn), by Service, 2022 – 2031
Figure 98: Middle East & Africa Global GDS Market Value Share Analysis, by Application, 2022
Figure 99: Middle East & Africa Global GDS Market Value Share Analysis, by Application, 2031
Figure 100: Middle East & Africa Global GDS Market Absolute Opportunity (US$ Mn), by Aviation, 2022 – 2031
Figure 101: Middle East & Africa Global GDS Market Absolute Opportunity (US$ Mn), by Cruise, 2022 – 2031
Figure 102: Middle East & Africa Global GDS Market Absolute Opportunity (US$ Mn), by Hotel and Resort, 2022 – 2031
Figure 103: Middle East & Africa Global GDS Market Absolute Opportunity (US$ Mn), by Car Rental, 2022 – 2031
Figure 104: Middle East & Africa Global GDS Market Absolute Opportunity (US$ Mn), by Others, 2022 – 2031
Figure 105: Middle East & Africa Global GDS Market Value Share Analysis, by Country, 2022
Figure 106: Middle East & Africa Global GDS Market Value Share Analysis, by Country, 2031
Figure 107: Saudi Arabia Global GDS Market Opportunity Growth Analysis (US$ Mn) Forecast, 2022 – 2031
Figure 108: United Arab Emirates Global GDS Market Opportunity Growth Analysis (US$ Mn) Forecast, 2022 – 2031
Figure 109: South Africa Global GDS Market Opportunity Growth Analysis (US$ Mn) Forecast, 2022 – 2031
Figure 110: South America Global GDS Market Revenue Opportunity Share, by Component
Figure 111: South America Global GDS Market Revenue Opportunity Share, by Application
Figure 112: South America Global GDS Market Revenue Opportunity Share, by Region
Figure 113: South America Global GDS Market Value Share Analysis, by Component, 2022
Figure 114: South America Global GDS Market Value Share Analysis, by Component, 2031
Figure 115: South America Global GDS Market Absolute Opportunity (US$ Mn), by Software/Platform, 2022 – 2031
Figure 116: South America Global GDS Market Absolute Opportunity (US$ Mn), by Service, 2022 – 2031
Figure 117: South America Global GDS Market Value Share Analysis, by Application, 2022
Figure 118: Figure 124: South America Global GDS Market Value Share Analysis, by Application, 2031
Figure 119: South America Global GDS Market Absolute Opportunity (US$ Mn), by Aviation, 2022 – 2031
Figure 120: South America Global GDS Market Absolute Opportunity (US$ Mn), by Cruise, 2022 – 2031
Figure 121: South America Global GDS Market Absolute Opportunity (US$ Mn), by Hotel and Resort, 2022 – 2031
Figure 122: South America Global GDS Market Absolute Opportunity (US$ Mn), by Car Rental, 2022 – 2031
Figure 123: South America Global GDS Market Absolute Opportunity (US$ Mn), by Others, 2022 – 2031
Figure 124: South America Global GDS Market Value Share Analysis, by Country, 2022
Figure 125: South America Global GDS Market Value Share Analysis, by Country, 2031
Figure 126: South America Global GDS Market Value Share Analysis, by Country, 2022
Figure 127: South America Global GDS Market Value Share Analysis, by Country, 2031
Figure 128: Brazil Global GDS Market Opportunity Growth Analysis (US$ Mn) Forecast, 2022 – 2031
Figure 129: Argentina Global GDS Market Opportunity Growth Analysis (US$ Mn) Forecast, 2022 – 2031
Figure 130: Asia Pacific Global GDS Market Value Share Analysis, by Application, 2031
Figure 131: Asia Pacific Global GDS Market Absolute Opportunity (US$ Mn), by IT & Telecom, 2022 – 2031
Copyright © Transparency Market Research, Inc. All Rights reserved
Trust Online

Global Distribution System Market