
Reports
Reports
Analysts’ Viewpoint on Digital Experience Monitoring (DEM) Market Scenario
Demand for digital experience monitoring (DEM) technology is rising, as organizations are facing challenges in delivering superior customer experience in remote working world during the COVID-19 pandemic. Companies are increasingly using DEM to identify technology performance issues and align application performance. Real user monitoring and synthetic transaction monitoring have helped organizations improve digital business results and optimize customer experience. End-user satisfaction with application performance and reliability is key to effective digital business operations. The digital experience monitoring (DEM) market is growing at a rapid pace due to the rise in need to manage application performance and ensure optimal digital experience for customers and employees.
Digital experience monitoring (DEM) comprises a set of tools that measure digital experience and keep the software operating at peak performance. DEM software analyzes the efficiency and performance of applications and services. It is used to track, discover, and optimize web-based resources and end-user experience.
DEM is the evolution of end-user experience monitoring and application performance monitoring tool into a holistic solution that analyzes the efficacy of an enterprise's applications and services. Digital experience monitoring tools are used to monitor user behavior, traffic, and various factors that help organizations understand their product's performance and usability. These tools also examine and improve application and site performance. Increasing number of organizations are focusing on using digital experience monitoring tools to monitor product operations in an effective manner. Advancements in IT infrastructure, Internet of Things (IoT), and cloud computing technologies have encouraged several organizations to focus on providing a good end-user experience for their web and mobile applications. This is likely to propel the DEM market during the forecast period.
Digital experience monitoring (DEM) is a performance analysis discipline that supports the optimization of operational experience, digital agent, machine, or human with the application and service portfolio of enterprises.
DEM combines tools, such as application performance management (APM), end-user experience management (EUEM), and network performance monitoring and diagnostics (NPMD), to holistically look at the digital journey in order to drive successful experiences for customers and employees. For IT leaders, the DEM solution can help:
DEM also provides insight into an end-user's experience when interacting with digital services such as applications and websites. According to Gartner, at least 60% of digital businesses are likely to use DEM to measure endpoint performance, application, and services on users’ digital experiences by 2026, up from less than 20% in 2021. DEM software is gaining prominence in the business world for outcomes such as customer satisfaction, revenue margin, and employee productivity. This is likely to drive the digital experience monitoring (DEM) market during the forecast period.
Digital experience monitoring (DEM) is a real-time monitoring tool that helps a company run the software/application smoothly by discovering vulnerabilities that cause downtime. The tool is used to enhance user experience by monitoring page load times and determining the underlying cause of performance deterioration.
Several SME organizations face challenges such as scalability issues, lack of capital, and dearth of skills. Ensuring optimal performance is critical to business success. Therefore, SMEs are focusing on prioritizing network monitoring, and proactively optimizing the digital experience of end-user applications.
Adoption of digital experience monitoring platforms in SMEs is gaining momentum, as organizations are realizing the benefits of providing a good user experience in order to gain customers. In May 2022, Exoprise Systems Inc., a U.S.-based software company, launched Network Digital Experience Monitoring Solution, to identify problems and predict performance degradation with enterprise collaboration apps such as Google Meet, Zoom, WebEx, and Microsoft Teams.
DEM creates a comprehensive analysis of customer & employee experience and operational efficiency of the business. Thus, increase in need to improve user experience is driving the adoption of DEM software in SMEs.
North America is expected to account for prominent share of the global digital experience monitoring (DEM) market by the end of 2022. Availability of multiple DEM solution providers and early adoption of digital experience monitoring (DEM) solutions are factors driving the market in the region. Consistent rise in demand for DEM solutions in various sectors, such as IT & telecom, BFSI, retail, and healthcare, is augmenting the digital experience monitoring (DEM) market in the region.
Vendors are focusing on the launch of advanced DEM solutions to cater to the requirement of end-users owing to the high demand for DEM software. For instance, in May 2021, Martello Technologies Group Inc., a provider of enterprise digital experience monitoring (DEM) solutions, launched the cloud-based multi-tenant Microsoft 365 monitoring platform. The platform enables MSPs (managed service providers) to manage multiple small and medium-sized enterprise (SME) clients from a single Martello Microsoft 365 monitoring instance. This multi-tenant architecture is a key deliverable in the company’s expansion plan.
The digital experience monitoring (DEM) market in Asia Pacific is expected to grow at a notable CAGR during the forecast period due to the rise in adoption of mobile & cloud technologies in various small- and medium-sized companies in the region. Rise in technological developments and expansion of the IT industry are further driving the digital experience monitoring (DEM) market in the region. Development of infrastructure in countries such as China, India, Japan, and Singapore has been opening up new business avenues for vendors. Rise in need to monitor end-user and customer experience across multiple channels is also expected to fuel the digital experience monitoring (DEM) market in the region.
Several digital experience monitoring vendors in the market are focusing on the launch of the new generation of digital experience platforms to extend the value and visibility of their services. Established DEM vendors, such as Aternity, Fortinet, and Zscaler, have launched Digital Experience Index (DXI), FortiMonitor, and Zscaler Digital Experience (ZDX), respectively, to expand the DEM monitoring capability, value, and visibility of their services in order to gain a competitive edge in the market. Cisco acquired ThousandEyes to consolidate its position in the DEM market.
Dynatrace LLC, Cisco, New Relic Inc., Splunk Inc., Catchpoint Systems Inc., Zscaler Inc., Datadog, Aternity LLC, Nexthink SA, Lakeside Software LLC, Broadcom Inc., Apica, SolarWinds Worldwide LLC, Riverbed Technology Inc., and Palo Alto Networks, Inc are some of the companies operating in the digital experience monitoring market.
Each of these players has been profiled in the digital experience monitoring (DEM) market report based on parameters such as company overview, financial overview, business strategies, product portfolio, business segments, and recent developments
|
Attribute |
Detail |
|
Market Size Value in 2021 |
US$ 1.24 Bn |
|
Market Forecast Value in 2031 |
US$ 6.53 Bn |
|
Growth Rate (CAGR) |
18.3% |
|
Forecast Period |
2022–2031 |
|
Historical Data Available for |
2016–2020 |
|
Quantitative Units |
US$ Bn for Value |
|
Market Analysis |
Includes segment analysis at global as well as regional level. Furthermore, qualitative analysis includes drivers, restraints, opportunities, key trends, ecosystem/value chain analysis, and key trend analysis. |
|
Competition Landscape |
|
|
Format |
Electronic (PDF) + Excel |
|
Market Segmentation |
|
|
Regions Covered |
|
|
Countries Covered |
|
|
Companies Profiled |
|
|
Customization Scope |
Available upon request |
|
Pricing |
Available upon request |
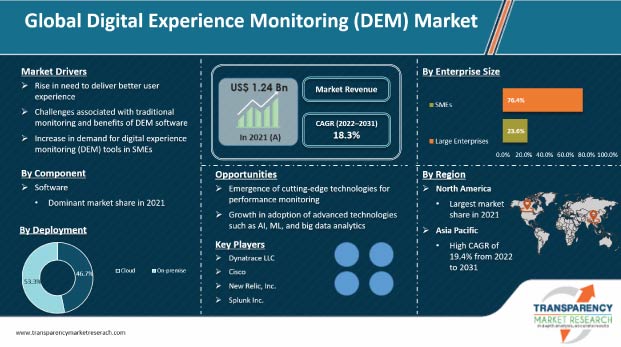
The digital experience monitoring (DEM) market stood at US$ 1.24 Bn in 2021.
The digital experience monitoring (DEM) market is estimated to grow at a CAGR of 18.3% during the forecast period.
Rise in need to deliver better user experience, challenges associated with traditional monitoring and benefits of DEM software, and increase in demand for digital experience monitoring (DEM) tools in SMEs are major factors driving the market.
Large enterprises segment accounted for the largest share of the digital experience monitoring (DEM) market in 2021.
Asia Pacific is a more attractive region for vendors in the digital experience monitoring (DEM) market.
Dynatrace LLC, Cisco, New Relic Inc., Splunk Inc., Catchpoint Systems Inc., Zscaler Inc., Datadog, Aternity LLC, Nexthink SA, Lakeside Software LLC, Broadcom Inc., Apica, SolarWinds Worldwide LLC, Riverbed Technology Inc., and Palo Alto Networks, Inc.
1. Preface
1.1. Market Introduction
1.2. Market Segmentation
1.3. Key Research Objectives
2. Assumptions and Research Methodology
2.1. Research Methodology
2.1.1. List of Primary and Secondary Sources
2.2. Key Assumptions for Data Modelling
3. Executive Summary: Global Digital Experience Monitoring (DEM) Market
4. Market Overview
4.1. Market Definition
4.2. Technology/ Product Roadmap
4.3. Market Factor Analysis
4.3.1. Forecast Factors
4.3.2. Ecosystem/ Value Chain Analysis
4.3.3. Market Dynamics (Growth Influencers)
4.3.3.1. Drivers
4.3.3.2. Restraints
4.3.3.3. Opportunities
4.3.3.4. Impact Analysis of Drivers and Restraints
4.4. COVID-19 Impact Analysis
4.4.1. Impact of COVID-19 on Digital Experience Monitoring (DEM) Market
4.4.2. End-user Sentiment Analysis: Comparative Analysis on Spending
4.4.2.1. Increase in Spending
4.4.2.2. Decrease in Spending
4.4.3. Short Term and Long Term Impact on the Market
4.5. Market Opportunity Assessment – by Region (North America/ Europe/ Asia Pacific/ Middle East and Africa/ South America)
4.5.1. By Component
4.5.2. By Deployment
4.5.3. By Enterprise Size
4.5.4. By End-user
5. Global Digital Experience Monitoring (DEM) Market Analysis and Forecast
5.1. Market Revenue Analysis (US$ Bn), 2016-2031
5.1.1. Historic Growth Trends, 2016-2021
5.1.2. Forecast Trends, 2022-2031
5.2. Pricing Model Analysis/ Price Trend Analysis
6. Global Digital Experience Monitoring (DEM) Market Analysis, by Component
6.1. Overview and Definitions
6.2. Key Segment Analysis
6.3. Digital Experience Monitoring (DEM) Market Size (US$ Bn) Forecast, by Component, 2018‒2031
6.3.1. Software
6.3.2. Services
6.3.2.1. Professional Services
6.3.2.2. Managed Services
7. Global Digital Experience Monitoring (DEM) Market Analysis, by Deployment
7.1. Overview and Definitions
7.2. Key Segment Analysis
7.3. Digital Experience Monitoring (DEM) Market Size (US$ Bn) Forecast, by Deployment, 2018‒2031
7.3.1. Cloud
7.3.2. On-premise
8. Global Digital Experience Monitoring (DEM) Market Analysis, by Enterprise Size
8.1. Overview and Definitions
8.2. Key Segment Analysis
8.3. Digital Experience Monitoring (DEM) Market Size (US$ Bn) Forecast, by Enterprise Size, 2018‒2031
8.3.1. Small and Medium Enterprises (SMEs)
8.3.2. Large Enterprises
9. Global Digital Experience Monitoring (DEM) Market Analysis, by End-user
9.1. Key Segment Analysis
9.2. Digital Experience Monitoring (DEM) Market Size (US$ Bn) Forecast, by End-user, 2018‒2031
9.2.1. BFSI
9.2.2. IT & Telecom
9.2.3. Retail & E-commerce
9.2.4. Healthcare
9.2.5. Government
9.2.6. Media & Entertainment
9.2.7. Travel & Hospitality
9.2.8. Others (Manufacturing, Education, etc.)
10. Global Digital Experience Monitoring (DEM) Market Analysis and Forecasts, by Region
10.1. Key Findings
10.2. Market Size (US$ Bn) Forecast by Region, 2018-2031
10.2.1. North America
10.2.2. Europe
10.2.3. Asia Pacific
10.2.4. Middle East & Africa
10.2.5. South America
11. North America Digital Experience Monitoring (DEM) Market Analysis and Forecast
11.1. Regional Outlook
11.2. Digital Experience Monitoring (DEM) Market Size (US$ Bn) Analysis and Forecast, 2018‒2031
11.2.1. By Component
11.2.2. By Deployment
11.2.3. By Enterprise Size
11.2.4. By End-user
11.3. Digital Experience Monitoring (DEM) Market Size (US$ Bn) Forecast, by Country, 2018‒2031
11.3.1. U.S.
11.3.2. Canada
11.3.3. Mexico
12. Europe Digital Experience Monitoring (DEM) Market Analysis and Forecast
12.1. Regional Outlook
12.2. Digital Experience Monitoring (DEM) Market Size (US$ Bn) Analysis and Forecast, 2018‒2031
12.2.1. By Component
12.2.2. By Deployment
12.2.3. By Enterprise Size
12.2.4. By End-user
12.3. Digital Experience Monitoring (DEM) Market Size (US$ Bn) Forecast, by Country, 2018‒2031
12.3.1. Germany
12.3.2. U.K.
12.3.3. France
12.3.4. Italy
12.3.5. Spain
12.3.6. Rest of Europe
13. Asia Pacific Digital Experience Monitoring (DEM) Market Analysis and Forecast
13.1. Regional Outlook
13.2. Digital Experience Monitoring (DEM) Market Size (US$ Bn) Analysis and Forecast, 2018‒2031
13.2.1. By Component
13.2.2. By Deployment
13.2.3. By Enterprise Size
13.2.4. By End-user
13.3. Digital Experience Monitoring (DEM) Market Size (US$ Bn) Forecast, by Country, 2018‒2031
13.3.1. China
13.3.2. India
13.3.3. Japan
13.3.4. ASEAN
13.3.5. Rest of Asia Pacific
14. Middle East & Africa Digital Experience Monitoring (DEM) Market Analysis and Forecast
14.1. Regional Outlook
14.2. Digital Experience Monitoring (DEM) Market Size (US$ Bn) Analysis and Forecast, 2018‒2031
14.2.1. By Component
14.2.2. By Deployment
14.2.3. By Enterprise Size
14.2.4. By End-user
14.3. Digital Experience Monitoring (DEM) Market Size (US$ Bn) Forecast, by Country, 2018‒2031
14.3.1. Saudi Arabia
14.3.2. UAE
14.3.3. South Africa
14.3.4. Rest of Middle East & Africa
15. South America Digital Experience Monitoring (DEM) Market Analysis and Forecast
15.1. Regional Outlook
15.2. Digital Experience Monitoring (DEM) Market Size (US$ Bn) Analysis and Forecast, 2018‒2031
15.2.1. By Component
15.2.2. By Deployment
15.2.3. By Enterprise Size
15.2.4. By End-user
15.3. Digital Experience Monitoring (DEM) Market Size (US$ Bn) Forecast, by Country, 2018‒2031
15.3.1. Brazil
15.3.2. Argentina
15.3.3. Rest of South America
16. Competition Landscape
16.1. Market Competition Matrix, by Leading Players
16.2. Market Revenue Share Analysis (%), by Leading Players (2021)
16.3. Competitive Scenario
16.3.1. List of Emerging, Prominent and Leading Players
16.3.2. Major Mergers & Acquisitions, Expansions, Partnership, Contacts, Deals, etc.
17. Company Profiles
17.1. Dynatrace LLC
17.1.1. Business Overview
17.1.2. Company Revenue
17.1.3. Product Portfolio
17.1.4. Geographic Footprint
17.1.5. Strategic Partnership, Merger & Acquisition, Business Expansion, New Product Launch, Innovation etc.
17.2. Cisco
17.2.1. Business Overview
17.2.2. Company Revenue
17.2.3. Product Portfolio
17.2.4. Geographic Footprint
17.2.5. Strategic Partnership, Merger & Acquisition, Business Expansion, New Product Launch, Innovation etc.
17.3. New Relic, Inc.
17.3.1. Business Overview
17.3.2. Company Revenue
17.3.3. Product Portfolio
17.3.4. Geographic Footprint
17.3.5. Strategic Partnership, Merger & Acquisition, Business Expansion, New Product Launch, Innovation etc.
17.4. Splunk Inc.
17.4.1. Business Overview
17.4.2. Company Revenue
17.4.3. Product Portfolio
17.4.4. Geographic Footprint
17.4.5. Strategic Partnership, Merger & Acquisition, Business Expansion, New Product Launch, Innovation etc.
17.5. Zscaler, Inc.
17.5.1. Business Overview
17.5.2. Company Revenue
17.5.3. Product Portfolio
17.5.4. Geographic Footprint
17.5.5. Strategic Partnership, Merger & Acquisition, Business Expansion, New Product Launch, Innovation etc.
17.6. Datadog
17.6.1. Business Overview
17.6.2. Company Revenue
17.6.3. Product Portfolio
17.6.4. Geographic Footprint
17.6.5. Strategic Partnership, Merger & Acquisition, Business Expansion, New Product Launch, Innovation etc.
17.7. Aternity LLC
17.7.1. Business Overview
17.7.2. Company Revenue
17.7.3. Product Portfolio
17.7.4. Geographic Footprint
17.7.5. Strategic Partnership, Merger & Acquisition, Business Expansion, New Product Launch, Innovation etc.
17.8. Nexthink SA
17.8.1. Business Overview
17.8.2. Company Revenue
17.8.3. Product Portfolio
17.8.4. Geographic Footprint
17.8.5. Strategic Partnership, Merger & Acquisition, Business Expansion, New Product Launch, Innovation etc.
17.9. Lakeside Software, LLC
17.9.1. Business Overview
17.9.2. Company Revenue
17.9.3. Product Portfolio
17.9.4. Geographic Footprint
17.9.5. Strategic Partnership, Merger & Acquisition, Business Expansion, New Product Launch, Innovation etc.
17.10. Broadcom Inc.
17.10.1. Business Overview
17.10.2. Company Revenue
17.10.3. Product Portfolio
17.10.4. Geographic Footprint
17.10.5. Strategic Partnership, Merger & Acquisition, Business Expansion, New Product Launch, Innovation etc.
17.11. Apica
17.11.1. Business Overview
17.11.2. Company Revenue
17.11.3. Product Portfolio
17.11.4. Geographic Footprint
17.11.5. Strategic Partnership, Merger & Acquisition, Business Expansion, New Product Launch, Innovation etc.
17.12. SolarWinds Worldwide, LLC
17.12.1. Business Overview
17.12.2. Company Revenue
17.12.3. Product Portfolio
17.12.4. Geographic Footprint
17.12.5. Strategic Partnership, Merger & Acquisition, Business Expansion, New Product Launch, Innovation etc.
17.13. Riverbed Technology, Inc.
17.13.1. Business Overview
17.13.2. Company Revenue
17.13.3. Product Portfolio
17.13.4. Geographic Footprint
17.13.5. Strategic Partnership, Merger & Acquisition, Business Expansion, New Product Launch, Innovation etc.
17.14. Palo Alto Networks, Inc.
17.14.1. Business Overview
17.14.2. Company Revenue
17.14.3. Product Portfolio
17.14.4. Geographic Footprint
17.14.5. Strategic Partnership, Merger & Acquisition, Business Expansion, New Product Launch, Innovation etc.
18. Key Takeaways
List of Tables
Table 1: Acronyms Used in Digital Experience Monitoring (DEM) Market
Table 2: North America Digital Experience Monitoring (DEM) Market Revenue Analysis, by Country, 2022 - 2031 (US$ Bn)
Table 3: Europe Digital Experience Monitoring (DEM) Market Revenue Analysis, by Country, 2022 - 2031 (US$ Bn)
Table 4: Asia Pacific Digital Experience Monitoring (DEM) Market Revenue Analysis, by Country, 2022 - 2031 (US$ Bn)
Table 5: Middle East & Africa Digital Experience Monitoring (DEM) Market Revenue Analysis, by Country, 2022 and 2031 (US$ Bn)
Table 6: South America Digital Experience Monitoring (DEM) Market Revenue Analysis, by Country, 2022 - 2031 (US$ Bn)
Table 7: Global Digital Experience Monitoring (DEM) Market Value (US$ Bn) Forecast, by Component, 2018 – 2031
Table 8: Global Digital Experience Monitoring (DEM) Market Value (US$ Bn) Forecast, by Deployment, 2018 – 2031
Table 9: Global Digital Experience Monitoring (DEM) Market Value (US$ Bn) Forecast, by Enterprise Size, 2018 – 2031
Table 10: Global Digital Experience Monitoring (DEM) Market Value (US$ Bn) Forecast, by End-user, 2018 – 2031
Table 11: Global Digital Experience Monitoring (DEM) Market Volume (US$ Bn) Forecast, by Region, 2018 – 2031
Table 12: North America Digital Experience Monitoring (DEM) Market Value (US$ Bn) Forecast, by Component, 2018 – 2031
Table 13: North America Digital Experience Monitoring (DEM) Market Value (US$ Bn) Forecast, by Deployment, 2018 – 2031
Table 14: North America Digital Experience Monitoring (DEM) Market Value (US$ Bn) Forecast, by Enterprise Size, 2018 – 2031
Table 15: North America Digital Experience Monitoring (DEM) Market Value (US$ Bn) Forecast, by End-user, 2018 – 2031
Table 16: North America Digital Experience Monitoring (DEM) Market Value (US$ Bn) Forecast, by Country, 2018‒2031
Table 17: U.S. Digital Experience Monitoring (DEM) Market Revenue CAGR Breakdown (%), by Growth Term
Table 18: Canada Digital Experience Monitoring (DEM) Market Revenue CAGR Breakdown (%), by Growth Term
Table 19: Mexico Digital Experience Monitoring (DEM) Market Revenue CAGR Breakdown (%), by Growth Term
Table 20: Europe Digital Experience Monitoring (DEM) Market Value (US$ Bn) Forecast, by Component, 2018 – 2031
Table 21: Europe Digital Experience Monitoring (DEM) Market Value (US$ Bn) Forecast, by Deployment, 2018 – 2031
Table 22: Europe Digital Experience Monitoring (DEM) Market Value (US$ Bn) Forecast, by Enterprise Size, 2018 – 2031
Table 23: Europe Digital Experience Monitoring (DEM) Market Value (US$ Bn) Forecast, by End-user, 2018 – 2031
Table 24: Europe Digital Experience Monitoring (DEM) Market Value (US$ Bn) Forecast, by Country and Sub-region, 2018‒2031
Table 25: Germany Digital Experience Monitoring (DEM) Market Revenue CAGR Breakdown (%), by Growth Term
Table 26: U.K. Digital Experience Monitoring (DEM) Market Revenue CAGR Breakdown (%), by Growth Term
Table 27: France Digital Experience Monitoring (DEM) Market Revenue CAGR Breakdown (%), by Growth Term
Table 28: Spain Digital Experience Monitoring (DEM) Market Revenue CAGR Breakdown (%), by Growth Term
Table 29: Italy Digital Experience Monitoring (DEM) Market Revenue CAGR Breakdown (%), by Growth Term
Table 30: Asia Pacific Digital Experience Monitoring (DEM) Market Value (US$ Bn) Forecast, by Component, 2018 – 2031
Table 31: Asia Pacific Digital Experience Monitoring (DEM) Market Value (US$ Bn) Forecast, by Deployment, 2018 – 2031
Table 32: Asia Pacific Digital Experience Monitoring (DEM) Market Value (US$ Bn) Forecast, by Enterprise Size, 2018 – 2031
Table 33: Asia Pacific Digital Experience Monitoring (DEM) Market Value (US$ Bn) Forecast, by End-user, 2018 – 2031
Table 34: Asia Pacific Digital Experience Monitoring (DEM) Market Value (US$ Bn) Forecast, by Country and Sub-region, 2018‒2031
Table 35: China Digital Experience Monitoring (DEM) Market Revenue CAGR Breakdown (%), by Growth Term
Table 36: India Digital Experience Monitoring (DEM) Market Revenue CAGR Breakdown (%), by Growth Term
Table 37: Japan Digital Experience Monitoring (DEM) Market Revenue CAGR Breakdown (%), by Growth Term
Table 38: ASEAN Digital Experience Monitoring (DEM) Market Revenue CAGR Breakdown (%), by Growth Term
Table 39: Middle East & Africa Digital Experience Monitoring (DEM) Market Value (US$ Bn) Forecast, by Component, 2018 – 2031
Table 40: Middle East & Africa Digital Experience Monitoring (DEM) Market Value (US$ Bn) Forecast, by Deployment, 2018 – 2031
Table 41: Middle East & Africa Digital Experience Monitoring (DEM) Market Value (US$ Bn) Forecast, by Enterprise Size, 2018 – 2031
Table 42: Middle East & Africa Digital Experience Monitoring (DEM) Market Value (US$ Bn) Forecast, by End-user, 2018 – 2031
Table 43: Middle East & Africa Digital Experience Monitoring (DEM) Market Value (US$ Bn) Forecast, by Country and Sub-region, 2018‒2031
Table 44: Saudi Arabia Digital Experience Monitoring (DEM) Market Revenue CAGR Breakdown (%), by Growth Term
Table 45: United Arab Emirates Digital Experience Monitoring (DEM) Market Revenue CAGR Breakdown (%), by Growth Term
Table 46: South Africa Digital Experience Monitoring (DEM) Market Revenue CAGR Breakdown (%), by Growth Term
Table 47: South America Digital Experience Monitoring (DEM) Market Value (US$ Bn) Forecast, by Component, 2018 – 2031
Table 48: South America Digital Experience Monitoring (DEM) Market Value (US$ Bn) Forecast, by Deployment, 2018 – 2031
Table 49: South America Digital Experience Monitoring (DEM) Market Value (US$ Bn) Forecast, by Enterprise Size, 2018 – 2031
Table 50: South America Digital Experience Monitoring (DEM) Market Value (US$ Bn) Forecast, by End-user, 2018 – 2031
Table 51: South America Digital Experience Monitoring (DEM) Market Value (US$ Bn) Forecast, by Country and Sub-region, 2018‒2031
Table 52: Brazil Emirates Digital Experience Monitoring (DEM) Market Revenue CAGR Breakdown (%), by Growth Term
Table 53: Argentina Digital Experience Monitoring (DEM) Market Revenue CAGR Breakdown (%), by Growth Term
List of Figures
Figure 1: Global Digital Experience Monitoring (DEM) Market Size (US$ Bn) Forecast, 2018–2031
Figure 2: Global Digital Experience Monitoring (DEM) Market Revenue (US$ Bn) Opportunity Assessment, by Region, 2022E
Figure 3: Top Segment Analysis of Digital Experience Monitoring (DEM) Market
Figure 4: Global Digital Experience Monitoring (DEM) Market Revenue (US$ Bn) Opportunity Assessment, by Region, 2031F
Figure 5: Global Digital Experience Monitoring (DEM) Market Attractiveness Assessment, by Component
Figure 6: Global Digital Experience Monitoring (DEM) Market Attractiveness Assessment, by Deployment
Figure 7: Global Digital Experience Monitoring (DEM) Market Attractiveness Assessment, by Enterprise Size
Figure 8: Global Digital Experience Monitoring (DEM) Market Attractiveness Assessment, by End-user
Figure 9: Global Digital Experience Monitoring (DEM) Market Attractiveness Assessment, by Region
Figure 10: Global Digital Experience Monitoring (DEM) Market Revenue (US$ Bn) Historic Trends, 2016 - 2021
Figure 11: Global Digital Experience Monitoring (DEM) Market Revenue Opportunity (US$ Bn) Historic Trends, 2016 - 2021
Figure 12: Global Digital Experience Monitoring (DEM) Market Value Share Analysis, by Component, 2022
Figure 13: Global Digital Experience Monitoring (DEM) Market Value Share Analysis, by Component, 2031
Figure 14: Global Digital Experience Monitoring (DEM) Market Absolute Opportunity (US$ Bn), by Software, 2022-2031
Figure 15: Global Digital Experience Monitoring (DEM) Market Absolute Opportunity (US$ Bn), by Services, 2022-2031
Figure 16: Global Digital Experience Monitoring (DEM) Market Value Share Analysis, by Deployment, 2022
Figure 17: Global Digital Experience Monitoring (DEM) Market Value Share Analysis, by Deployment, 2031
Figure 18: Global Digital Experience Monitoring (DEM) Market Absolute Opportunity (US$ Bn), by Cloud, 2022-2031
Figure 19: Global Digital Experience Monitoring (DEM) Market Absolute Opportunity (US$ Bn), by On-premise, 2022-2031
Figure 20: Global Digital Experience Monitoring (DEM) Market Value Share Analysis, by Enterprise Size, 2022
Figure 21: Global Digital Experience Monitoring (DEM) Market Value Share Analysis, by Enterprise Size, 2031
Figure 22: Global Digital Experience Monitoring (DEM) Market Absolute Opportunity (US$ Bn), by SMEs, 2022-2031
Figure 23: Global Digital Experience Monitoring (DEM) Market Absolute Opportunity (US$ Bn), by Large Enterprises, 2022-2031
Figure 24: Global Digital Experience Monitoring (DEM) Market Value Share Analysis, by End-user, 2022
Figure 25: Global Digital Experience Monitoring (DEM) Market Value Share Analysis, by End-user, 2031
Figure 26: Global Digital Experience Monitoring (DEM) Market Absolute Opportunity (US$ Bn), by BFSI, 2022-2031
Figure 27: Global Digital Experience Monitoring (DEM) Market Absolute Opportunity (US$ Bn), by IT & Telecom, 2022-2031
Figure 28: Global Digital Experience Monitoring (DEM) Market Absolute Opportunity (US$ Bn), by Retail & E-commerce, 2022-2031
Figure 29: Global Digital Experience Monitoring (DEM) Market Absolute Opportunity (US$ Bn), by Healthcare, 2022-2031
Figure 30: Global Digital Experience Monitoring (DEM) Market Absolute Opportunity (US$ Bn), by Government, 2022-2031
Figure 31: Global Digital Experience Monitoring (DEM) Market Absolute Opportunity (US$ Bn), by Media & Entertainment, 2022-2031
Figure 32: Global Digital Experience Monitoring (DEM) Market Absolute Opportunity (US$ Bn), by Travel & Hospitality, 2022-2031
Figure 33: Global Digital Experience Monitoring (DEM) Market Absolute Opportunity (US$ Bn), by Others, 2022-2031
Figure 34: Global Digital Experience Monitoring (DEM) Market Opportunity (US$ Bn), by Region
Figure 35: Global Digital Experience Monitoring (DEM) Market Opportunity Share (%), by Region, 2022–2031
Figure 36: Global Digital Experience Monitoring (DEM) Market Size (US$ Bn), by Region, 2022 & 2031
Figure 37: Global Digital Experience Monitoring (DEM) Market Value Share Analysis, by Region, 2022
Figure 38: Global Digital Experience Monitoring (DEM) Market Value Share Analysis, by Region, 2031
Figure 39: North America Digital Experience Monitoring (DEM) Market Absolute Opportunity (US$ Bn), 2022-2031
Figure 40: Europe Digital Experience Monitoring (DEM) Market Absolute Opportunity (US$ Bn), 2022-2031
Figure 41: Asia Pacific Digital Experience Monitoring (DEM) Market Absolute Opportunity (US$ Bn), 2022-2031
Figure 42: Middle East & Africa Digital Experience Monitoring (DEM) Market Absolute Opportunity (US$ Bn), 2022-2031
Figure 43: South America Digital Experience Monitoring (DEM) Market Absolute Opportunity (US$ Bn), 2022-2031
Figure 44: North America Digital Experience Monitoring (DEM) Market Revenue Opportunity Share, by Component
Figure 45: North America Digital Experience Monitoring (DEM) Market Revenue Opportunity Share, by Deployment
Figure 46: North America Digital Experience Monitoring (DEM) Market Revenue Opportunity Share, by Enterprise Size
Figure 47: North America Digital Experience Monitoring (DEM) Market Revenue Opportunity Share, by End-user
Figure 48: North America Digital Experience Monitoring (DEM) Market Revenue Opportunity Share, by Country
Figure 49: North America Digital Experience Monitoring (DEM) Market Value Share Analysis, by Component, 2022
Figure 50: North America Digital Experience Monitoring (DEM) Market Value Share Analysis, by Component, 2031
Figure 51: North America Digital Experience Monitoring (DEM) Market Absolute Opportunity (US$ Bn), by Software, 2022-2031
Figure 52: North America Digital Experience Monitoring (DEM) Market Absolute Opportunity (US$ Bn), by Services, 2022-2031
Figure 53: North America Digital Experience Monitoring (DEM) Market Value Share Analysis, by Deployment, 2022
Figure 54: North America Digital Experience Monitoring (DEM) Market Value Share Analysis, by Deployment, 2031
Figure 55: North America Digital Experience Monitoring (DEM) Market Absolute Opportunity (US$ Bn), by Cloud, 2022-2031
Figure 56: North America Digital Experience Monitoring (DEM) Market Absolute Opportunity (US$ Bn), by On-premise, 2022-2031
Figure 57: North America Digital Experience Monitoring (DEM) Market Value Share Analysis, by Enterprise Size, 2022
Figure 58: North America Digital Experience Monitoring (DEM) Market Value Share Analysis, by Enterprise Size, 2031
Figure 59: North America Digital Experience Monitoring (DEM) Market Absolute Opportunity (US$ Bn), by SMEs, 2022-2031
Figure 60: North America Digital Experience Monitoring (DEM) Market Absolute Opportunity (US$ Bn), by Large Enterprises, 2022-2031
Figure 61: North America Digital Experience Monitoring (DEM) Market Value Share Analysis, by End-user, 2022
Figure 62: North America Digital Experience Monitoring (DEM) Market Value Share Analysis, by End-user, 2031
Figure 63: North America Digital Experience Monitoring (DEM) Market Absolute Opportunity (US$ Bn), by BFSI, 2022-2031
Figure 64: North America Digital Experience Monitoring (DEM) Market Absolute Opportunity (US$ Bn), by IT & Telecom, 2022-2031
Figure 65: North America Digital Experience Monitoring (DEM) Market Absolute Opportunity (US$ Bn), by Retail & E-commerce, 2022-2031
Figure 66: North America Digital Experience Monitoring (DEM) Market Absolute Opportunity (US$ Bn), by Healthcare, 2022-2031
Figure 67: North America Digital Experience Monitoring (DEM) Market Absolute Opportunity (US$ Bn), by Government, 2022-2031
Figure 68: North America Digital Experience Monitoring (DEM) Market Absolute Opportunity (US$ Bn), by Media & Entertainment, 2022-2031
Figure 69: North America Digital Experience Monitoring (DEM) Market Absolute Opportunity (US$ Bn), by Travel & Hospitality, 2022-2031
Figure 70: North America Digital Experience Monitoring (DEM) Market Absolute Opportunity (US$ Bn), by Others, 2022-2031
Figure 71: North America Digital Experience Monitoring (DEM) Market Value Share Analysis, by Country, 2022
Figure 72: North America Digital Experience Monitoring (DEM) Market Value Share Analysis, by Country, 2031
Figure 73: U.S. Digital Experience Monitoring (DEM) Market Opportunity Growth Analysis (US$ Bn) Forecast, 2022-2031
Figure 74: Canada Digital Experience Monitoring (DEM) Market Opportunity Growth Analysis (US$ Bn) Forecast, 2022-2031
Figure 75: Mexico Digital Experience Monitoring (DEM) Market Opportunity Growth Analysis (US$ Bn) Forecast, 2022-2031
Figure 76: Europe Digital Experience Monitoring (DEM) Market Revenue Opportunity Share, by Component
Figure 77: Europe Digital Experience Monitoring (DEM) Market Revenue Opportunity Share, by Deployment
Figure 78: Europe Digital Experience Monitoring (DEM) Market Revenue Opportunity Share, by Enterprise Size
Figure 79: Europe Digital Experience Monitoring (DEM) Market Revenue Opportunity Share, by End-user
Figure 80: Europe Digital Experience Monitoring (DEM) Market Revenue Opportunity Share, by Country
Figure 81: Europe Digital Experience Monitoring (DEM) Market Value Share Analysis, by Component, 2022
Figure 82: Europe Digital Experience Monitoring (DEM) Market Value Share Analysis, by Component, 2031
Figure 83: Europe Digital Experience Monitoring (DEM) Market Absolute Opportunity (US$ Bn), by Software, 2022-2031
Figure 84: Europe Digital Experience Monitoring (DEM) Market Absolute Opportunity (US$ Bn), by Services, 2022-2031
Figure 85: Europe Digital Experience Monitoring (DEM) Market Value Share Analysis, by Deployment, 2022
Figure 86: Europe Digital Experience Monitoring (DEM) Market Value Share Analysis, by Deployment, 2031
Figure 87: Europe Digital Experience Monitoring (DEM) Market Absolute Opportunity (US$ Bn), by Cloud, 2022-2031
Figure 88: Europe Digital Experience Monitoring (DEM) Market Absolute Opportunity (US$ Bn), by On-premise, 2022-2031
Figure 89: Europe Digital Experience Monitoring (DEM) Market Value Share Analysis, by Enterprise Size, 2022
Figure 90: Europe Digital Experience Monitoring (DEM) Market Value Share Analysis, by Enterprise Size, 2031
Figure 91: Europe Digital Experience Monitoring (DEM) Market Absolute Opportunity (US$ Bn), by SMEs, 2022-2031
Figure 92: Europe Digital Experience Monitoring (DEM) Market Absolute Opportunity (US$ Bn), by Large Enterprises, 2022-2031
Figure 93: Europe Digital Experience Monitoring (DEM) Market Value Share Analysis, by End-user, 2022
Figure 94: Europe Digital Experience Monitoring (DEM) Market Value Share Analysis, by End-user, 2031
Figure 95: Europe Digital Experience Monitoring (DEM) Market Absolute Opportunity (US$ Bn), by BFSI, 2022-2031
Figure 96: Europe Digital Experience Monitoring (DEM) Market Absolute Opportunity (US$ Bn), by IT & Telecom, 2022-2031
Figure 97: Europe Digital Experience Monitoring (DEM) Market Absolute Opportunity (US$ Bn), by Retail & E-commerce, 2022-2031
Figure 98: Europe Digital Experience Monitoring (DEM) Market Absolute Opportunity (US$ Bn), by Healthcare, 2022-2031
Figure 99: Europe Digital Experience Monitoring (DEM) Market Absolute Opportunity (US$ Bn), by Government, 2022-2031
Figure 100: Europe Digital Experience Monitoring (DEM) Market Absolute Opportunity (US$ Bn), by Media & Entertainment, 2022-2031
Figure 101: Europe Digital Experience Monitoring (DEM) Market Absolute Opportunity (US$ Bn), by Travel & Hospitality, 2022-2031
Figure 102: Europe Digital Experience Monitoring (DEM) Market Absolute Opportunity (US$ Bn), by Others, 2022-2031
Figure 103: Europe Digital Experience Monitoring (DEM) Market Value Share Analysis, by Country and Sub-region, 2022
Figure 104: Europe Digital Experience Monitoring (DEM) Market Value Share Analysis, by Country and Sub-region, 2031
Figure 105: Germany Digital Experience Monitoring (DEM) Market Opportunity Growth Analysis (US$ Bn) Forecast, 2022-2031
Figure 106: U.K. Digital Experience Monitoring (DEM) Market Opportunity Growth Analysis (US$ Bn) Forecast, 2022-2031
Figure 107: France Digital Experience Monitoring (DEM) Market Opportunity Growth Analysis (US$ Bn) Forecast, 2022-2031
Figure 108: Spain Digital Experience Monitoring (DEM) Market Opportunity Growth Analysis (US$ Bn) Forecast, 2022-2031
Figure 109: Italy Digital Experience Monitoring (DEM) Market Opportunity Growth Analysis (US$ Bn) Forecast, 2022-2031
Figure 110: Asia Pacific Digital Experience Monitoring (DEM) Market Revenue Opportunity Share, by Component
Figure 111: Asia Pacific Digital Experience Monitoring (DEM) Market Revenue Opportunity Share, by Deployment
Figure 112: Asia Pacific Digital Experience Monitoring (DEM) Market Revenue Opportunity Share, by Enterprise Size
Figure 113: Asia Pacific Digital Experience Monitoring (DEM) Market Revenue Opportunity Share, by End-user
Figure 114: Asia Pacific Digital Experience Monitoring (DEM) Market Revenue Opportunity Share, by Country
Figure 115: Asia Pacific Digital Experience Monitoring (DEM) Market Value Share Analysis, by Component, 2022
Figure 116: Asia Pacific Digital Experience Monitoring (DEM) Market Value Share Analysis, by Component, 2031
Figure 117: Asia Pacific Digital Experience Monitoring (DEM) Market Absolute Opportunity (US$ Bn), by Software, 2022-2031
Figure 118: Asia Pacific Digital Experience Monitoring (DEM) Market Absolute Opportunity (US$ Bn), by Services, 2022-2031
Figure 119: Asia Pacific Digital Experience Monitoring (DEM) Market Value Share Analysis, by Deployment, 2022
Figure 120: Asia Pacific Digital Experience Monitoring (DEM) Market Value Share Analysis, by Deployment, 2031
Figure 121: Asia Pacific Digital Experience Monitoring (DEM) Market Absolute Opportunity (US$ Bn), by Cloud, 2022-2031
Figure 122: Asia Pacific Digital Experience Monitoring (DEM) Market Absolute Opportunity (US$ Bn), by On-premise, 2022-2031
Figure 123: Asia Pacific Digital Experience Monitoring (DEM) Market Value Share Analysis, by Enterprise Size, 2022
Figure 124: Asia Pacific Digital Experience Monitoring (DEM) Market Value Share Analysis, by Enterprise Size, 2031
Figure 125: Asia Pacific Digital Experience Monitoring (DEM) Market Absolute Opportunity (US$ Bn), by SMEs, 2022-2031
Figure 126: Asia Pacific Digital Experience Monitoring (DEM) Market Absolute Opportunity (US$ Bn), by Large Enterprises, 2022-2031
Figure 127: Asia Pacific Digital Experience Monitoring (DEM) Market Value Share Analysis, by End-user, 2022
Figure 128: Asia Pacific Digital Experience Monitoring (DEM) Market Value Share Analysis, by End-user, 2031
Figure 129: Asia Pacific Digital Experience Monitoring (DEM) Market Absolute Opportunity (US$ Bn), by BFSI, 2022-2031
Figure 130: Asia Pacific Digital Experience Monitoring (DEM) Market Absolute Opportunity (US$ Bn), by IT & Telecom, 2022-2031
Figure 131: Asia Pacific Digital Experience Monitoring (DEM) Market Absolute Opportunity (US$ Bn), by Retail & E-commerce, 2022-2031
Figure 132: Asia Pacific Digital Experience Monitoring (DEM) Market Absolute Opportunity (US$ Bn), by Healthcare, 2022-2031
Figure 133: Asia Pacific Digital Experience Monitoring (DEM) Market Absolute Opportunity (US$ Bn), by Government, 2022-2031
Figure 134: Asia Pacific Digital Experience Monitoring (DEM) Market Absolute Opportunity (US$ Bn), by Media & Entertainment, 2022-2031
Figure 135: Asia Pacific Digital Experience Monitoring (DEM) Market Absolute Opportunity (US$ Bn), by Travel & Hospitality, 2022-2031
Figure 136: Asia Pacific Digital Experience Monitoring (DEM) Market Absolute Opportunity (US$ Bn), by Others, 2022-2031
Figure 137: Asia Pacific Digital Experience Monitoring (DEM) Market Value Share Analysis, by Country and Sub-region, 2022
Figure 138: Asia Pacific Digital Experience Monitoring (DEM) Market Value Share Analysis, by Country and Sub-region, 2031
Figure 139: China Digital Experience Monitoring (DEM) Market Opportunity Growth Analysis (US$ Bn) Forecast, 2022-2031
Figure 140: India Digital Experience Monitoring (DEM) Market Opportunity Growth Analysis (US$ Bn) Forecast, 2022-2031
Figure 141: Japan Digital Experience Monitoring (DEM) Market Opportunity Growth Analysis (US$ Bn) Forecast, 2022-2031
Figure 142: ASEAN Digital Experience Monitoring (DEM) Market Opportunity Growth Analysis (US$ Bn) Forecast, 2022-2031
Figure 143: Middle East & Africa Digital Experience Monitoring (DEM) Market Revenue Opportunity Share, by Component
Figure 144: Middle East & Africa Digital Experience Monitoring (DEM) Market Revenue Opportunity Share, by Deployment
Figure 145: Middle East & Africa Digital Experience Monitoring (DEM) Market Revenue Opportunity Share, by Enterprise Size
Figure 146: Middle East & Africa Digital Experience Monitoring (DEM) Market Revenue Opportunity Share, by End-user
Figure 147: Middle East & Africa Digital Experience Monitoring (DEM) Market Revenue Opportunity Share, by Country
Figure 148: Middle East & Africa Digital Experience Monitoring (DEM) Market Value Share Analysis, by Component, 2022
Figure 149: Middle East & Africa Digital Experience Monitoring (DEM) Market Value Share Analysis, by Component, 2031
Figure 150: Middle East & Africa Digital Experience Monitoring (DEM) Market Absolute Opportunity (US$ Bn), by Software, 2022-2031
Figure 151: Middle East & Africa Digital Experience Monitoring (DEM) Market Absolute Opportunity (US$ Bn), by Services, 2022-2031
Figure 152: Middle East & Africa Digital Experience Monitoring (DEM) Market Value Share Analysis, by Deployment, 2022
Figure 153: Middle East & Africa Digital Experience Monitoring (DEM) Market Value Share Analysis, by Deployment, 2031
Figure 154: Middle East & Africa Digital Experience Monitoring (DEM) Market Absolute Opportunity (US$ Bn), by Cloud, 2022-2031
Figure 155: Middle East & Africa Digital Experience Monitoring (DEM) Market Absolute Opportunity (US$ Bn), by On-premise, 2022-2031
Figure 156: Middle East & Africa Digital Experience Monitoring (DEM) Market Value Share Analysis, by Enterprise Size, 2022
Figure 157: Middle East & Africa Digital Experience Monitoring (DEM) Market Value Share Analysis, by Enterprise Size, 2031
Figure 158: Middle East & Africa Digital Experience Monitoring (DEM) Market Absolute Opportunity (US$ Bn), by SMEs, 2022-2031
Figure 159: Middle East & Africa Digital Experience Monitoring (DEM) Market Absolute Opportunity (US$ Bn), by Large Enterprises, 2022-2031
Figure 160: Middle East & Africa Digital Experience Monitoring (DEM) Market Value Share Analysis, by End-user, 2022
Figure 161: Middle East & Africa Digital Experience Monitoring (DEM) Market Value Share Analysis, by End-user, 2031
Figure 162: Middle East & Africa Digital Experience Monitoring (DEM) Market Absolute Opportunity (US$ Bn), by BFSI, 2022-2031
Figure 163: Middle East & Africa Digital Experience Monitoring (DEM) Market Absolute Opportunity (US$ Bn), by IT & Telecom, 2022-2031
Figure 164: Middle East & Africa Digital Experience Monitoring (DEM) Market Absolute Opportunity (US$ Bn), by Retail & E-commerce, 2022-2031
Figure 165: Middle East & Africa Digital Experience Monitoring (DEM) Market Absolute Opportunity (US$ Bn), by Healthcare, 2022-2031
Figure 166: Middle East & Africa Digital Experience Monitoring (DEM) Market Absolute Opportunity (US$ Bn), by Government, 2022-2031
Figure 167: Middle East & Africa Digital Experience Monitoring (DEM) Market Absolute Opportunity (US$ Bn), by Media & Entertainment, 2022-2031
Figure 168: Middle East & Africa Digital Experience Monitoring (DEM) Market Absolute Opportunity (US$ Bn), by Travel & Hospitality, 2022-2031
Figure 169: Middle East & Africa Digital Experience Monitoring (DEM) Market Absolute Opportunity (US$ Bn), by Others, 2022-2031
Figure 170: Middle East & Africa Digital Experience Monitoring (DEM) Market Value Share Analysis, by Country and Sub-region, 2022
Figure 171: Middle East & Africa Digital Experience Monitoring (DEM) Market Value Share Analysis, by Country and Sub-region, 2031
Figure 172: Saudi Arabia Digital Experience Monitoring (DEM) Market Opportunity Growth Analysis (US$ Bn) Forecast, 2022-2031
Figure 173: United Arab Emirates Digital Experience Monitoring (DEM) Market Opportunity Growth Analysis (US$ Bn) Forecast, 2022-2031
Figure 174: South Africa Digital Experience Monitoring (DEM) Market Opportunity Growth Analysis (US$ Bn) Forecast, 2022-2031
Figure 175: South America Digital Experience Monitoring (DEM) Market Revenue Opportunity Share, by Component
Figure 176: South America Digital Experience Monitoring (DEM) Market Revenue Opportunity Share, by Deployment
Figure 177: South America Digital Experience Monitoring (DEM) Market Revenue Opportunity Share, by Enterprise Size
Figure 178: South America Digital Experience Monitoring (DEM) Market Revenue Opportunity Share, by End-user
Figure 179: South America Digital Experience Monitoring (DEM) Market Revenue Opportunity Share, by Country
Figure 180: South America Digital Experience Monitoring (DEM) Market Value Share Analysis, by Component, 2022
Figure 181: South America Digital Experience Monitoring (DEM) Market Value Share Analysis, by Component, 2031
Figure 182: South America Digital Experience Monitoring (DEM) Market Absolute Opportunity (US$ Bn), by Software, 2022-2031
Figure 183: South America Digital Experience Monitoring (DEM) Market Absolute Opportunity (US$ Bn), by Services, 2022-2031
Figure 184: South America Digital Experience Monitoring (DEM) Market Value Share Analysis, by Deployment, 2022
Figure 185: South America Digital Experience Monitoring (DEM) Market Value Share Analysis, by Deployment, 2031
Figure 186: South America Digital Experience Monitoring (DEM) Market Absolute Opportunity (US$ Bn), by Cloud, 2022-2031
Figure 187: South America Digital Experience Monitoring (DEM) Market Absolute Opportunity (US$ Bn), by On-premise, 2022-2031
Figure 188: South America Digital Experience Monitoring (DEM) Market Value Share Analysis, by Enterprise Size, 2022
Figure 189: South America Digital Experience Monitoring (DEM) Market Value Share Analysis, by Enterprise Size, 2031
Figure 190: South America Digital Experience Monitoring (DEM) Market Absolute Opportunity (US$ Bn), by SMEs, 2022-2031
Figure 191: South America Digital Experience Monitoring (DEM) Market Absolute Opportunity (US$ Bn), by Large Enterprises, 2022-2031
Figure 192: South America Digital Experience Monitoring (DEM) Market Value Share Analysis, by End-user, 2022
Figure 193: South America Digital Experience Monitoring (DEM) Market Value Share Analysis, by End-user, 2031
Figure 194: South America Digital Experience Monitoring (DEM) Market Absolute Opportunity (US$ Bn), by BFSI, 2022-2031
Figure 195: South America Digital Experience Monitoring (DEM) Market Absolute Opportunity (US$ Bn), by IT & Telecom, 2022-2031
Figure 196: South America Digital Experience Monitoring (DEM) Market Absolute Opportunity (US$ Bn), by Retail & E-commerce, 2022-2031
Figure 197: South America Digital Experience Monitoring (DEM) Market Absolute Opportunity (US$ Bn), by Healthcare, 2022-2031
Figure 198: South America Digital Experience Monitoring (DEM) Market Absolute Opportunity (US$ Bn), by Government, 2022-2031
Figure 199: South America Digital Experience Monitoring (DEM) Market Absolute Opportunity (US$ Bn), by Media & Entertainment, 2022-2031
Figure 200: South America Digital Experience Monitoring (DEM) Market Absolute Opportunity (US$ Bn), by Travel & Hospitality, 2022-2031
Figure 201: South America Digital Experience Monitoring (DEM) Market Absolute Opportunity (US$ Bn), by Others, 2022-2031
Figure 202: South America Digital Experience Monitoring (DEM) Market Value Share Analysis, by Country and Sub-region, 2022
Figure 203: South America Digital Experience Monitoring (DEM) Market Value Share Analysis, by Country and Sub-region, 2031
Figure 204: Brazil Digital Experience Monitoring (DEM) Market Opportunity Growth Analysis (US$ Bn) Forecast, 2022-2031
Figure 205: Argentina Digital Experience Monitoring (DEM) Market Opportunity Growth Analysis (US$ Bn) Forecast, 2022-2031
Copyright © Transparency Market Research, Inc. All Rights reserved
Trust Online

Digital Experience Monitoring [DEM] Market