
Reports
Reports
Rapidly spreading coronavirus, shutting down businesses, and lockdowns negatively affected almost every industry during the first wave of the COVID-19. It has affected the telecommunication sector strongly. With sudden change in work environment and work from homes routines, companies in the digital BSS market built up productive solutions within a few months. With digitalization, transformation in BSS, creating personalized experience for customers, and providing cloud-based solutions, market players are paving the way for the growth of the digital BSS market. Due to innovative technological trends in digital transformation, cloud services, billing management, digital CRM, and fastest delivery and management of communications services, digital BSS market is booming.
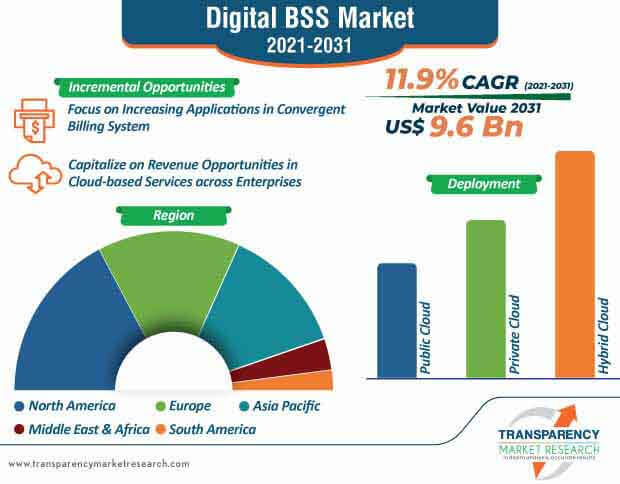
Digitalization has created a number of opportunities for market players. Advanced technologies have influenced customer lifecycle by providing top quality services and amazing experience. Digital BSS services help businesses and organizations to cater expectations of customers with rapidly changing technological trends. Digital BSS market players are taking advantage of changing technological trends and implementing it to create huge customer base. Web analytics and CRM are used to improve customer experience and connect with large audiences. The rapidly developing machine learning (ML) and artificial intelligence (AI) technologies also support the business. Adoption and increasing demand for emerging technologies across enterprises are expected to boost the global digital BSS market in the upcoming years.
The development of eCommerce products, billing & management, and rising web portals providing services in various industries such as BFSI, healthcare, automobile, government, IT & telecom have positively influenced the market. Digitalization promotes adoption of newest technologies to know customer lifecycle from ordering, billing to sales and revenue management. The digital BSS market is exhibiting lucrative business opportunities in every step of business.
Increasing online transactions, adoption of advanced technology, R&D in cloud services, Internet of Things (IoT), and expansion of telecom field support market contributors to explore their businesses of providing digital BSS services. The implementation of OSS BSS systems and platforms in North America to improve customer acquisition to generate more opportunities.
Adoption of cloud-based services and booming telecommunications sector after the pandemic in Asian countries such as India, Japan, and China are likely to generate more revenue opportunities. Innovations and improved infrastructure for establishing businesses and growth in information & technology services are also driving the digital BSS market.
Accenture, Amdocs, Ericsson, Huawei Technologies, IBM Corporation, Infosys, and Tata Consultancy Services are some of the key players operating in the global digital BSS market. The increasing competition among these companies help develop strong relationships with customers by providing quality services. The rising demand for convergent billing system drives the global digital BSS market in Asia Pacific. In order to reduce expenses, IT organizations are using SaaS digital BSS that provides security and compliance. The introduction of new technologies also contributes to the market expansion. Netcracker Digital BSS support the entire customer lifecycle starting from discovery, shopping, ordering, and billing to payment and maintenance. It provide next-generation and value-added services, IoT, 5G, cloud, and virtualized services.
Analysts’ Viewpoint
Digital BSS portfolio is a customer-centric platform that is engineered for innovation and improvement in revenue. In a virtualized network environment, digital BSS provides flexible and convergent systems for business automation and establishing their brand. It also provide 5G opportunities with the help of advanced 5G use cases. Companies are focusing on digital transformation and digital engagement for customers by implementing cloud services. Market contributors should focus on implementing emerging technologies to improve customer experience. High capital costs of digital BSS can hamper the global market. The challenge remains to reduce the investment cost so that small- and medium-sized enterprises can also adopt these services as per their need and budget.
|
Attribute |
Detail |
|
Market Size Value in 2020 (Base Year) |
US$ 2.8 Bn |
|
Market Forecast Value in 2031 |
US$ 9.6 Bn |
|
Growth Rate (CAGR) |
11.9% |
|
Forecast Period |
2021-2031 |
|
Quantitative Units |
US$ Mn for Value |
|
Market Analysis |
The report includes market size assessment for the historic period 2016-2019, along with base year and forecast period, in terms of value (US$ Mn). It also provides insights such as regional analysis, opportunity assessment, product development and innovation, and ecosystem analysis. |
|
Competition Landscape |
|
|
Format |
Electronic (PDF) + Excel |
|
Market Segmentation |
|
|
Regions Covered |
|
|
Countries Covered |
|
|
Companies Profiled |
|
|
Customization Scope |
Available upon Request |
|
Pricing |
Available upon Request |
The Digital BSS Market is studied from 2021-2031
The Digital BSS market is projected to reach the valuation of US$ US$ 9.6 Bn By 2031
The Digital BSS market is expected to grow at a CAGR of 11.9% during 2021-2031
Key players operating in the global digital BSS market are Accenture Plc, Amdocs Ltd., BearingPoint, Capgemini SE, Cerillion, Comarch SA, Comviva Technologies Limited, CSG Systems International, Inc., Telefonaktiebolaget LM Ericsson, Huawei Technologies Co., Ltd., IBM Corporation, Infosys Limited, MDS Global, NetCracker Technology Corporation, Nokia Corporation, Optiva, Inc., Oracle Corporation, Sigma Software, Stl.tech, Tata Consultancy Services Ltd., and ZTE Corporation
North America holds highest share during 2021-2031
1. Preface
1.1. Market Introduction
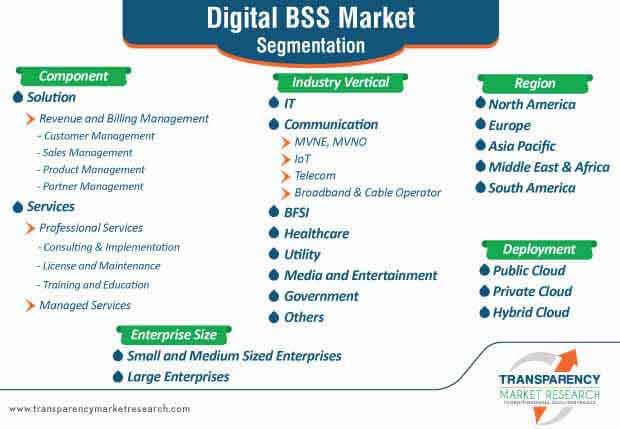
1.2. Market Segmentation
1.3. Key Research Objectives
2. Assumptions and Research Methodology
2.1. Research Methodology
2.1.1. List of Primary and Secondary Sources
2.2. Key Assumptions for Data Modelling
3. Executive Summary - Global Digital BSS Market
4. Market Overview
4.1. Market Definition
4.2. Technology/ Product Roadmap
4.3. Market Factor Analysis
4.3.1. Forecast Factors
4.3.2. Ecosystem/ Value Chain Analysis
4.3.3. Market Dynamics (Growth Influencers)
4.3.3.1. Drivers
4.3.3.2. Restraints
4.3.3.3. Opportunities
4.3.3.4. Impact Analysis of Drivers and Restraints
4.4. COVID-19 Impact Analysis
4.4.1. Impact of COVID-19 on the Digital BSS Market
4.4.2. End-user Sentiment Analysis: Comparative Analysis on Spending
4.4.2.1. Increase in Spending
4.4.2.2. Decrease in Spending
4.4.3. Short Term and Long Term Impact on the Market
4.5. SaaS Based Model – Digital BSS Market
4.5.1. Overview and Analysis of SaaS Based Digital BSS
4.5.2. Adoption Analysis (%) of SaaS Based Digital BSS, by Industry Vertical
4.5.2.1. IT
4.5.2.2. Communication
4.5.2.2.1. MVNE, MVNO
4.5.2.2.2. IoT
4.5.2.2.3. Telecom
4.5.2.2.4. Broadband & Cable Operator
4.5.2.3. BFSI
4.5.2.4. Healthcare
4.5.2.5. Utility
4.5.2.6. Media and Entertainment
4.5.2.7. Government
4.5.2.8. Others
4.6. Pricing Analysis of SaaS Based Digital BSS
4.6.1. Pay-as-you-go
4.6.2. Subscription
4.7. Use Cases of Digital BSS Market, by Industry
4.7.1. IT
4.7.2. Communication
4.7.3. BFSI
4.7.4. Healthcare
4.7.5. Utility
4.7.6. Media and Entertainment
4.7.7. Government
4.7.8. Others
4.8. Market Opportunity Assessment – by Region (North America/ Europe/ Asia Pacific/ Middle East & Africa/ South America)
4.8.1. By Component
4.8.2. By Deployment
4.8.3. By Enterprise Size
4.8.4. By Industry Vertical
4.9. Competitive Scenario
4.9.1. List of Emerging, Prominent, and Leading Players
4.9.2. Major Mergers & Acquisitions, Expansions, Partnership, Contacts, Deals, Etc.
5. Global Digital BSS Market Analysis and Forecast
5.1. Market Revenue Analysis (US$ Mn), 2016-2031
5.1.1. Historic Growth Trends, 2016-2020
5.1.2. Forecast Trends, 2021-2031
5.2. Pricing Model Analysis/ Price Trend Analysis
6. Global Digital BSS Market Analysis, by Component
6.1. Overview and Definitions
6.2. Key Segment Analysis
6.3. Digital BSS Market Size (US$ Mn) Forecast, by Component, 2018 - 2031
6.3.1. Solution
6.3.1.1. Revenue and Billing Management
6.3.1.2. Customer Management
6.3.1.3. Sales Management
6.3.1.4. Product Management
6.3.1.5. Partner Management
6.3.2. Services
6.3.2.1. Professional Services
6.3.2.1.1. Consulting & Implementation
6.3.2.1.2. License and Maintenance
6.3.2.1.3. Training and Education
6.3.2.2. Managed Services
7. Global Digital BSS Market Analysis, by Deployment
7.1. Overview and Definitions
7.2. Key Segment Analysis
7.3. Digital BSS Market Size (US$ Mn) Forecast, by Deployment, 2018 - 2031
7.3.1. Public Cloud
7.3.2. Private Cloud
7.3.3. Hybrid Cloud
8. Global Digital BSS Market Analysis, by Enterprise Size
8.1. Overview and Definitions
8.2. Key Segment Analysis
8.3. Digital BSS Market Size (US$ Mn) Forecast, by Enterprise Size, 2018 - 2031
8.3.1. Small and Medium Sized Enterprises
8.3.2. Large Enterprises
9. Global Digital BSS Market Analysis, by Industry Vertical
9.1. Overview and Definitions
9.2. Key Segment Analysis
9.3. Digital BSS Market Size (US$ Mn) Forecast, by Industry Vertical, 2018 - 2031
9.3.1. IT
9.3.2. Communication
9.3.2.1. MVNE, MVNO
9.3.2.2. IoT
9.3.2.3. Telecom
9.3.2.4. Broadband & Cable Operator
9.3.3. BFSI
9.3.4. Healthcare
9.3.5. Utility
9.3.6. Media and Entertainment
9.3.7. Government
9.3.8. Others
10. Global Digital BSS Market Analysis and Forecast, by Region
10.1. Key Findings
10.2. Digital BSS Market Size (US$ Mn) Forecast, by Region, 2018 - 2031
10.2.1. North America
10.2.2. Europe
10.2.3. Asia Pacific
10.2.4. Middle East & Africa
10.2.5. South America
11. North America Digital BSS Market Analysis
11.1. Regional Outlook
11.2. Digital BSS Market Size (US$ Mn) Analysis and Forecast (2018 - 2031)
11.2.1. By Component
11.2.2. By Deployment
11.2.3. By Enterprise Size
11.2.4. By Industry Vertical
11.3. Digital BSS Market Size (US$ Mn) Forecast, by Country, 2018 - 2031
11.3.1. U.S.
11.3.2. Canada
11.3.3. Mexico
12. Europe Digital BSS Market Analysis and Forecast
12.1. Regional Outlook
12.2. Digital BSS Market Size (US$ Mn) Analysis and Forecast (2018 - 2031)
12.2.1. By Component
12.2.2. By Deployment
12.2.3. By Enterprise Size
12.2.4. By Industry Vertical
12.3. Digital BSS Market Size (US$ Mn) Forecast, by Country & Sub-region, 2018 - 2031
12.3.1. Germany
12.3.2. U.K.
12.3.3. France
12.3.4. Spain
12.3.5. Italy
12.3.6. Rest of Europe
13. APAC Digital BSS Market Analysis and Forecast
13.1. Regional Outlook
13.2. Digital BSS Market Size (US$ Mn) Analysis and Forecast (2018 - 2031)
13.2.1. By Component
13.2.2. By Deployment
13.2.3. By Enterprise Size
13.2.4. By Industry Vertical
13.3. Digital BSS Market Size (US$ Mn) Forecast, by Country & Sub-region , 2018 - 2031
13.3.1. China
13.3.2. India
13.3.3. Japan
13.3.4. ASEAN
13.3.5. Rest of Asia Pacific
14. Middle East & Africa (MEA) Digital BSS Market Analysis and Forecast
14.1. Regional Outlook
14.2. Digital BSS Market Size (US$ Mn) Analysis and Forecast (2018 - 2031)
14.2.1. By Component
14.2.2. By Deployment
14.2.3. By Enterprise Size
14.2.4. By Industry Vertical
14.3. Digital BSS Market Size (US$ Mn) Forecast, by Country & Sub-region, 2018 - 2031
14.3.1. Saudi Arabia
14.3.2. The United Arab Emirates
14.3.3. South Africa
14.3.4. Rest of Middle East & Africa (MEA)
15. South America Digital BSS Market Analysis and Forecast
15.1. Regional Outlook
15.2. Digital BSS Market Size (US$ Mn) Analysis and Forecast (2018 - 2031)
15.2.1. By Component
15.2.2. By Deployment
15.2.3. By Enterprise Size
15.2.4. By Industry Vertical
15.3. Digital BSS Market Size (US$ Mn) Forecast, by Country & Sub-region, 2018 - 2031
15.3.1. Brazil
15.3.2. Argentina
15.3.3. Rest of South America
16. Competition Landscape
16.1. Market Competition Matrix, by Leading Players
16.2. Market Revenue Share Analysis (%), by Leading Players (2020)
16.3. Product Mapping of Leading Players Operating in the Market
16.3.1. Product Features
16.3.2. Product USP
16.3.3. Product Strength/ Weakness (Need/ Require Benchmark Product for comparing other products)
16.4. Analysis of Approach About Companies Developing Solution for Industry, by Region
16.4.1. North America
16.4.2. Europe
16.4.3. Asia Pacific
16.4.4. Middle East & Africa
16.4.5. South America
17. Company Profiles
17.1. Accenture Plc
17.1.1. Business Overview
17.1.2. Product Portfolio
17.1.3. Geographical Footprint
17.1.4. Revenue and Strategy
17.2. Amdocs Ltd.
17.2.1. Business Overview
17.2.2. Product Portfolio
17.2.3. Geographical Footprint
17.2.4. Revenue and Strategy
17.3. BearingPoint
17.3.1. Business Overview
17.3.2. Product Portfolio
17.3.3. Geographical Footprint
17.3.4. Revenue and Strategy
17.4. Capgemini SE
17.4.1. Business Overview
17.4.2. Product Portfolio
17.4.3. Geographical Footprint
17.4.4. Revenue and Strategy
17.5. Cerillion
17.5.1. Business Overview
17.5.2. Product Portfolio
17.5.3. Geographical Footprint
17.5.4. Revenue and Strategy
17.6. Comarch SA
17.6.1. Business Overview
17.6.2. Product Portfolio
17.6.3. Geographical Footprint
17.6.4. Revenue and Strategy
17.7. Comviva Technologies Limited
17.7.1. Business Overview
17.7.2. Product Portfolio
17.7.3. Geographical Footprint
17.7.4. Revenue and Strategy
17.8. CSG Systems International, Inc.
17.8.1. Business Overview
17.8.2. Product Portfolio
17.8.3. Geographical Footprint
17.8.4. Revenue and Strategy
17.9. Telefonaktiebolaget LM Ericsson
17.9.1. Business Overview
17.9.2. Product Portfolio
17.9.3. Geographical Footprint
17.9.4. Revenue and Strategy
17.10. Huawei Technologies Co., Ltd.
17.10.1. Business Overview
17.10.2. Product Portfolio
17.10.3. Geographical Footprint
17.10.4. Revenue and Strategy
17.11. IBM Corporation
17.11.1. Business Overview
17.11.2. Product Portfolio
17.11.3. Geographical Footprint
17.11.4. Revenue and Strategy
17.12. Infosys Limited
17.12.1. Business Overview
17.12.2. Product Portfolio
17.12.3. Geographical Footprint
17.12.4. Revenue and Strategy
17.13. MDS Global
17.13.1. Business Overview
17.13.2. Product Portfolio
17.13.3. Geographical Footprint
17.13.4. Revenue and Strategy
17.14. Netcracker Technology Corporation
17.14.1. Business Overview
17.14.2. Product Portfolio
17.14.3. Geographical Footprint
17.14.4. Revenue and Strategy
17.15. Nokia Corporation
17.15.1. Business Overview
17.15.2. Product Portfolio
17.15.3. Geographical Footprint
17.15.4. Revenue and Strategy
17.16. Optiva, Inc.
17.16.1. Business Overview
17.16.2. Product Portfolio
17.16.3. Geographical Footprint
17.16.4. Revenue and Strategy
17.17. Oracle Corporation
17.17.1. Business Overview
17.17.2. Product Portfolio
17.17.3. Geographical Footprint
17.17.4. Revenue and Strategy
17.18. Sigma Systems, Inc.
17.18.1. Business Overview
17.18.2. Product Portfolio
17.18.3. Geographical Footprint
17.18.4. Revenue and Strategy
17.19. Stl.tech
17.19.1. Business Overview
17.19.2. Product Portfolio
17.19.3. Geographical Footprint
17.19.4. Revenue and Strategy
17.20. Tata Consultancy Services Limited
17.20.1. Business Overview
17.20.2. Product Portfolio
17.20.3. Geographical Footprint
17.20.4. Revenue and Strategy
17.21. ZTE Corporation
17.21.1. Business Overview
17.21.2. Product Portfolio
17.21.3. Geographical Footprint
17.21.4. Revenue and Strategy
18. Key Takeaways
List of Tables
Table 1: North America Digital BSS Market Revenue Analysis, by Country, 2021 - 2031 (US$ Mn)
Table 2: Europe Digital BSS Market Revenue Analysis, by Country, 2021 - 2031 (US$ Mn)
Table 3: Asia Pacific Digital BSS Market Revenue Analysis, by Country, 2021 - 2031 (US$ Mn)
Table 4: Middle East & Africa Digital BSS Market Revenue Analysis, by Country, 2021 and 2031 (US$ Mn)
Table 5: South America Digital BSS Market Revenue Analysis, by Country, 2021 - 2031 (US$ Mn)
Table 6: Forecast Factors: Relevance and Impact (1/2)
Table 7: Forecast Factors: Relevance and Impact (2/2)
Table 8: Impact Analysis of Drivers
Table 9: Mergers & Acquisitions, Expansions (1/4)
Table 10: Mergers & Acquisitions, Expansions (2/4)
Table 11: Mergers & Acquisitions, Expansions (3/4)
Table 12: Mergers & Acquisitions, Expansions (4/4)
Table 13: Global Digital BSS Market Value (US$ Mn) Forecast, by Component, 2018 – 2031
Table 14: Global Digital BSS Market Value (US$ Mn) Forecast, by Solution, by Component, 2018 – 2031
Table 15: Global Digital BSS Market Value (US$ Mn) Forecast, by Services, by Component, 2018 – 2031
Table 16: Global Digital BSS Market Value (US$ Mn) Forecast, by Deployment, 2018 – 2031
Table 17: Global Digital BSS Market Value (US$ Mn) Forecast, by Enterprise Size, 2018 – 2031
Table 18: Global Digital BSS Market Value (US$ Mn) Forecast, by Industry Vertical, 2018 – 2031
Table 19: Global Digital BSS Market Volume (US$ Mn) Forecast, by Region, 2018 – 2031
Table 20: North America Digital BSS Market Value (US$ Mn) Forecast, by Component, 2018 – 2031
Table 21: North America Digital BSS Market Value (US$ Mn) Forecast, by Solution, by Component, 2018 – 2031
Table 22: North America Digital BSS Market Value (US$ Mn) Forecast, by Services, by Component, 2018 – 2031
Table 23: North America Digital BSS Market Value (US$ Mn) Forecast, by Deployment, 2018 – 2031
Table 24: North America Digital BSS Market Value (US$ Mn) Forecast, by Enterprise Size, 2018 – 2031
Table 25: North America Digital BSS Market Value (US$ Mn) Forecast, by Industry Vertical, 2018 – 2031
Table 26: North America Digital BSS Market Value (US$ Mn) Forecast, by Country, 2018 - 2031
Table 27: U.S. Digital BSS Market Revenue CAGR Breakdown (%), by Growth Term
Table 28: Canada Digital BSS Market Revenue CAGR Breakdown (%), by Growth Term
Table 29: Mexico Digital BSS Market Revenue CAGR Breakdown (%), by Growth Term
Table 30: Europe Digital BSS Market Value (US$ Mn) Forecast, by Component, 2018 – 2031
Table 31: Europe Digital BSS Market Value (US$ Mn) Forecast, by Solution, by Component, 2018 – 2031
Table 32: Europe Digital BSS Market Value (US$ Mn) Forecast, by Services, by Component, 2018 – 2031
Table 33: Europe Digital BSS Market Value (US$ Mn) Forecast, by Deployment, 2018 – 2031
Table 34: Europe Digital BSS Market Value (US$ Mn) Forecast, by Enterprise Size, 2018 – 2031
Table 35: Europe Digital BSS Market Value (US$ Mn) Forecast, by Industry Vertical, 2018 – 2031
Table 36: Europe Digital BSS Market Value (US$ Mn) Forecast, by Country, 2018 - 2031
Table 37: Germany Digital BSS Market Revenue CAGR Breakdown (%), by Growth Term
Table 38: U.K. Digital BSS Market Revenue CAGR Breakdown (%), by Growth Term
Table 39: France Digital BSS Market Revenue CAGR Breakdown (%), by Growth Term
Table 40: Spain Digital BSS Market Revenue CAGR Breakdown (%), by Growth Term
Table 41: Italy Digital BSS Market Revenue CAGR Breakdown (%), by Growth Term
Table 42: Asia Pacific Digital BSS Market Value (US$ Mn) Forecast, by Component, 2018 – 2031
Table 43: Asia Pacific Digital BSS Market Value (US$ Mn) Forecast, by Solution, by Component, 2018 – 2031
Table 44: Asia Pacific Digital BSS Market Value (US$ Mn) Forecast, by Services, by Component, 2018 – 2031
Table 45: Asia Pacific Digital BSS Market Value (US$ Mn) Forecast, by Deployment, 2018 – 2031
Table 46: Asia Pacific Digital BSS Market Value (US$ Mn) Forecast, by Enterprise Size, 2018 – 2031
Table 47: Asia Pacific Digital BSS Market Value (US$ Mn) Forecast, by Industry Vertical, 2018 – 2031
Table 48: Asia Pacific Digital BSS Market Value (US$ Mn) Forecast, by Country, 2018 - 2031
Table 49: China Digital BSS Market Revenue CAGR Breakdown (%), by Growth Term
Table 50: India Digital BSS Market Revenue CAGR Breakdown (%), by Growth Term
Table 51: Japan Digital BSS Market Revenue CAGR Breakdown (%), by Growth Term
Table 52: ASEAN Digital BSS Market Revenue CAGR Breakdown (%), by Growth Term
Table 53: Middle East & Africa Digital BSS Market Value (US$ Mn) Forecast, by Component, 2018 – 2031
Table 54: Middle East & Africa Digital BSS Market Value (US$ Mn) Forecast, by Solution, by Component, 2018 – 2031
Table 55: Middle East & Africa Digital BSS Market Value (US$ Mn) Forecast, by Services, by Component, 2018 – 2031
Table 56: Middle East & Africa Digital BSS Market Value (US$ Mn) Forecast, by Deployment, 2018 – 2031
Table 57: Middle East & Africa Digital BSS Market Value (US$ Mn) Forecast, by Enterprise Size, 2018 – 2031
Table 58: Middle East & Africa Digital BSS Market Value (US$ Mn) Forecast, by Industry Vertical, 2018 – 2031
Table 59: Middle East & Africa Digital BSS Market Value (US$ Mn) Forecast, by Country, 2018 - 2031
Table 60: Saudi Arabia Digital BSS Market Revenue CAGR Breakdown (%), by Growth Term
Table 61: The United Arab Emirates Digital BSS Market Revenue CAGR Breakdown (%), by Growth Term
Table 62: South Africa Digital BSS Market Revenue CAGR Breakdown (%), by Growth Term
Table 63: South America Digital BSS Market Value (US$ Mn) Forecast, by Component, 2018 – 2031
Table 64: South America Digital BSS Market Value (US$ Mn) Forecast, by Solution, by Component, 2018 – 2031
Table 65: South America Digital BSS Market Value (US$ Mn) Forecast, by Services, by Component, 2018 – 2031
Table 66: South America Digital BSS Market Value (US$ Mn) Forecast, by Deployment, 2018 – 2031
Table 67: South America Digital BSS Market Value (US$ Mn) Forecast, by Enterprise Size, 2018 – 2031
Table 68: South America Digital BSS Market Value (US$ Mn) Forecast, by Industry Vertical, 2018 – 2031
Table 69: South America Digital BSS Market Value (US$ Mn) Forecast, by Country, 2018 - 2031
Table 70: Brazil Emirates Digital BSS Market Revenue CAGR Breakdown (%), by Growth Term
Table 71: Argentina Digital BSS Market Revenue CAGR Breakdown (%), by Growth Term
Table 72: Product Mapping (1/4)
Table 73: Product Mapping (2/4)
Table 74: Product Mapping (3/4)
Table 75: Product Mapping (4/4)
Table 76: Product Benchmark
Table 77: Acronyms Used in the Digital BSS Market
List of Figures
Figure 1: Global Digital BSS Market Size (US$ Mn) Forecast, 2018–2031
Figure 2: Global Digital BSS Market Revenue (US$ Mn) Opportunity Assessment, by Region, 2021E
Figure 3: Top Segment Analysis of Digital BSS Market
Figure 4: Global Digital BSS Market Revenue (US$ Mn) Opportunity Assessment, by Region, 2031F
Figure 5: Global Digital BSS Market Attractiveness Assessment, by Component
Figure 6: Global Digital BSS Market Attractiveness Assessment, by Deployment
Figure 7: Global Digital BSS Market Attractiveness Assessment, by Enterprise Size
Figure 8: Global Digital BSS Market Attractiveness Assessment, by Industry Vertical
Figure 9: Global Digital BSS Market Attractiveness Assessment, by Region
Figure 10: Global Digital BSS Market Revenue (US$ Mn) Historic Trends, 2016 - 2020
Figure 11: Global Digital BSS Market Revenue Opportunity (US$ Mn) Historic Trends, 2016 - 2020
Figure 12: Global Digital BSS Market Value Share Analysis, by Component, 2021
Figure 13: Global Digital BSS Market Value Share Analysis, by Component, 2031
Figure 14: Global Digital BSS Market Absolute Opportunity (US$ Mn), by Solution, 2021 – 2031
Figure 15: Global Digital BSS Market Absolute Opportunity (US$ Mn), by Services, 2021 – 2031
Figure 16: Global Digital BSS Market Value Share Analysis, by Deployment, 2021
Figure 17: Global Digital BSS Market Value Share Analysis, by Deployment, 2031
Figure 18: Global Digital BSS Market Absolute Opportunity (US$ Mn), by Public Cloud, 2021 – 2031
Figure 19: Global Digital BSS Market Absolute Opportunity (US$ Mn), by Private Cloud, 2021 – 2031
Figure 20: Global Digital BSS Market Absolute Opportunity (US$ Mn), by Hybrid Cloud, 2021 – 2031
Figure 21: Global Digital BSS Market Value Share Analysis, by Enterprise Size, 2021
Figure 22: Global Digital BSS Market Value Share Analysis, by Enterprise Size, 2031
Figure 23: Global Digital BSS Market Absolute Opportunity (US$ Mn), by Small and Medium Sized Enterprises, 2021 – 2031
Figure 24: Global Digital BSS Market Absolute Opportunity (US$ Mn), by Large Enterprises, 2021 – 2031
Figure 25: Global Digital BSS Market Value Share Analysis, by Industry Vertical, 2021
Figure 26: Global Digital BSS Market Value Share Analysis, by Industry Vertical, 2031
Figure 27: Global Digital BSS Market Absolute Opportunity (US$ Mn), by IT, 2021 – 2031
Figure 28: Global Digital BSS Market Absolute Opportunity (US$ Mn), by Communication, 2021 – 2031
Figure 29: Global Digital BSS Market Absolute Opportunity (US$ Mn), by BFSI, 2021 – 2031
Figure 30: Global Digital BSS Market Absolute Opportunity (US$ Mn), by Healthcare, 2021 – 2031
Figure 31: Global Digital BSS Market Absolute Opportunity (US$ Mn), by Utility, 2021 – 2031
Figure 32: Global Digital BSS Market Absolute Opportunity (US$ Mn), by Media and Entertainment, 2021 – 2031
Figure 33: Global Digital BSS Market Absolute Opportunity (US$ Mn), by Government, 2021 – 2031
Figure 34: Global Digital BSS Market Absolute Opportunity (US$ Mn), by Others, 2021 – 2031
Figure 35: Global Digital BSS Market Opportunity (US$ Mn), by Region
Figure 36: Global Digital BSS Market Opportunity Share (%), by Region, 2021–2031
Figure 37: Global Digital BSS Market Size (US$ Mn), by Region, 2021 & 2031
Figure 38: Global Digital BSS Market Value Share Analysis, by Region, 2021
Figure 39: Global Digital BSS Market Value Share Analysis, by Region, 2031
Figure 40: North America Digital BSS Market Absolute Opportunity (US$ Mn), 2021 – 2031
Figure 41: Europe Digital BSS Market Absolute Opportunity (US$ Mn), 2021 – 2031
Figure 42: Asia Pacific Digital BSS Market Absolute Opportunity (US$ Mn), 2021 – 2031
Figure 43: Middle East & Africa Digital BSS Market Absolute Opportunity (US$ Mn), 2021 – 2031
Figure 44: South America Digital BSS Market Absolute Opportunity (US$ Mn), 2021 – 2031
Figure 45: North America Digital BSS Revenue Opportunity Share, by Deployment
Figure 46: North America Digital BSS Revenue Opportunity Share, by Industry Vertical
Figure 47: North America Digital BSS Revenue Opportunity Share, by Component
Figure 48: North America Digital BSS Revenue Opportunity Share, by Enterprise Size
Figure 49: North America Digital BSS Market Value Share Analysis, by Component, 2021
Figure 50: North America Digital BSS Market Value Share Analysis, by Component, 2031
Figure 51: North America Digital BSS Market Absolute Opportunity (US$ Mn), by Solution, 2021 – 2031
Figure 52: North America Digital BSS Market Absolute Opportunity (US$ Mn), by Services, 2021 – 2031
Figure 53: North America Digital BSS Market Value Share Analysis, by Deployment, 2021
Figure 54: North America Digital BSS Market Value Share Analysis, by Deployment, 2031
Figure 55: North America Digital BSS Market Absolute Opportunity (US$ Mn), by Public Cloud, 2021 – 2031
Figure 56: North America Digital BSS Market Absolute Opportunity (US$ Mn), by Private Cloud, 2021 – 2031
Figure 57: North America Digital BSS Market Absolute Opportunity (US$ Mn), by Hybrid Cloud, 2021 – 2031
Figure 58: North America Digital BSS Market Value Share Analysis, by Enterprise Size, 2021
Figure 59: North America Digital BSS Market Value Share Analysis, by Enterprise Size, 2031
Figure 60: North America Digital BSS Market Absolute Opportunity (US$ Mn), by Small and Medium Sized Enterprises, 2021 – 2031
Figure 61: North America Digital BSS Market Absolute Opportunity (US$ Mn), by Large Enterprises, 2021 – 2031
Figure 62: North America Digital BSS Market Value Share Analysis, by Industry Vertical, 2021
Figure 63: North America Digital BSS Market Value Share Analysis, by Industry Vertical, 2031
Figure 64: North America Digital BSS Market Absolute Opportunity (US$ Mn), by IT, 2021 – 2031
Figure 65: North America Digital BSS Market Absolute Opportunity (US$ Mn), by Communication, 2021 – 2031
Figure 66: North America Digital BSS Market Absolute Opportunity (US$ Mn), by BFSI, 2021 – 2031
Figure 67: North America Digital BSS Market Absolute Opportunity (US$ Mn), by Healthcare, 2021 – 2031
Figure 68: North America Digital BSS Market Absolute Opportunity (US$ Mn), by Utility, 2021 – 2031
Figure 69: North America Digital BSS Market Absolute Opportunity (US$ Mn), by Media and Entertainment, 2021 – 2031
Figure 70: North America Digital BSS Market Absolute Opportunity (US$ Mn), by Government, 2021 – 2031
Figure 71: North America Digital BSS Market Absolute Opportunity (US$ Mn), by Others, 2021 – 2031
Figure 72: North America Digital BSS Market Value Share Analysis, by Country, 2021
Figure 73: North America Digital BSS Market Value Share Analysis, by Country, 2031
Figure 74: U.S. Digital BSS Market Opportunity Growth Analysis (US$ Mn) Forecast, 2021 – 2031
Figure 75: Canada Digital BSS Market Opportunity Growth Analysis (US$ Mn) Forecast, 2021 – 2031
Figure 76: Mexico Digital BSS Market Opportunity Growth Analysis (US$ Mn) Forecast, 2021 – 2031
Figure 77: Europe Digital BSS Revenue Opportunity Share, by Deployment
Figure 78: Europe Digital BSS Revenue Opportunity Share, by Industry Vertical
Figure 79: Europe Digital BSS Revenue Opportunity Share, by Component
Figure 80: Europe Digital BSS Revenue Opportunity Share, by Enterprise Size
Figure 81: Europe Digital BSS Market Value Share Analysis, by Component, 2021
Figure 82: Europe Digital BSS Market Value Share Analysis, by Component, 2031
Figure 83: Europe Digital BSS Market Absolute Opportunity (US$ Mn), by Solution, 2021 – 2031
Figure 84: Europe Digital BSS Market Absolute Opportunity (US$ Mn), by Services, 2021 – 2031
Figure 85: Europe Digital BSS Market Value Share Analysis, by Deployment, 2021
Figure 86: Europe Digital BSS Market Value Share Analysis, by Deployment, 2031
Figure 87: Europe Digital BSS Market Absolute Opportunity (US$ Mn), by Public Cloud, 2021 – 2031
Figure 88: Europe Digital BSS Market Absolute Opportunity (US$ Mn), by Private Cloud, 2021 – 2031
Figure 89: Europe Digital BSS Market Absolute Opportunity (US$ Mn), by Hybrid Cloud, 2021 – 2031
Figure 90: Europe Digital BSS Market Value Share Analysis, by Enterprise Size, 2021
Figure 91: Europe Digital BSS Market Value Share Analysis, by Enterprise Size, 2031
Figure 92: Europe Digital BSS Market Absolute Opportunity (US$ Mn), by Small and Medium Sized Enterprises, 2021 – 2031
Figure 93: Europe Digital BSS Market Absolute Opportunity (US$ Mn), by Large Enterprises, 2021 – 2031
Figure 94: Europe Digital BSS Market Value Share Analysis, by Industry Vertical, 2021
Figure 95: Europe Digital BSS Market Value Share Analysis, by Industry Vertical, 2031
Figure 96: Europe Digital BSS Market Absolute Opportunity (US$ Mn), by IT, 2021 – 2031
Figure 97: Europe Digital BSS Market Absolute Opportunity (US$ Mn), by Communication, 2021 – 2031
Figure 98: Europe Digital BSS Market Absolute Opportunity (US$ Mn), by BFSI, 2021 – 2031
Figure 99: Europe Digital BSS Market Absolute Opportunity (US$ Mn), by Healthcare, 2021 – 2031
Figure 100: Europe Digital BSS Market Absolute Opportunity (US$ Mn), by Utility, 2021 – 2031
Figure 101: Europe Digital BSS Market Absolute Opportunity (US$ Mn), by Media and Entertainment, 2021 – 2031
Figure 102: Europe Digital BSS Market Absolute Opportunity (US$ Mn), by Government, 2021 – 2031
Figure 103: Europe Digital BSS Market Absolute Opportunity (US$ Mn), by Others, 2021 – 2031
Figure 104: Europe Digital BSS Market Value Share Analysis, by Country, 2021
Figure 105: Europe Digital BSS Market Value Share Analysis, by Country, 2031
Figure 106: Germany Digital BSS Market Opportunity Growth Analysis (US$ Mn) Forecast, 2021 – 2031
Figure 107: U.K. Digital BSS Market Opportunity Growth Analysis (US$ Mn) Forecast, 2021 – 2031
Figure 108: France Digital BSS Market Opportunity Growth Analysis (US$ Mn) Forecast, 2021 – 2031
Figure 109: Spain Digital BSS Market Opportunity Growth Analysis (US$ Mn) Forecast, 2021 – 2031
Figure 110: Italy Digital BSS Market Opportunity Growth Analysis (US$ Mn) Forecast, 2021 – 2031
Figure 111: Asia Pacific Digital BSS Revenue Opportunity Share, by Deployment
Figure 112: Asia Pacific Digital BSS Revenue Opportunity Share, by Industry Vertical
Figure 113: Asia Pacific Digital BSS Revenue Opportunity Share, by Component
Figure 114: Asia Pacific Digital BSS Revenue Opportunity Share, by Enterprise Size
Figure 115: Asia Pacific Digital BSS Market Value Share Analysis, by Component, 2021
Figure 116: Asia Pacific Digital BSS Market Value Share Analysis, by Component, 2031
Figure 117: Asia Pacific Digital BSS Market Absolute Opportunity (US$ Mn), by Solution, 2021 – 2031
Figure 118: Asia Pacific Digital BSS Market Absolute Opportunity (US$ Mn), by Services, 2021 – 2031
Figure 119: Asia Pacific Digital BSS Market Value Share Analysis, by Deployment, 2021
Figure 120: Asia Pacific Digital BSS Market Value Share Analysis, by Deployment, 2031
Figure 121: Asia Pacific Digital BSS Market Absolute Opportunity (US$ Mn), by Public Cloud, 2021 – 2031
Figure 122: Asia Pacific Digital BSS Market Absolute Opportunity (US$ Mn), by Private Cloud, 2021 – 2031
Figure 123: Asia Pacific Digital BSS Market Absolute Opportunity (US$ Mn), by Hybrid Cloud, 2021 – 2031
Figure 124: Asia Pacific Digital BSS Market Value Share Analysis, by Enterprise Size, 2021
Figure 125: Asia Pacific Digital BSS Market Value Share Analysis, by Enterprise Size, 2031
Figure 126: Asia Pacific Digital BSS Market Absolute Opportunity (US$ Mn), by Small and Medium Sized Enterprises, 2021 – 2031
Figure 127: Asia Pacific Digital BSS Market Absolute Opportunity (US$ Mn), by Large Enterprises, 2021 – 2031
Figure 128: Asia Pacific Digital BSS Market Value Share Analysis, by Industry Vertical, 2021
Figure 129: Asia Pacific Digital BSS Market Value Share Analysis, by Industry Vertical, 2031
Figure 130: Asia Pacific Digital BSS Market Absolute Opportunity (US$ Mn), by IT, 2021 – 2031
Figure 131: Asia Pacific Digital BSS Market Absolute Opportunity (US$ Mn), by Communication, 2021 – 2031
Figure 132: Asia Pacific Digital BSS Market Absolute Opportunity (US$ Mn), by BFSI, 2021 – 2031
Figure 133: Asia Pacific Digital BSS Market Absolute Opportunity (US$ Mn), by Healthcare, 2021 – 2031
Figure 134: Asia Pacific Digital BSS Market Absolute Opportunity (US$ Mn), by Utility, 2021 – 2031
Figure 135: Asia Pacific Digital BSS Market Absolute Opportunity (US$ Mn), by Media and Entertainment, 2021 – 2031
Figure 136: Asia Pacific Digital BSS Market Absolute Opportunity (US$ Mn), by Government, 2021 – 2031
Figure 137: Asia Pacific Digital BSS Market Absolute Opportunity (US$ Mn), by Others, 2021 – 2031
Figure 138: Asia Pacific Digital BSS Market Value Share Analysis, by Country, 2021
Figure 139: Asia Pacific Digital BSS Market Value Share Analysis, by Country, 2031
Figure 140: China Digital BSS Market Opportunity Growth Analysis (US$ Mn) Forecast, 2021 – 2031
Figure 141: India Digital BSS Market Opportunity Growth Analysis (US$ Mn) Forecast, 2021 – 2031
Figure 142: Japan Digital BSS Market Opportunity Growth Analysis (US$ Mn) Forecast, 2021 – 2031
Figure 143: ASEAN Digital BSS Market Opportunity Growth Analysis (US$ Mn) Forecast, 2021 – 2031
Figure 144: Middle East & Africa Digital BSS Revenue Opportunity Share, by Deployment
Figure 145: Middle East & Africa Digital BSS Revenue Opportunity Share, by Industry Vertical
Figure 146: Middle East & Africa Digital BSS Revenue Opportunity Share, by Component
Figure 147: Middle East & Africa Digital BSS Revenue Opportunity Share, by Enterprise Size
Figure 148: Middle East & Africa Digital BSS Market Value Share Analysis, by Component, 2021
Figure 149: Middle East & Africa Digital BSS Market Value Share Analysis, by Component, 2031
Figure 150: Middle East & Africa Digital BSS Market Absolute Opportunity (US$ Mn), by Solution, 2021 – 2031
Figure 151: Middle East & Africa Digital BSS Market Absolute Opportunity (US$ Mn), by Services, 2021 – 2031
Figure 152: Middle East & Africa Digital BSS Market Value Share Analysis, by Deployment, 2021
Figure 153: Middle East & Africa Digital BSS Market Value Share Analysis, by Deployment, 2031
Figure 154: Middle East & Africa Digital BSS Market Absolute Opportunity (US$ Mn), by Public Cloud, 2021 – 2031
Figure 155: Middle East & Africa Digital BSS Market Absolute Opportunity (US$ Mn), by Private Cloud, 2021 – 2031
Figure 156: Middle East & Africa Digital BSS Market Absolute Opportunity (US$ Mn), by Hybrid Cloud, 2021 – 2031
Figure 157: Middle East & Africa Digital BSS Market Value Share Analysis, by Enterprise Size, 2021
Figure 158: Middle East & Africa Digital BSS Market Value Share Analysis, by Enterprise Size, 2031
Figure 159: Middle East & Africa Digital BSS Market Absolute Opportunity (US$ Mn), by Small and Medium Sized Enterprises, 2021 – 2031
Figure 160: Middle East & Africa Digital BSS Market Absolute Opportunity (US$ Mn), by Large Enterprises, 2021 – 2031
Figure 161: Middle East & Africa Digital BSS Market Value Share Analysis, by Industry Vertical, 2021
Figure 162: Middle East & Africa Digital BSS Market Value Share Analysis, by Industry Vertical, 2031
Figure 163: Middle East & Africa Digital BSS Market Absolute Opportunity (US$ Mn), by IT, 2021 – 2031
Figure 164: Middle East & Africa Digital BSS Market Absolute Opportunity (US$ Mn), by Communication, 2021 – 2031
Figure 165: Middle East & Africa Digital BSS Market Absolute Opportunity (US$ Mn), by BFSI, 2021 – 2031
Figure 166: Middle East & Africa Digital BSS Market Absolute Opportunity (US$ Mn), by Healthcare, 2021 – 2031
Figure 167: Middle East & Africa Digital BSS Market Absolute Opportunity (US$ Mn), by Utility, 2021 – 2031
Figure 168: Middle East & Africa Digital BSS Market Absolute Opportunity (US$ Mn), by Media and Entertainment, 2021 – 2031
Figure 169: Middle East & Africa Digital BSS Market Absolute Opportunity (US$ Mn), by Government, 2021 – 2031
Figure 170: Middle East & Africa Digital BSS Market Absolute Opportunity (US$ Mn), by Others, 2021 – 2031
Figure 171: Middle East & Africa Digital BSS Market Value Share Analysis, by Country, 2021
Figure 172: Middle East & Africa Digital BSS Market Value Share Analysis, by Country, 2031
Figure 173: Saudi Arabia Digital BSS Market Opportunity Growth Analysis (US$ Mn) Forecast, 2021 – 2031
Figure 174: The United Arab Emirates Digital BSS Market Opportunity Growth Analysis (US$ Mn) Forecast, 2021 – 2031
Figure 175: South Africa Digital BSS Market Opportunity Growth Analysis (US$ Mn) Forecast, 2021 – 2031
Figure 176: South America Digital BSS Revenue Opportunity Share, by Deployment
Figure 177: South America Digital BSS Revenue Opportunity Share, by Industry Vertical
Figure 178: South America Digital BSS Revenue Opportunity Share, by Component
Figure 179: South America Digital BSS Revenue Opportunity Share, by Enterprise Size
Figure 180: South America Digital BSS Market Value Share Analysis, by Component, 2021
Figure 181: South America Digital BSS Market Value Share Analysis, by Component, 2031
Figure 182: South America Digital BSS Market Absolute Opportunity (US$ Mn), by Solution, 2021 – 2031
Figure 183: South America Digital BSS Market Absolute Opportunity (US$ Mn), by Services, 2021 – 2031
Figure 184: South America Digital BSS Market Value Share Analysis, by Deployment, 2021
Figure 185: South America Digital BSS Market Value Share Analysis, by Deployment, 2031
Figure 186: South America Digital BSS Market Absolute Opportunity (US$ Mn), by Public Cloud, 2021 – 2031
Figure 187: South America Digital BSS Market Absolute Opportunity (US$ Mn), by Private Cloud, 2021 – 2031
Figure 188: South America Digital BSS Market Absolute Opportunity (US$ Mn), by Hybrid Cloud, 2021 – 2031
Figure 189: South America Digital BSS Market Value Share Analysis, by Enterprise Size, 2021
Figure 190: South America Digital BSS Market Value Share Analysis, by Enterprise Size, 2031
Figure 191: South America Digital BSS Market Absolute Opportunity (US$ Mn), by Small and Medium Sized Enterprises, 2021 – 2031
Figure 192: South America Digital BSS Market Absolute Opportunity (US$ Mn), by Large Enterprises, 2021 – 2031
Figure 193: South America Digital BSS Market Value Share Analysis, by Industry Vertical, 2021
Figure 194: South America Digital BSS Market Value Share Analysis, by Industry Vertical, 2031
Figure 195: South America Digital BSS Market Absolute Opportunity (US$ Mn), by IT, 2021 – 2031
Figure 196: South America Digital BSS Market Absolute Opportunity (US$ Mn), by Communication, 2021 – 2031
Figure 197: South America Digital BSS Market Absolute Opportunity (US$ Mn), by BFSI, 2021 – 2031
Figure 198: South America Digital BSS Market Absolute Opportunity (US$ Mn), by Healthcare, 2021 – 2031
Figure 199: South America Digital BSS Market Absolute Opportunity (US$ Mn), by Utility, 2021 – 2031
Figure 200: South America Digital BSS Market Absolute Opportunity (US$ Mn), by Media and Entertainment, 2021 – 2031
Figure 201: South America Digital BSS Market Absolute Opportunity (US$ Mn), by Government, 2021 – 2031
Figure 202: South America Digital BSS Market Absolute Opportunity (US$ Mn), by Others, 2021 – 2031
Figure 203: South America Digital BSS Market Value Share Analysis, by Country, 2021
Figure 204: South America Digital BSS Market Value Share Analysis, by Country, 2031
Figure 205: Brazil Digital BSS Market Opportunity Growth Analysis (US$ Mn) Forecast, 2021 – 2031
Figure 206: Argentina Digital BSS Market Opportunity Growth Analysis (US$ Mn) Forecast, 2021 – 2031
Copyright © Transparency Market Research, Inc. All Rights reserved
Trust Online

Digital BSS Market