
Reports
Reports
The growing popularity among numerous applications across a plethora of end-user industries may serve as a prominent growth factor for the defoamers market during the forecast period of 2018-2026. The major end-user industries of the defoamers market are paper and pulp, food and beverage, agrochemicals, water treatment, pharmaceuticals, metalworking, building and construction, chemical, and others. Defoamers are also known as antifoaming agents. They are chemical additives that help reduce foam formation in various processes across a variety of industries. The surface-active properties, viscosity and other characteristics may serve as a boon for the growth of the defoamers market during the forecast period.
The defoamers market has many aspects that can help the stakeholders design the future strategy of their business. Transparency Market Research presents the various aspects of the defoamers market such as competitive landscape, regional segmentation, latest trends, and others in a systematic manner to the stakeholders. Furthermore, the predictions are based on real-time data and extensive research. According to the analysts at Transparency Market Research, the defoamers market is anticipated to expand at a CAGR of 4.5% during the forecast period of 2018-2026. The defoamers market stood at US$ 7500.0 Mn in 2017.
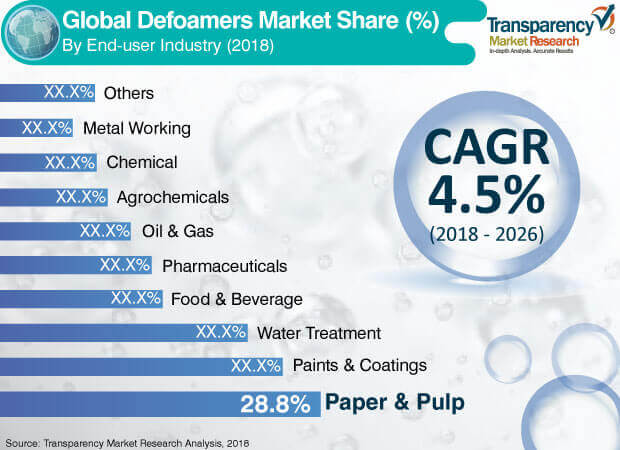
Defoamers are used on a large scale in the paper and pulp industry. Numerous types of defoamers such as water-based defoamers, silicone-based defoamers, oil-based defoamers, alkyl polyacrylates defoamers, and powder defoamers are used in the paper and pulp industry. Defoamers help in addressing issues related to entrained air and surface foam. Even though digitalization is gaining pace across the globe, the demand for paper has not receded. According to the statistics from Statista, nearly 422 Mn metric tons of paper were consumed worldwide in 2018. Thus, the rising demand for paper is estimated to increase the growth rate of the defoamers market to a great extent.
The pharmaceutical industry is gaining considerable traction over the years. The use of defoamers is increasing in the manufacturing process of ointments and drugs for optimum production efficiency. Thus, these factors bode well for the growth of the defoamers market.
Water and wastewater management has become an important factor across various regions around the world. The problem of water scarcity has increased extensively in many countries. Water and wastewater management plays a crucial role in saving water. The use of hydrocarbon-based defoamers in sewage treatment application may bring profitable growth avenues for the defoamers market.
The growing rural-to-urban migration across various countries, especially in developing economies and densely populated regions like India and China may churn out substantial growth opportunities for the defoamers market. Due to rising urbanization, an increase in residential and commercial buildings is being observed, which is ultimately expanding the demand for paints. As defoamers are used in paints, the growth trajectory is expected to be strengthened during the forecast period. In addition, the government bodies of numerous countries are introducing smart city initiatives. These factors may boost the demand for new constructions and infrastructure, eventually propelling the growth opportunities across the defoamers market.
The defoamers market is largely consolidated. A few well-established players are responsible for a large growth share. Medium or small-sized manufacturers in the defoamers market are either acquired or merged with key players for decreasing the competition. Furthermore, R&D activities are crucial for the growth of the defoamers market. The key players invest in these activities for propelling novel formulations and strategies.
Some well-entrenched players in the defoamers market are Shin-Etsu Chemical Co., Ltd., Wacker Chemie AG, Clariant International AG, Ashland Global Holdings Inc., Dow Corning Corporation, Momentive Performance Materials Inc., Evonik Industries AG, and BASF SE.
In 2017, Defoamers Market was valued at US$ 7500.0 Mn
Defoamers Market is estimated to rise at a CAGR of 4.5% during forecast period
Rising demand for paper is expected to drive the Defoamers Market
Asia Pacific is more attractive for vendors in the Defoamers Market
Key players of Defoamers Market are Shin-Etsu Chemical Co., Ltd., Wacker Chemie AG, Clariant International AG, Ashland Global Holdings Inc., Dow Corning Corporation, Momentive Performance Materials Inc., Evonik Industries AG, and BASF SE
1. Preface
1.1. Report Scope and Market Segmentation
1.2. Research Highlights
2. Assumptions and Research Methodology
2.1. Report Assumptions
2.2. Secondary Sources and Acronyms Used
3. Executive Summary
3.1. Market Snapshot, Global Defoamers Market
3.2. Market Outlook, Volume Share, 2017
3.3. Market Share, Global Defoamers Market, by End-user Industry
3.4. Key Trends
3.5. Estimated Production, by Region, 2017
3.6. Market Share, by Company, 2017
4. Market Overview
4.1. Market Overview
4.2. Key Industry Developments
4.3. Drivers and Restraints Snapshot Analysis
4.3.1. Drivers
4.3.2. Restraints
4.3.3. Opportunities
4.4. Global Defoamers Market Analysis and Forecast
4.5. Porter’s Analysis
4.5.1. Threat of Substitutes
4.5.2. Bargaining Power of Buyers
4.5.3. Bargaining Power of Suppliers
4.5.4. Threat of New Entrants
4.5.5. Degree of Competition
4.6. Value Chain Analysis
4.7. Regulatory Scenario
4.8. Key Customer Analysis
4.9. Defoamers Market: SWOT Analysis
5. Price Trend Analysis
5.1. Defoamers Market Price Trend Analysis, by Product
5.2. Defoamers Market Price Trend Analysis, by End-user Industry
5.3. Defoamers Market Price Trend Analysis, by Region
6. Demand-Supply Scenario
6.1. Defoamers Market: Demand-Supply Scenario
6.2. Production Output at Regional Level (2017)
7. Global Defoamers Market Analysis and Forecast, by Product
7.1. Introduction
7.2. Key Findings
7.3. Global Defoamers Market Volume Share Analysis, by Product, 2017 and 2026
7.4. Global Defoamers Market Forecast and Analysis, by Product, 2017–2026
7.4.1. Oil-based Defoamers Market Volume (Kilo Tons) and Value (US$ Mn) Forecast, 2017–2026
7.4.2. Water-based Defoamers Market Volume (Kilo Tons) and Value (US$ Mn) Forecast, 2017–2026
7.4.3. Silicone-based Defoamers Market Volume (Kilo Tons) and Value (US$ Mn) Forecast, 2017–2026
7.4.4. Others Market Volume (Kilo Tons) and Value (US$ Mn) Forecast, 2017–2026
7.5. Global Defoamers Market Attractiveness Analysis, by Product
8. Defoamers Market Analysis and Forecast, by End-user Industry
8.1. Introduction
8.2. Key Findings
8.3. Global Defoamers Market Volume Share Analysis, by End-user Industry, 2017 and 2026
8.4. Global Defoamers Market Forecast and Analysis, by End-user Industry, 2017–2026
8.4.1. Paper & Pulp Market Volume (Kilo Tons) and Value (US$ Mn) Forecast, 2017–2026
8.4.2. Water Treatment Market Volume (Kilo Tons) and Value (US$ Mn) Forecast, 2017–2026
8.4.3. Paints & Coatings Market Volume (Kilo Tons) and Value (US$ Mn) Forecast, 2017–2026
8.4.4. Food & Beverage Market Volume (Kilo Tons) and Value (US$ Mn) Forecast, 2017–2026
8.4.5. Oil & Gas Market Volume (Kilo Tons) and Value (US$ Mn) Forecast, 2017–2026
8.4.6. Agrochemicals Market Volume (Kilo Tons) and Value (US$ Mn) Forecast, 2017–2026
8.4.7. Pharmaceuticals Market Volume (Kilo Tons) and Value (US$ Mn) Forecast, 2017–2026
8.4.8. Chemical Market Volume (Kilo Tons) and Value (US$ Mn) Forecast, 2017–2026
8.4.9. Metal Working Market Volume (Kilo Tons) and Value (US$ Mn) Forecast, 2017–2026
8.4.10. Others Market Volume (Kilo Tons) and Value (US$ Mn) Forecast, 2017–2026
8.5. Global Defoamers Market Attractiveness Analysis, by End-user Industry
9. Global Defoamers Market Analysis and Forecast, by Region
9.1. Global Market Consumption (Kilo Tons) in 2017 and Growth Scenario, by Region
9.2. Key Findings
9.3. Global Defoamers Market Volume Share Analysis, by Region, 2017 and 2026
9.4. Global Defoamers Market Forecast, by Region, 2017–2026
9.4.1. North America
9.4.2. Latin America
9.4.3. Europe
9.4.4. Asia Pacific
9.4.5. Middle East and Africa
9.5. Global Defoamers Market Attractiveness Analysis, by Region
10. North America Defoamers Market Analysis and Forecast
10.1. Key Findings
10.2. North America Defoamers Market Overview
10.3. North America Defoamers Market Volume Share Analysis and Forecast, by Product, 2017 and 2026
10.4. North America Defoamers Market Volume (Kilo Tons) and Value (US$ Mn) Forecast, by Product, 2017–2026
10.4.1. Oil-based Defoamers
10.4.2. Water-based Defoamers
10.4.3. Silicone-based Defoamers
10.4.4. Others
10.5. North America Defoamers Market Volume Share Analysis and Forecast, by End-user Industry, 2017 and 2026
10.6. North America Defoamers Market Volume (Kilo Tons) and Value (US$ Mn) Forecast, by End-user Industry, 2017–2026
10.6.1. Paper & Pulp
10.6.2. Water Treatment
10.6.3. Paints & Coatings
10.6.4. Food & Beverage
10.6.5. Oil & Gas
10.6.6. Agrochemicals
10.6.7. Pharmaceuticals
10.6.8. Chemical
10.6.9. Metal Working
10.6.10. Others
10.7. North America Defoamers Market Volume Share Analysis and Forecast, by Country, 2017 and 2026
10.8. North America Defoamers Market Volume (Kilo Tons) and Value (US$ Mn) Forecast, by Country, 2017–2026
10.8.1. U.S. Defoamers Market Analysis
10.8.2. U.S. Defoamers Market Volume (Kilo Tons) and Value (US$ Mn) Forecast, by Product, 2017–2026
10.8.3. U.S. Defoamers Market Volume (Kilo Tons) and Value (US$ Mn) Forecast, by End-user Industry, 2017–2026
10.8.4. Canada Defoamers Market Analysis
10.8.5. Canada Defoamers Market Volume (Kilo Tons) and Value (US$ Mn) Forecast, by Product, 2017–2026
10.8.6. Canada Defoamers Market Volume (Kilo Tons) and Value (US$ Mn) Forecast, by End-user Industry, 2017–2026
10.8.7. North America Defoamers Market, Comparison Matrix, by Product
10.8.8. North America Defoamers Market, Comparison Matrix, by End-user Industry
11. Latin America Defoamers Market Analysis and Forecast
11.1. Key Findings
11.2. Latin America Defoamers Market Overview
11.3. Latin America - Market Trends
11.4. Latin America Defoamers Market Volume Share Analysis and Forecast, by Product, 2017 and 2026
11.5. Latin America Defoamers Market Volume (Kilo Tons) and Value (US$ Mn) Forecast, by Product, 2017–2026
11.5.1. Oil-based Defoamers
11.5.2. Water-based Defoamers
11.5.3. Silicone-based Defoamers
11.5.4. Others
11.6. Latin America Defoamers Market Volume Share Analysis and Forecast, by End-user Industry, 2017 and 2026
11.7. Latin America Defoamers Market Volume (Kilo Tons) and Value (US$ Mn) Forecast, by End-user Industry, 2017–2026
11.7.1. Paper & Pulp
11.7.2. Water Treatment
11.7.3. Paints & Coatings
11.7.4. Food & Beverage
11.7.5. Oil & Gas
11.7.6. Agrochemicals
11.7.7. Pharmaceuticals
11.7.8. Chemical
11.7.9. Metal Working
11.7.10. Others
11.8. Latin America Defoamers Market Volume Share Analysis and Forecast, by Country and Sub-region, 2017 and 2026
11.9. Latin America Defoamers Market Volume (Kilo Tons) and Value (US$ Mn) Forecast, by Country and Sub-region, 2017–2026
11.9.1. Brazil Defoamers Market Analysis
11.9.2. Brazil Defoamers Market Volume (Kilo Tons) and Value (US$ Mn) Forecast, by Product, 2017–2026
11.9.3. Brazil Defoamers Market Volume (Kilo Tons) and Value (US$ Mn) Forecast, by End-user Industry, 2017–2026
11.9.4. Mexico Defoamers Market Analysis
11.9.5. Mexico Defoamers Market Volume (Kilo Tons) and Value (US$ Mn) Forecast, by Product, 2017–2026
11.9.6. Mexico Defoamers Market Volume (Kilo Tons) and Value (US$ Mn) Forecast, by End-user Industry, 2017–2026
11.9.7. Rest of Latin America Defoamers Market Analysis
11.9.8. Rest of Latin America Defoamers Market Volume (Kilo Tons) and Value (US$ Mn) Forecast, by Product, 2017–2026
11.9.9. Rest of Latin America Defoamers Market Volume (Kilo Tons) and Value (US$ Mn) Forecast, by End-user Industry, 2017–2026
11.10. Latin America Defoamers Market, Comparison Matrix, by Product
11.11. Latin America Defoamers Market, Comparison Matrix, by End-user Industry
12. Europe Defoamers Market Analysis and Forecast
12.1. Key Findings
12.2. Europe Defoamers Market Overview
12.3. Europe - Market Trends
12.4. Europe Defoamers Market Volume Share Analysis and Forecast, by Product, 2017 and 2026
12.5. Europe Defoamers Market Volume (Kilo Tons) and Value (US$ Mn) Forecast, by Product, 2017–2026
12.5.1. Oil-based Defoamers
12.5.2. Water-based Defoamers
12.5.3. Silicone-based Defoamers
12.5.4. Others
12.6. Europe Defoamers Market Volume Share Analysis and Forecast, by End-user Industry, 2017 and 2026
12.7. Europe Defoamers Market Volume (Kilo Tons) and Value (US$ Mn) Forecast, by End-user Industry, 2017–2026
12.7.1. Paper & Pulp
12.7.2. Water Treatment
12.7.3. Paints & Coatings
12.7.4. Food & Beverage
12.7.5. Oil & Gas
12.7.6. Agrochemicals
12.7.7. Pharmaceuticals
12.7.8. Chemical
12.7.9. Metal Working
12.7.10. Others
12.8. Europe Defoamers Market Volume Share Analysis and Forecast, by Country and Sub-region, 2017 and 2026
12.9. Europe Defoamers Market Volume (Kilo Tons) and Value (US$ Mn) Forecast, by Country and Sub-region, 2017–2026
12.9.1. Germany Defoamers Market Analysis
12.9.2. Germany Defoamers Market Volume (Kilo Tons) and Value (US$ Mn) Forecast, by Product, 2017–2026
12.9.3. Germany Defoamers Market Volume (Kilo Tons) and Value (US$ Mn) Forecast, by End-user Industry, 2017–2026
12.9.4. France Defoamers Market Analysis
12.9.5. France Defoamers Market Volume (Kilo Tons) and Value (US$ Mn) Forecast, by Product, 2017–2026
12.9.6. France Defoamers Market Volume (Kilo Tons) and Value (US$ Mn) Forecast, by End-user Industry, 2017–2026
12.9.7. U.K. Defoamers Market Analysis
12.9.8. U.K. Defoamers Market Volume (Kilo Tons) and Value (US$ Mn) Forecast, by Product, 2017–2026
12.9.9. U.K. Defoamers Market Volume (Kilo Tons) and Value (US$ Mn) Forecast, by End-user Industry, 2017–2026
12.9.10. Spain Defoamers Market Analysis
12.9.11. Spain Defoamers Market Volume (Kilo Tons) and Value (US$ Mn) Forecast, by Product, 2017–2026
12.9.12. Spain Defoamers Market Volume (Kilo Tons) and Value (US$ Mn) Forecast, by End-user Industry, 2017–2026
12.9.13. Italy Defoamers Market Analysis
12.9.14. Italy Defoamers Market Volume (Kilo Tons) and Value (US$ Mn) Forecast, by Product, 2017–2026
12.9.15. Italy Defoamers Market Volume (Kilo Tons) and Value (US$ Mn) Forecast, by End-user Industry, 2017–2026
12.9.16. Rest of Europe Defoamers Market Analysis
12.9.17. Rest of Europe Defoamers Market Volume (Kilo Tons) and Value (US$ Mn) Forecast, by Product, 2017–2026
12.9.18. Rest of Europe Defoamers Market Volume (Kilo Tons) and Value (US$ Mn) Forecast, by End-user Industry, 2017–2026
12.10. Europe Defoamers Market, Comparison Matrix, by Product
12.11. Europe Defoamers Market, Comparison Matrix, by End-user Industry
13. Asia Pacific Defoamers Market Analysis and Forecast
13.1. Key Findings
13.2. Asia Pacific Defoamers Market Overview
13.3. Asia Pacific - Market Trends
13.4. Asia Pacific Defoamers Market Volume Share Analysis and Forecast, by Product, 2017 and 2026
13.5. Asia Pacific Defoamers Market Volume (Kilo Tons) and Value (US$ Mn) Forecast, by Product, 2017–2026
13.5.1. Oil-based Defoamers
13.5.2. Water-based Defoamers
13.5.3. Silicone-based Defoamers
13.5.4. Others
13.6. Asia Pacific Defoamers Market Volume Share Analysis and Forecast, by End-user Industry, 2017 and 2026
13.7. Asia Pacific Defoamers Market Volume (Kilo Tons) and Value (US$ Mn) Forecast, by End-user Industry, 2017–2026
13.7.1. Paper & Pulp
13.7.2. Water Treatment
13.7.3. Paints & Coatings
13.7.4. Food & Beverage
13.7.5. Oil & Gas
13.7.6. Agrochemicals
13.7.7. Pharmaceuticals
13.7.8. Chemical
13.7.9. Metal Working
13.7.10. Others
13.8. Asia Pacific Defoamers Market Volume Share Analysis and Forecast, by Country and Sub-region, 2017 and 2026
13.9. Asia Pacific Defoamers Market Volume (Kilo Tons) and Value (US$ Mn) Forecast, by Country and Sub-region, 2017–2026
13.9.1. China Defoamers Market Analysis
13.9.2. China Defoamers Market Volume (Kilo Tons) and Value (US$ Mn) Forecast, by Product, 2017–2026
13.9.3. China Defoamers Market Volume (Kilo Tons) and Value (US$ Mn) Forecast, by End-user Industry, 2017–2026
13.9.4. Japan Defoamers Market Analysis
13.9.5. Japan Defoamers Market Volume (Kilo Tons) and Value (US$ Mn) Forecast, by Product, 2017–2026
13.9.6. Japan Defoamers Market Volume (Kilo Tons) and Value (US$ Mn) Forecast, by End-user Industry, 2017–2026
13.9.7. India Defoamers Market Analysis
13.9.8. India Defoamers Market Volume (Kilo Tons) and Value (US$ Mn) Forecast, by Product, 2017–2026
13.9.9. India Defoamers Market Volume (Kilo Tons) and Value (US$ Mn) Forecast, by End-user Industry, 2017–2026
13.9.10. India - Market Trends
13.9.11. ASEAN Defoamers Market Analysis
13.9.12. ASEAN Defoamers Market Volume (Kilo Tons) and Value (US$ Mn) Forecast, by Product, 2017–2026
13.9.13. ASEAN Defoamers Market Volume (Kilo Tons) and Value (US$ Mn) Forecast, by End-user Industry, 2017–2026
13.9.14. Rest of Asia Pacific Defoamers Market Analysis
13.9.15. Rest of Asia Pacific Defoamers Market Volume (Kilo Tons) and Value (US$ Mn) Forecast, by Product, 2017–2026
13.9.16. Rest of Asia Pacific Defoamers Market Volume (Kilo Tons) and Value (US$ Mn) Forecast, by End-user Industry, 2017–2026
13.10. Asia Pacific Defoamers Market, Comparison Matrix, by Product
13.11. Asia Pacific Defoamers Market, Comparison Matrix, by End-user Industry
14. Middle East & Africa Defoamers Market Analysis and Forecast
14.1. Key Findings
14.2. Middle East & Africa Defoamers Market Overview
14.3. Middle East & Africa Defoamers Market Volume Share Analysis and Forecast, by Product, 2017 and 2026
14.4. Middle East & Africa Defoamers Market Volume (Kilo Tons) and Value (US$ Mn) Forecast, by Product, 2017–2026
14.4.1. Oil-based Defoamers
14.4.2. Water-based Defoamers
14.4.3. Silicone-based Defoamers
14.4.4. Others
14.5. Middle East & Africa Defoamers Market Volume Share Analysis and Forecast, by End-user Industry, 2017 and 2026
14.6. Middle East & Africa Defoamers Market Volume (Kilo Tons) and Value (US$ Mn) Forecast, by End-user Industry, 2017–2026
14.6.1. Paper & Pulp
14.6.2. Water Treatment
14.6.3. Paints & Coatings
14.6.4. Food & Beverage
14.6.5. Oil & Gas
14.6.6. Agrochemicals
14.6.7. Pharmaceuticals
14.6.8. Chemical
14.6.9. Metal Working
14.6.10. Others
14.7. Middle East & Africa Defoamers Market Volume Share Analysis and Forecast, by Country and Sub-region, 2017 and 2026
14.8. Middle East & Africa Defoamers Market Volume (Kilo Tons) and Value (US$ Mn) Forecast, by Country and Sub-region, 2017–2026
14.8.1. Saudi Arabia Defoamers Market Analysis
14.8.2. Saudi Arabia Defoamers Market Volume (Kilo Tons) and Value (US$ Mn) Forecast, by Product, 2017–2026
14.8.3. Saudi Arabia Defoamers Market Volume (Kilo Tons) and Value (US$ Mn) Forecast, by End-user Industry, 2017–2026
14.8.4. U.A.E. Defoamers Market Analysis
14.8.5. U.A.E. Defoamers Market Volume (Kilo Tons) and Value (US$ Mn) Forecast, by Product, 2017–2026
14.8.6. U.A.E. Defoamers Market Volume (Kilo Tons) and Value (US$ Mn) Forecast, by End-user Industry, 2017–2026
14.8.7. Qatar Defoamers Market Analysis
14.8.8. Qatar Defoamers Market Volume (Kilo Tons) and Value (US$ Mn) Forecast, by Product, 2017–2026
14.8.9. Qatar Defoamers Market Volume (Kilo Tons) and Value (US$ Mn) Forecast, by End-user Industry, 2017–2026
14.8.10. Iran Defoamers Market Analysis
14.8.11. Iran Defoamers Market Volume (Kilo Tons) and Value (US$ Mn) Forecast, by Product, 2017–2026
14.8.12. Iran Defoamers Market Volume (Kilo Tons) and Value (US$ Mn) Forecast, by End-user Industry, 2017–2026
14.8.13. Nigeria Defoamers Market Analysis
14.8.14. Nigeria Defoamers Market Volume (Kilo Tons) and Value (US$ Mn) Forecast, by Product, 2017–2026
14.8.15. Nigeria Defoamers Market Volume (Kilo Tons) and Value (US$ Mn) Forecast, by End-user Industry, 2017–2026
14.8.16. South Africa Defoamers Market Analysis
14.8.17. South Africa Defoamers Market Volume (Kilo Tons) and Value (US$ Mn) Forecast, by Product, 2017–2026
14.8.18. South Africa Defoamers Market Volume (Kilo Tons) and Value (US$ Mn) Forecast, by End-user Industry, 2017–2026
14.8.19. Rest of Middle East & Africa Defoamers Market Analysis
14.8.20. Rest of Middle East & Africa Defoamers Market Volume (Kilo Tons) and Value (US$ Mn) Forecast, by Product, 2017–2026
14.8.21. Rest of Middle East & Africa Defoamers Market Volume (Kilo Tons) and Value (US$ Mn) Forecast, by End-user Industry, 2017–2026
14.9. Middle East & Africa Defoamers Market, Comparison Matrix, by Product
14.10. Middle East & Africa Defoamers Market, Comparison Matrix, by End-user Industry
15. Competition Landscape
15.1. Defoamers Market Share Analysis, by Company (2017)
15.2. Competition Matrix
15.3. Product Mapping
15.4. Company Profiles
15.4.1. Wacker Chemie AG
15.4.1.1. Company Description
15.4.1.2. Business Overview
15.4.1.3. Financial Details
15.4.1.4. Strategic Overview
15.4.1.5. Product Details
15.4.2. Elkem Silicones
15.4.3. DyStar Group
15.4.4. BASF SE
15.4.5. Clariant International AG
15.4.6. Synalloy Corporation
15.4.7. Evonik Industries AG
15.4.8. Accepta Ltd
15.4.9. Kemira Oyj
15.4.10. Ashland Global Holdings Inc
15.4.11. Momentive Performance Materials Inc
15.4.12. Shin-Etsu Chemical Co., Ltd.
15.4.13. Innospec
15.4.14. Air Products and Chemicals, Inc.
15.4.15. Elementis plc
15.4.16. Cytec Solvay Group
15.4.17. Emerald Performance Materials
15.4.18. BRB International B.V.
15.4.19. PMC Group, Inc.
15.4.20. LEVACO Chemicals GmbH
15.4.21. Kurita Water Industries Ltd.
15.4.22. Siltech Corporation
15.4.23. San Nopco Limited
15.4.24. Magrabar, LLC
15.4.25. Buckman Laboratories International, Inc.
15.4.26. Rudolf GmbH
15.4.27. CHT Group
15.4.28. Nalco Champion (An Ecolab company)
15.4.29. Dow Corning Corporation
15.4.30. Arysta LifeScience Magyarország Kft.
15.4.31. Archroma Packaging & Paper Specialties
15.4.32. CIMCOOL Fluid Technology, LLC
15.4.33. Banmark Oy
15.4.34. FUCHS
15.4.35. MÜNZING CHEMIE GmbH
15.4.36. BIM Kemi AB
15.4.37. Harcros Chemicals Inc.
15.4.38. SIXIN North America, Inc.
15.4.39. King Industries, Inc.
15.4.40. KCC Basildon
15.4.41. Enterprise Specialty Products
15.4.42. Bussetti & Co GmbH
15.4.43. Houghton International Inc.
15.4.44. Organic Defoamer Group
15.4.45. Nanjing Huaxing Defoamer Co., Ltd.
15.4.46. Elkay Chemicals Private Limited
15.4.47. K. K. Chempro India Pvt Ltd
15.4.48. Om Tex Chem Private Limited
15.4.49. Resil Chemicals Pvt. Ltd
15.4.50. Supreme Silicones
15.4.51. BYK
16. Primary Research – Key Insights
List of Tables
Table 01: Average Price Range of Defoamers, by Product, US$/Ton, 2017–2026
Table 02: Price Range of Styrenic Defoamers for Medical Applications, by End-user Industry, US$/Ton, 2017–2026
Table 03: Price Trend of Defoamers, by Product and Region, US$/Ton, 2017
Table 04: Estimated Production of Defoamers at Regional Level (2017)
Table 05: Global Defoamers Market Volume (Kilo Tons) and Value (US$ Mn) Forecast, by Product, 2017–2026
Table 06: Global Defoamers Market Volume (Kilo Tons) Forecast, by End-user Industry, 2017–2026
Table 07: Global Defoamers Market Value (US$ Mn) Forecast, by End-user Industry, 2017–2026
Table 08: Global Defoamers Market Volume (Kilo Tons) and Value (US$ Mn) Forecast, by Region, 2017–2026
Table 09: North America Defoamers Market Volume (Kilo Tons) and Value (US$ Mn) Forecast, by Product, 2017–2026
Table 10: North America Defoamers Market Volume (Kilo Tons) Forecast, by End-user Industry, 2017–2026
Table 11: North America Defoamers Market Value (US$ Mn) Forecast, by End-user Industry, 2017–2026
Table 12: North America Defoamers Market Volume (Kilo Tons) and Value (US$ Mn) Forecast, by Country, 2017–2026
Table 13: U.S. Defoamers Market Volume (Kilo Tons) and Value (US$ Mn) Forecast, by Product, 2017–2026
Table 14: U.S. Defoamers Market Volume (Kilo Tons) Forecast, by End-user Industry, 2017–2026
Table 15: U.S. Defoamers Market Value (US$ Mn) Forecast, by End-user Industry, 2017–2026
Table 16: Canada Defoamers Market Volume (Kilo Tons) and Value (US$ Mn) Forecast, by Product, 2017–2026
Table 17: Canada Defoamers Market Volume (Kilo Tons) Forecast, by End-user Industry, 2017–2026
Table 18: Canada Defoamers Market Value (US$ Mn) Forecast, by End-user Industry, 2017–2026
Table 19: Latin America Defoamers Market Volume (Kilo Tons) and Value (US$ Mn) Forecast, by Product, 2017–2026
Table 20: Latin America Defoamers Market Volume (Kilo Tons) Forecast, by End-user Industry, 2017–2026
Table 21: Latin America Defoamers Market Value (US$ Mn) Forecast, by End-user Industry, 2017–2026
Table 22: Latin America Defoamers Market Volume (Kilo Tons) and Value (US$ Mn) Forecast, by Country and Sub-region, 2017–2026
Table 23: Brazil Defoamers Market Volume (Kilo Tons) and Value (US$ Mn) Forecast, by Product, 2017–2026
Table 24: Brazil Defoamers Market Volume (Kilo Tons) Forecast, by End-user Industry, 2017–2026
Table 25: Brazil Defoamers Market Value (US$ Mn) Forecast, by End-user Industry, 2017–2026
Table 26: Mexico Defoamers Market Volume (Kilo Tons) and Value (US$ Mn) Forecast, by Product, 2017–2026
Table 27: Mexico Defoamers Market Volume (Kilo Tons) Forecast, by End-user Industry, 2017–2026
Table 28: Mexico Defoamers Market Value (US$ Mn) Forecast, by End-user Industry, 2017–2026
Table 29: Rest of Latin America Defoamers Market Volume (Kilo Tons) and Value (US$ Mn) Forecast, by Product, 2017–2026
Table 30: Rest of Latin America Defoamers Market Volume (Kilo Tons) Forecast, by End-user Industry, 2017–2026
Table 31: Rest of Latin America Defoamers Market Value (US$ Mn) Forecast, by End-user Industry, 2017–2026
Table 32: Europe Defoamers Market Volume (Kilo Tons) and Value (US$ Mn) Forecast, by Product, 2017–2026
Table 33: Europe Defoamers Market Volume (Kilo Tons) Forecast, by End-user Industry, 2017–2026
Table 34: Europe Defoamers Market Value (US$ Mn) Forecast, by End-user Industry, 2017–2026
Table 35: Europe Defoamers Market Volume (Kilo Tons) Forecast, by Country and Sub-region, 2017–2026
Table 36: Europe Defoamers Market Volume Revenue (US$ Mn) Forecast, by Country and Sub-region, 2017–2026
Table 37: Germany Defoamers Market Volume (Kilo Tons) and Value (US$ Mn) Forecast, by Product, 2017–2026
Table 38: Germany Defoamers Market Volume (Kilo Tons) Forecast, by End-user Industry, 2017–2026
Table 39: Germany Defoamers Market Value (US$ Mn) Forecast, by End-user Industry, 2017–2026
Table 40: France Defoamers Market Volume (Kilo Tons) and Value (US$ Mn) Forecast, by Product, 2017–2026
Table 41: France Defoamers Market Volume (Kilo Tons) Forecast, by End-user Industry, 2017–2026
Table 42: France Defoamers Market Value (US$ Mn) Forecast, by End-user Industry, 2017–2026
Table 43: U.K. Defoamers Market Volume (Kilo Tons) and Value (US$ Mn) Forecast, by Product, 2017–2026
Table 44: U.K. Defoamers Market Volume (Kilo Tons) Forecast, by End-user Industry, 2017–2026
Table 45: U.K. Defoamers Market Value (US$ Mn) Forecast, by End-user Industry, 2017–2026
Table 46: Spain Defoamers Market Volume (Kilo Tons) and Value (US$ Mn) Forecast, by Product, 2017–2026
Table 47: Spain Defoamers Market Volume (Kilo Tons) Forecast, by End-user Industry, 2017–2026
Table 48: Spain Defoamers Market Value (US$ Mn) Forecast, by End-user Industry, 2017–2026
Table 49: Italy Defoamers Market Volume (Kilo Tons) and Value (US$ Mn) Forecast, by Product, 2017–2026
Table 50: Italy Defoamers Market Volume (Kilo Tons) Forecast, by End-user Industry, 2017–2026
Table 51: Italy Defoamers Market Value (US$ Mn) Forecast, by End-user Industry, 2017–2026
Table 52: Rest of Europe Defoamers Market Volume (Kilo Tons) and Value (US$ Mn) Forecast, by Product, 2017–2026
Table 53: Rest of Europe Defoamers Market Volume (Kilo Tons) Forecast, by End-user Industry, 2017–2026
Table 54: Rest of Europe Defoamers Market Value (US$ Mn) Forecast, by End-user Industry, 2017–2026
Table 55: Asia Pacific Defoamers Market Volume (Kilo Tons) and Value (US$ Mn) Forecast, by Product, 2017–2026
Table 56: Asia Pacific Defoamers Market Volume (Kilo Tons) Forecast, by End-user Industry, 2017–2026
Table 57: Asia Pacific Defoamers Market Value (US$ Mn) Forecast, by End-user Industry, 2017–2026
Table 58: Asia Pacific Defoamers Market Volume (Kilo Tons) and Value (US$ Mn) Forecast, by Country and Sub-region, 2017–2026
Table 60: China Defoamers Market Volume (Kilo Tons) and Value (US$ Mn) Forecast, by Product, 2017–2026
Table 61: China Defoamers Market Volume (Kilo Tons) Forecast, by End-user Industry, 2017–2026
Table 62: China Defoamers Market Value (US$ Mn) Forecast, by End-user Industry, 2017–2026
Table 63: Japan Defoamers Market Volume (Kilo Tons) and Value (US$ Mn) Forecast, by Product, 2017–2026
Table 64: Japan Defoamers Market Volume (Kilo Tons) Forecast, by End-user Industry, 2017–2026
Table 65: Japan Defoamers Market Value (US$ Mn) Forecast, by End-user Industry, 2017–2026
Table 66: India Defoamers Market Volume (Kilo Tons) and Value (US$ Mn) Forecast, by Product, 2017–2026
Table 67: India Defoamers Market Volume (Kilo Tons) Forecast, by End-user Industry, 2017–2026
Table 68: India Defoamers Market Value (US$ Mn) Forecast, by End-user Industry, 2017–2026
Table 69: ASEAN Defoamers Market Volume (Kilo Tons) and Value (US$ Mn) Forecast, by Product, 2017–2026
Table 70: ASEAN Defoamers Market Volume (Kilo Tons) Forecast, by End-user Industry, 2017–2026
Table 71: ASEAN Defoamers Market Value (US$ Mn) Forecast, by End-user Industry, 2017–2026
Table 72: Rest of Asia Pacific Defoamers Market Volume (Kilo Tons) and Value (US$ Mn) Forecast, by Product, 2017–2026
Table 73: Rest of Asia Pacific Defoamers Market Volume (Kilo Tons) Forecast, by End-user Industry, 2017–2026
Table 74: Rest of Asia Pacific Defoamers Market Value (US$ Mn) Forecast, by End-user industry, 2017–2026
Table 75: Middle East & Africa Defoamers Market Volume (Kilo Tons) and Value (US$ Mn) Forecast, by Product, 2017–2026
Table 76: Middle East & Africa Defoamers Market Volume (Kilo Tons) Forecast, by End-user Industry, 2017–2026
Table 77: Middle East & Africa Defoamers Market Value (US$ Mn) Forecast, by End-user Industry, 2017–2026
Table 78: Middle East & Africa Defoamers Market Volume (Kilo Tons) Forecast, by Country and Sub-region, 2017–2026
Table 79: Middle East & Africa Defoamers Market Volume Revenue (US$ Mn) Forecast, by Country and Sub-region, 2017–2026
Table 80: Saudi Arabia Defoamers Market Volume (Kilo Tons) and Value (US$ Mn) Forecast, by Product, 2017–2026
Table 81: Saudi Arabia Defoamers Market Volume (Kilo Tons) Forecast, by End-user Industry, 2017–2026
Table 82: Saudi Arabia Defoamers Market Value (US$ Mn) Forecast, by End-user Industry, 2017–2026
Table 83: UAE Defoamers Market Volume (Kilo Tons) and Value (US$ Mn) Forecast, by Product, 2017–2026
Table 84: UAE Defoamers Market Volume (Kilo Tons) Forecast, by End-user Industry, 2017–2026
Table 85: UAE Defoamers Market Value (US$ Mn) Forecast, by End-user Industry, 2017–2026
Table 86: Qatar Defoamers Market Volume (Kilo Tons) and Value (US$ Mn) Forecast, by Product, 2017–2026
Table 87: Qatar Defoamers Market Volume (Kilo Tons) Forecast, by End-user Industry, 2017–2026
Table 88: Qatar Defoamers Market Value (US$ Mn) Forecast, by End-user Industry, 2017–2026
Table 89: Iran Defoamers Market Volume (Kilo Tons) and Value (US$ Mn) Forecast, by Product, 2017–2026
Table 90: Iran Defoamers Market Volume (Kilo Tons) Forecast, by End-user Industry, 2017–2026
Table 91: Iran Defoamers Market Value (US$ Mn) Forecast, by End-user Industry, 2017–2026
Table 92: Nigeria Defoamers Market Volume (Kilo Tons) and Value (US$ Mn) Forecast, by Product, 2017–2026
Table 93: Nigeria Defoamers Market Volume (Kilo Tons) Forecast, by End-user Industry, 2017–2026
Table 94: Nigeria Defoamers Market Value (US$ Mn) Forecast, by End-user Industry, 2017–2026
Table 95: South Africa Defoamers Market Volume (Kilo Tons) and Value (US$ Mn) Forecast, by Product, 2017–2026
Table 96: South Africa Defoamers Market Volume (Kilo Tons) Forecast, by End-user Industry, 2017–2026
Table 97: South Africa Defoamers Market Value (US$ Mn) Forecast, by End-user Industry, 2017–2026
Table 98: Rest of Middle East & Africa Defoamers Market Volume (Kilo Tons) and Value (US$ Mn) Forecast, by Product, 2017–2026
Table 99: Rest of Middle East & Africa Defoamers Market Volume (Kilo Tons) Forecast, by End-user Industry, 2017–2026
Table 100: Rest of Middle East & Africa Defoamers Market Value (US$ Mn) Forecast, by End-user Industry, 2017–2026
List of Figures
Figure 01: Market Snapshot, Global Defoamers Market
Figure 02: Global Defoamers Market Volume Share, by Product, 2017
Figure 03: Global Defoamers Market Volume Share, by Region, 2017
Figure 04: Global Defoamers Market Volume Share, by End-user Industry, 2017
Figure 05: Market Snapshot, Global Defoamers Market, by End-user Industry, 2018 (E) and 2026 (F)
Figure 06: Estimated Production of Defoamers at Regional Level, 2017
Figure 07: Global Defoamers Market Share Analysis, by Company, 2017
Figure 08: Global Defoamers Market Volume (Kilo Tons) and Size (US$ Mn) Analysis, 2017–2026
Figure 09: Global Defoamers Market Size and Volume, Y-o-Y Growth Projection, 2017–2026
Figure 10: Price Trend of Defoamers, by Product and Region, US$/Ton, 2017
Figure 11: Estimated Production of Defoamers at Regional Level (2017), Kilo Tons
Figure 12: Global Defoamers Market Volume Share Analysis, by Product, 2017 and 2026
Figure 13: Global Defoamers Market Volume (Kilo Tons) and Value (US$ Mn) Analysis for Oil-based Defoamers, 2017–2026
Figure 14: Global Defoamers Market Volume (Kilo Tons) and Value (US$ Mn) Analysis for Water-based Defoamers, 2017–2026
Figure 15: Global Defoamers Market Volume (Kilo Tons) and Value (US$ Mn) Analysis for Silicone-based Defoamers, 2017–2026
Figure 16: Global Defoamers Market Volume (Kilo Tons) and Value (US$ Mn) Analysis for Other Defoamers, 2017–2026
Figure 17: Global Defoamers Market Attractiveness Analysis, by Product
Figure 18: Global Defoamers Market Volume Share Analysis, by End-user Industry, 2017 and 2026
Figure 19: Global Defoamers Market Volume (Kilo Tons) and Value (US$ Mn) Analysis for Paper & Pulp, 2017–2026
Figure 20: Global Defoamers Market Volume (Kilo Tons) and Value (US$ Mn) Analysis for Water Treatment, 2017–2026
Figure 21: Global Defoamers Market Volume (Kilo Tons) and Value (US$ Mn) Analysis for Paints & Coatings, 2017–2026
Figure 22: Global Defoamers Market Volume (Kilo Tons) and Value (US$ Mn) Analysis for Food & Beverage, 2017–2026
Figure 23: Global Defoamers Market Volume (Kilo Tons) and Value (US$ Mn) Analysis for Oil & Gas, 2017–2026
Figure 24: Global Defoamers Market Volume (Kilo Tons) and Value (US$ Mn) Analysis for Agrochemicals, 2017–2026
Figure 25: Global Defoamers Market Volume (Kilo Tons) and Value (US$ Mn) Analysis for Pharmaceuticals, 2017–2026
Figure 26: Global Defoamers Market Volume (Kilo Tons) and Value (US$ Mn) Analysis for Chemical, 2017–2026
Figure 27: Global Defoamers Market Volume (Kilo Tons) and Value (US$ Mn) Analysis for Metal working, 2017–2026
Figure 28: Global Defoamers Market Volume (Kilo Tons) and Value (US$ Mn) Analysis for Others, 2017–2026
Figure 29: Global Defoamers Market Attractiveness Analysis, by End-user Industry
Figure 30: Global Defoamers Market Volume Share Analysis, by Region, 2017 and 2026
Figure 31: Global Defoamers Market Attractiveness Analysis, by Region
Figure 32: North America Defoamers Market Size (US$ Mn) and Volume (Kilo Tons) Forecast, 2017–2026
Figure 33: North America Defoamers Market Attractiveness Analysis, by Country
Figure 34: North America Defoamers Market Volume Share Analysis, by Product, 2017 and 2026
Figure 35: North America Defoamers Market Volume Share Analysis, by End-user Industry, 2017 and 2026
Figure 36: North America Defoamers Market Volume Share Analysis, by Country, 2017 and 2026
Figure 37: U.S. Defoamers Market Volume (Kilo Tons) Forecast, 2017–2026
Figure 38: U.S. Defoamers Market Size (US$ Mn) Forecast, 2017–2026
Figure 39: Canada Defoamers Market Volume (Kilo Tons) Forecast, 2017–2026
Figure 40: Canada Defoamers Market Size (US$ Mn) Forecast, 2017–2026
Figure 41: Latin America Defoamers Market Size (US$ Mn) and Volume (Kilo Tons) Forecast, 2017–2026
Figure 42: Latin America Defoamers Market Attractiveness Analysis, by Country and Sub-region
Figure 43: Latin America Defoamers Market Volume Share Analysis, by Product, 2017 and 2026
Figure 44: Latin America Defoamers Market Volume Share Analysis, by End-user Industry, 2017 and 2026
Figure 45: Latin America Defoamers Market Volume Share Analysis, by Country and Sub-region, 2017 and 2026
Figure 46: Brazil Defoamers Market Volume (Kilo Tons) Forecast, 2017–2026
Figure 47: Brazil Defoamers Market Size (US$ Mn) Forecast, 2017–2026
Figure 48: Mexico Defoamers Market Volume (Kilo Tons) Forecast, 2017–2026
Figure 49: Mexico Defoamers Market Size (US$ Mn) Forecast, 2017–2026
Figure 50: Rest of Latin America Defoamers Market Volume (Kilo Tons) Forecast, 2017–2026
Figure 51: Rest of Latin America Defoamers Market Size (US$ Mn) Forecast, 2017–2026
Figure 52: Europe Defoamers Market Size (US$ Mn) and Volume (Kilo Tons) Forecast, 2017–2026
Figure 53: Europe Defoamers Market Attractiveness Analysis, by Country and Sub-region
Figure 54: Europe Defoamers Market Volume Share Analysis, by Product, 2017 and 2026
Figure 55: Europe Defoamers Market Volume Share Analysis, by End-user Industry, 2017 and 2026
Figure 56: Europe Defoamers Market Volume Share Analysis, by Country and Sub-region, 2017 and 2026
Figure 57: Germany Defoamers Market Volume (Kilo Tons) Forecast, 2017–2026
Figure 58: Germany Defoamers Market Size (US$ Mn) Forecast, 2017–2026
Figure 59: France Defoamers Market Volume (Kilo Tons) Forecast, 2017–2026
Figure 60: France Defoamers Market Size (US$ Mn) Forecast, 2017–2026
Figure 61: U.K. Defoamers Market Volume (Kilo Tons) Forecast, 2017–2026
Figure 62: U.K. Defoamers Market Size (US$ Mn) Forecast, 2017–2026
Figure 63: Spain Defoamers Market Volume (Kilo Tons) Forecast, 2017–2026
Figure 64: Spain Defoamers Market Size (US$ Mn) Forecast, 2017–2026
Figure 65: Italy Defoamers Market Volume (Kilo Tons) Forecast, 2017–2026
Figure 66: Italy Defoamers Market Size (US$ Mn) Forecast, 2017–2026
Figure 67: Rest of Europe Defoamers Market Volume (Kilo Tons) Forecast, 2017–2026
Figure 68: Rest of Europe Defoamers Market Size (US$ Mn) Forecast, 2017–2026
Figure 69: Asia Pacific Defoamers Market Size (US$ Mn) and Volume (Kilo Tons) Forecast, 2017–2026
Figure 70: Asia Pacific Defoamers Market Attractiveness Analysis, by Country and Sub-region
Figure 71: Asia Pacific Defoamers Market Volume Share Analysis, by Product, 2017 and 2026
Figure 72: Asia Pacific Defoamers Market Volume Share Analysis, by End-user Industry, 2017 and 2026
Figure 73: Asia Pacific Defoamers Market Volume Share Analysis, by Country and Sub-region, 2017 and 2026
Figure 74: China Defoamers Market Volume (Kilo Tons) Forecast, 2017–2026
Figure 75: China Defoamers Market Size (US$ Mn) Forecast, 2017–2026
Figure 76: Japan Defoamers Market Volume (Kilo Tons) Forecast, 2017–2026
Figure 77: Japan Defoamers Market Size (US$ Mn) Forecast, 2017–2026
Figure 78: India Defoamers Market Volume (Kilo Tons) Forecast, 2017–2026
Figure 79: India Defoamers Market Size (US$ Mn) Forecast, 2017–2026
Figure 80: ASEAN Defoamers Market Volume (Kilo Tons) Forecast, 2017–2026
Figure 81: ASEAN Defoamers Market Size (US$ Mn) Forecast, 2017–2026
Figure 82: Rest of Asia Pacific Defoamers Market Volume (Kilo Tons) Forecast, 2017–2026
Figure 83: Rest of Asia Pacific Defoamers Market Size (US$ Mn) Forecast, 2017–2026
Figure 84: Middle East & Africa Defoamers Market Size (US$ Mn) and Volume (Kilo Tons) Forecast, 2017–2026
Figure 85: Middle East & Africa Defoamers Market Attractiveness Analysis, by Country and Sub-region
Figure 86: Middle East & Africa Defoamers Market Volume Share Analysis, by Product, 2017 and 2026
Figure 87: Middle East & Africa Defoamers Market Volume Share Analysis, by End-user Industry, 2017 and 2026
Figure 88: Middle East & Africa Defoamers Market Volume Share Analysis, by Country and Sub-region, 2017 and 2026
Figure 89: Saudi Arabia Defoamers Market Volume (Kilo Tons) Forecast, 2017–2026
Figure 90: Saudi Arabia Defoamers Market Size (US$ Mn) Forecast, 2017–2026
Figure 91: UAE Defoamers Market Volume (Kilo Tons) Forecast, 2017–2026
Figure 92: UAE Defoamers Market Size (US$ Mn) Forecast, 2017–2026
Figure 93: Qatar Defoamers Market Volume (Kilo Tons) Forecast, 2017–2026
Figure 94: Qatar Defoamers Market Size (US$ Mn) Forecast, 2017–2026
Figure 95: Iran Defoamers Market Volume (Kilo Tons) Forecast, 2017–2026
Figure 96: Iran Defoamers Market Size (US$ Mn) Forecast, 2017–2026
Figure 97: Nigeria Defoamers Market Volume (Kilo Tons) Forecast, 2017–2026
Figure 98: Nigeria Defoamers Market Size (US$ Mn) Forecast, 2017–2026
Figure 99: South Africa Defoamers Market Volume (Kilo Tons) Forecast, 2017–2026
Figure 100: South Africa Defoamers Market Size (US$ Mn) Forecast, 2017–2026
Figure 101: Rest of Middle East & Africa Defoamers Market Volume (Kilo Tons) Forecast, 2017–2026
Figure 102: Rest of Middle East & Africa Defoamers Market Size (US$ Mn) Forecast, 2017–2026
Figure 103: Global Defoamers Market Share Analysis, by Company, 2017
Copyright © Transparency Market Research, Inc. All Rights reserved
Trust Online

Defoamers Market Insights, 2018-2026