
Reports
Reports
Analysts’ Viewpoint on Market Scenario
Rise in focus on protecting and organizing user data is driving the global data center rack market. Data center racks help organize electronic devices and provide proper airflow to avoid damage to the internal workings of the technology due to harsh temperatures. Blanking panels in data centers limit disfigurement in cords, wires, and other external components, owing to tangling or other forms of mistreatment. Increase in adoption of durable racks and surge in number of colocation and whitespace installations in data centers are expected to augment the market during the forecast period. Market players are developing advanced prefabricated modular data centers and modular data center infrastructure offerings to enhance their revenue streams.
Data center rack is a frame that is designed to house servers, cables, and other data center components. This physical steel and electronic framework allows for the placement and orchestration of devices within a data center facility. Data racks are used in IT & telecom, BFSI, manufacturing, and other industries. Individual mounting structures, such as colocation racks, are used to stack numerous hardware units and services on top of each other. They offer security, cooling, and ease in system troubleshooting.
Durable data center cabinets are primarily designed to house servers of various form factors such as rack-mounted servers and blade servers. They are also designed to hold other components including telecommunication equipment, networking equipment, cooling systems, and UPS. Each rack is generally prefabricated with slots for connecting electrical, networking, and internet cables. Data center server racks are built according to a systematic design and classified based on their capacity or number of bays.
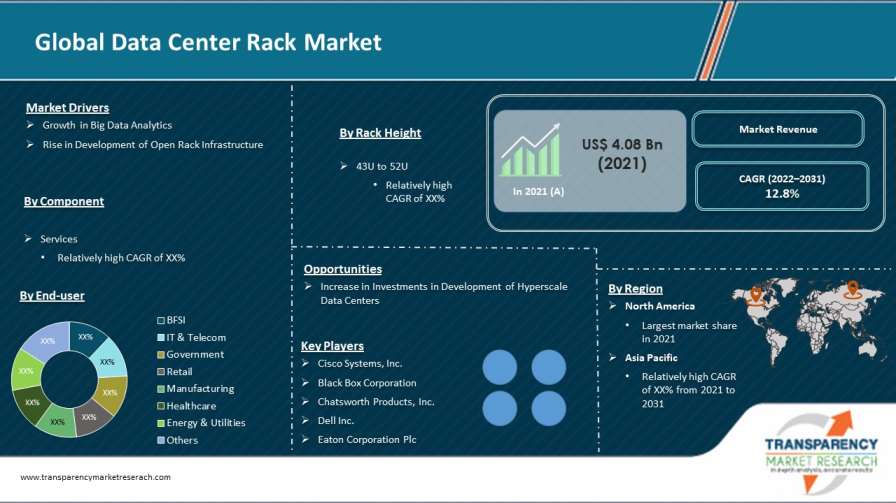
Big data analytics has been witnessing rapid growth over the last few years, owing to technological advancements in various industries. Big data primarily refers to digital data in the form of texts, geometries, images, videos, and sounds. Data can be collected from several sources such as sensors, digitizers, scanners, numerical modeling, mobile phones, internet, videos, e-mails, and social networks. Big data sources are likely to send massive amounts of data to data centers, thereby increasing inbound bandwidth requirements.
Big data analytics help manage complex and unstructured organizational data collected from numerous sources, which is processed across multiple data centers. Thus, organizations across the globe are investing in new data centers to store and monitor the collected data. Data centers were previously designed to store rational data. However, data centers with larger capacities are now required to store unstructured and structured data in large volumes. Hence, the data center network infrastructure must be modified or upgraded to accommodate the increase in volume and velocity of data. These opportunities are expected to accelerate advancements in data center storage hardware and network infrastructure; and boost the deployment of innovative methods to manage data centers with big data loads. Thus, an increase in organised and unorganised data traffic is expected to propel the data centre rack market share during the forecast period.
Expansion in the IT infrastructure of various industry verticals generates considerable amounts of structured and unstructured data. This creates the need for the development of hyperscale data centers to store and secure the generated data with high-security services. Adoption of cloud-based applications and services by IBM, Amazon, Google, and Microsoft helps generate a significant amount of data. This results in the replacement of traditional public cloud data centers with hyperscale data centers to focus on improving their data storage capability. Increase in usage of smartphones, social media websites, and OTT platforms is also generating large volume of data, thereby augmenting the demand for large-sized data centers.
Governments across the globe are increasingly investing in the development of hyperscale data center infrastructure to address rise in consumer and corporate demand for digital services. Increase in penetration of advanced technologies such as IoT, AI, and ML in different industries further generates a large amount of data that requires hyperscale data centers for storage. Thus, growth in investments in the development of hyperscale data centers is fueling the data center rack industry.
North America is expected to hold prominent share of the global market by the end of 2022, owing to the increase in development of IT infrastructure as per customer needs of data storage and maintenance. Presence of a large number of IT & telecom companies in countries such as the U.S. and Canada helps increase the deployment of data centers and their services in the region.
The market size in Asia Pacific is expected to grow significantly during the forecast period due to the expansion of the IT sector in the region. The data center rack market in Europe is expected to generate a revenue of US$ 1.74 Bn by 2031, advancing at a CAGR of 11.3% during the forecast period. The market in South America and Middle East & Africa is driven by the increase in adoption of hybrid cloud solutions and usage of interconnected solutions with the help of colocation services.
The global market is consolidated, with a few large-scale vendors controlling majority of the share. Most of the firms are investing significantly in comprehensive research and development activities. Expansion of product portfolios and mergers and acquisitions are key strategies adopted by prominent players. Cisco Systems, Inc., Black Box Corporation, Chatsworth Products, Inc., Dell Inc., Eaton Corporation Plc, Fujitsu Limited, IBM Corporation, Huawei Technologies Co., Ltd., Hewlett Packard Enterprise Development LP, Legrand SA, Oracle Corporation, Rittal GmbH & Co. KG, Schneider Electric SE, Belden Inc., and Vertiv Group Corp. are major entities operating in this market.
Each of these players has been profiled in the data center rack market report based on parameters such as company overview, financial overview, business strategies, product portfolio, business segments, and recent developments.
|
Attribute |
Detail |
|
Market Size (Value) in 2021 |
US$ 4.08 Bn |
|
Market Forecast Value in 2031 |
US$ 13.52 Bn |
|
Growth Rate (CAGR) |
12.8% |
|
Forecast Period |
2022–2031 |
|
Historical Data Available |
2017–2020 |
|
Quantitative Units |
US$ Bn for Value and Million Units for Volume |
|
Market Analysis |
Includes cross-segment analysis at global as well as regional level. Furthermore, qualitative analysis includes drivers, restraints, opportunities, key trends, Porter’s Five Forces analysis, value chain analysis, and key trend analysis. |
|
Competition Landscape |
|
|
Format |
Electronic (PDF) + Excel |
|
Market Segmentation |
|
|
Regions Covered |
|
|
Countries Covered |
|
|
Companies Profiled |
|
|
Customization Scope |
Available upon request |
|
Pricing |
Available upon request |
The market is expected to reach US$ 13.52 Bn by 2031
It is expected to expand at a CAGR of 12.8% during the forecast period
Growth in big data analytics and rise in development of open rack infrastructure
North America is a more attractive region for vendors in the global market
Cisco Systems, Inc., Black Box Corporation, Chatsworth Products, Inc., Dell Inc., Eaton Corporation Plc, Fujitsu Limited, IBM Corporation, Huawei Technologies Co., Ltd., Hewlett Packard Enterprise Development LP, Legrand SA, Oracle Corporation, Rittal GmbH & Co. KG, Schneider Electric SE, Belden Inc., and Vertiv Group Corp.
1. Preface
1.1. Market Introduction
1.2. Market Segmentation
1.3. Key Research Objectives
2. Assumptions and Research Methodology
2.1. Research Methodology
2.1.1. List of Primary and Secondary Sources
2.2. Key Assumptions for Data Modelling
3. Executive Summary: Global Data Center Rack Market
4. Market Overview
4.1. Market Definition
4.2. Technology/ Product Roadmap
4.3. Market Factor Analysis
4.3.1. Forecast Factors
4.3.2. Ecosystem/ Value Chain Analysis
4.3.3. Market Dynamics (Growth Influencers)
4.3.3.1. Drivers
4.3.3.2. Restraints
4.3.3.3. Opportunities
4.3.3.4. Impact Analysis of Drivers and Restraints
4.4. COVID-19 Impact Analysis
4.4.1. Impact of COVID-19 on Data Center Rack Market
4.4.2. End-user Sentiment Analysis: Comparative Analysis on Spending
4.4.2.1. Increase in Spending
4.4.2.2. Decrease in Spending
4.4.3. Short Term and Long Term Impact on the Market
4.5. Market Opportunity Assessment – by Region (North America/ Europe/ Asia Pacific/ Middle East and Africa/ South America)
4.5.1. By Component
4.5.2. By Rack Height
4.5.3. By End-user
5. Global Data Center Rack Market Analysis and Forecast
5.1. Market Revenue Analysis (US$ Mn), 2016-2031
5.1.1. Historic Growth Trends, 2016-2021
5.1.2. Forecast Trends, 2022-2031
5.2. Market Volume Analysis (Million Units), 2016-2031
5.2.1. Historic Growth Trends, 2016-2021
5.2.2. Forecast Trends, 2022-2031
5.3. Pricing Model Analysis/ Price Trend Analysis
6. Global Data Center Rack Market Analysis, by Component
6.1. Overview and Definitions
6.2. Key Segment Analysis
6.3. Data Center Rack Market Size (US$ Mn) Forecast, by Component, 2018 - 2031
6.3.1. Solution (Rack)
6.3.2. Services (Design, Installation, Support & Maintenance)
7. Global Data Center Rack Market Analysis, by Rack Height
7.1. Overview and Definitions
7.2. Key Segment Analysis
7.3. Data Center Rack Market Size (US$ Mn) Forecast, by Rack Height, 2018 - 2031
7.3.1. Below 42U
7.3.2. 43U to 52U
7.3.3. Above 52U
8. Global Data Center Rack Market Analysis, by End-user
8.1. Key Segment Analysis
8.2. Data Center Rack Market Size (US$ Mn) Forecast, by End-user, 2018 - 2031
8.2.1. BFSI
8.2.2. IT and Telecom
8.2.3. Government
8.2.4. Retail
8.2.5. Manufacturing
8.2.6. Healthcare
8.2.7. Energy and Utilities
8.2.8. Others
9. Global Data Center Rack Market Analysis and Forecasts, by Region
9.1. Key Findings
9.2. Market Size (US$ Mn) Forecast by Region, 2018-2031
9.2.1. North America
9.2.2. Europe
9.2.3. Asia Pacific
9.2.4. Middle East & Africa
9.2.5. South America
10. North America Data Center Rack Market Analysis and Forecast
10.1. Regional Outlook
10.2. Data Center Rack Market Size (US$ Mn) Analysis and Forecast, 2018 - 2031
10.2.1. By Component
10.2.2. By Rack Height
10.2.3. By End-user
10.3. Data Center Rack Market Size (US$ Mn) Forecast, by Country, 2018 - 2031
10.3.1. U.S.
10.3.2. Canada
10.3.3. Mexico
11. Europe Data Center Rack Market Analysis and Forecast
11.1. Regional Outlook
11.2. Data Center Rack Market Size (US$ Mn) Analysis and Forecast, 2018 - 2031
11.2.1. By Component
11.2.2. By Rack Height
11.2.3. By End-user
11.3. Data Center Rack Market Size (US$ Mn) Forecast, by Country, 2018 - 2031
11.3.1. Germany
11.3.2. UK
11.3.3. France
11.3.4. Italy
11.3.5. Spain
11.3.6. Rest of Europe
12. Asia Pacific Data Center Rack Market Analysis and Forecast
12.1. Regional Outlook
12.2. Data Center Rack Market Size (US$ Mn) Analysis and Forecast, 2018 - 2031
12.2.1. By Component
12.2.2. By Rack Height
12.2.3. By End-user
12.3. Data Center Rack Market Size (US$ Mn) Forecast, by Country, 2018 - 2031
12.3.1. China
12.3.2. India
12.3.3. Japan
12.3.4. ASEAN
12.3.5. Rest of Asia Pacific
13. Middle East & Africa Data Center Rack Market Analysis and Forecast
13.1. Regional Outlook
13.2. Data Center Rack Market Size (US$ Mn) Analysis and Forecast, 2018 - 2031
13.2.1. By Component
13.2.2. By Rack Height
13.2.3. By End-user
13.3. Data Center Rack Market Size (US$ Mn) Forecast, by Country, 2018 - 2031
13.3.1. Saudi Arabia
13.3.2. United Arab Emirates
13.3.3. South Africa
13.3.4. Rest of Middle East & Africa
14. South America Data Center Rack Market Analysis and Forecast
14.1. Regional Outlook
14.2. Data Center Rack Market Size (US$ Mn) Analysis and Forecast, 2018 - 2031
14.2.1. By Component
14.2.2. By Rack Height
14.2.3. By End-user
14.3. Data Center Rack Market Size (US$ Mn) Forecast, by Country, 2018 - 2031
14.3.1. Brazil
14.3.2. Argentina
14.3.3. Rest of South America
15. Competition Landscape
15.1. Market Competition Matrix, by Leading Players
15.2. Market Revenue Share Analysis (%), by Leading Players (2021)
15.3. List of Data Center Rack Manufacturers and Distributors
15.4. Competitive Scenario
15.4.1. List of Emerging, Prominent and Leading Players
15.4.2. Major Mergers & Acquisitions, Expansions, Partnership, Contacts, Deals, etc.
16. Company Profiles
16.1. Cisco Systems, Inc.
16.1.1. Business Overview
16.1.2. Company Revenue
16.1.3. Product Portfolio
16.1.4. Geographic Footprint
16.1.5. Strategic Partnership, Merger & Acquisition, Business Expansion, New Product Launch, Innovation, etc.
16.2. Black Box Corporation
16.2.1. Business Overview
16.2.2. Company Revenue
16.2.3. Product Portfolio
16.2.4. Geographic Footprint
16.2.5. Strategic Partnership, Merger & Acquisition, Business Expansion, New Product Launch, Innovation, etc.
16.3. Chatsworth Products, Inc.
16.3.1. Business Overview
16.3.2. Company Revenue
16.3.3. Product Portfolio
16.3.4. Geographic Footprint
16.3.5. Strategic Partnership, Merger & Acquisition, Business Expansion, New Product Launch, Innovation, etc.
16.4. Dell Inc.
16.4.1. Business Overview
16.4.2. Company Revenue
16.4.3. Product Portfolio
16.4.4. Geographic Footprint
16.4.5. Strategic Partnership, Merger & Acquisition, Business Expansion, New Product Launch, Innovation, etc.
16.5. Eaton Corporation Plc
16.5.1. Business Overview
16.5.2. Company Revenue
16.5.3. Product Portfolio
16.5.4. Geographic Footprint
16.5.5. Strategic Partnership, Merger & Acquisition, Business Expansion, New Product Launch, Innovation, etc.
16.6. Fujitsu Limited
16.6.1. Business Overview
16.6.2. Company Revenue
16.6.3. Product Portfolio
16.6.4. Geographic Footprint
16.6.5. Strategic Partnership, Merger & Acquisition, Business Expansion, New Product Launch, Innovation, etc.
16.7. IBM Corporation
16.7.1. Business Overview
16.7.2. Company Revenue
16.7.3. Product Portfolio
16.7.4. Geographic Footprint
16.7.5. Strategic Partnership, Merger & Acquisition, Business Expansion, New Product Launch, Innovation, etc.
16.8. Huawei Technologies Co., Ltd.
16.8.1. Business Overview
16.8.2. Company Revenue
16.8.3. Product Portfolio
16.8.4. Geographic Footprint
16.8.5. Strategic Partnership, Merger & Acquisition, Business Expansion, New Product Launch, Innovation, etc.
16.9. Hewlett Packard Enterprise Development LP
16.9.1. Business Overview
16.9.2. Company Revenue
16.9.3. Product Portfolio
16.9.4. Geographic Footprint
16.9.5. Strategic Partnership, Merger & Acquisition, Business Expansion, New Product Launch, Innovation, etc.
16.10. Legrand SA
16.10.1. Business Overview
16.10.2. Company Revenue
16.10.3. Product Portfolio
16.10.4. Geographic Footprint
16.10.5. Strategic Partnership, Merger & Acquisition, Business Expansion, New Product Launch, Innovation, etc.
16.11. Oracle Corporation
16.11.1. Business Overview
16.11.2. Company Revenue
16.11.3. Product Portfolio
16.11.4. Geographic Footprint
16.11.5. Strategic Partnership, Merger & Acquisition, Business Expansion, New Product Launch, Innovation, etc.
16.12. Rittal GmbH & Co. KG
16.12.1. Business Overview
16.12.2. Company Revenue
16.12.3. Product Portfolio
16.12.4. Geographic Footprint
16.12.5. Strategic Partnership, Merger & Acquisition, Business Expansion, New Product Launch, Innovation, etc.
16.13. Schneider Electric SE
16.13.1. Business Overview
16.13.2. Company Revenue
16.13.3. Product Portfolio
16.13.4. Geographic Footprint
16.13.5. Strategic Partnership, Merger & Acquisition, Business Expansion, New Product Launch, Innovation, etc.
16.14. Belden Inc.
16.14.1. Business Overview
16.14.2. Company Revenue
16.14.3. Product Portfolio
16.14.4. Geographic Footprint
16.14.5. Strategic Partnership, Merger & Acquisition, Business Expansion, New Product Launch, Innovation, etc.
16.15. Vertiv Group Corp.
16.15.1. Business Overview
16.15.2. Company Revenue
16.15.3. Product Portfolio
16.15.4. Geographic Footprint
16.15.5. Strategic Partnership, Merger & Acquisition, Business Expansion, New Product Launch, Innovation, etc.
16.16. Others
17. Key Takeaways
List of Tables
Table 1: Acronyms Used in the Data Center Rack Market
Table 2: North America Data Center Rack Market Revenue Analysis, by Country, 2022 - 2031 (US$ Mn)
Table 3: Europe Data Center Rack Market Revenue Analysis, by Country, 2022 - 2031 (US$ Mn)
Table 4: Asia Pacific Data Center Rack Market Revenue Analysis, by Country, 2022 - 2031 (US$ Mn)
Table 5: Middle East & Africa Data Center Rack Market Revenue Analysis, by Country, 2021 and 2031 (US$ Mn)
Table 6: South America Data Center Rack Market Revenue Analysis, by Country, 2022 - 2031 (US$ Mn)
Table 7: Forecast Factors: Relevance and Impact (1/2)
Table 8: Forecast Factors: Relevance and Impact (2/2)
Table 9: Impact Analysis of Drivers & Restraints
Table 10: List of Companies, Visits Per Minute (VPM), Features, and Pricing
Table 11: List of Companies, Visits Per Minute (VPM), Features, and Pricing
Table 12: Global Data Center Rack Market Value (US$ Mn) Forecast, by Component, 2018 – 2031
Table 13: Global Data Center Rack Market Value (US$ Mn) Forecast, by Rack Height, 2018 – 2031
Table 14: Global Data Center Rack Market Value (US$ Mn) Forecast, by End-user, 2018 – 2031
Table 15: Global Data Center Rack Market Volume (US$ Mn) Forecast, by Region, 2018 - 2031
Table 16: North America Data Center Rack Market Value (US$ Mn) Forecast, by Component, 2018 – 2031
Table 17: North America Data Center Rack Market Value (US$ Mn) Forecast, by Rack Height, 2018 – 2031
Table 18: North America Data Center Rack Market Value (US$ Mn) Forecast, by End-user, 2018 – 2031
Table 19: North America Data Center Rack Market Value (US$ Mn) Forecast, by Country, 2018 - 2031
Table 20: U.S. Data Center Rack Market Revenue CAGR Breakdown (%), by Growth Term
Table 21: Canada Data Center Rack Market Revenue CAGR Breakdown (%), by Growth Term
Table 22: Mexico Data Center Rack Market Revenue CAGR Breakdown (%), by Growth Term
Table 23: Europe Data Center Rack Market Value (US$ Mn) Forecast, by Component, 2018 – 2031
Table 24: Europe Data Center Rack Market Value (US$ Mn) Forecast, by Rack Height, 2018 – 2031
Table 25: Europe Data Center Rack Market Value (US$ Mn) Forecast, by End-user, 2018 – 2031
Table 26: Europe Data Center Rack Market Value (US$ Mn) Forecast, by Country, 2018 - 2031
Table 27: Germany Data Center Rack Market Revenue CAGR Breakdown (%), by Growth Term
Table 28: UK Data Center Rack Market Revenue CAGR Breakdown (%), by Growth Term
Table 29: France Data Center Rack Market Revenue CAGR Breakdown (%), by Growth Term
Table 30: Italy Data Center Rack Market Revenue CAGR Breakdown (%), by Growth Term
Table 31: Spain Data Center Rack Market Revenue CAGR Breakdown (%), by Growth Term
Table 32: Asia Pacific Data Center Rack Market Value (US$ Mn) Forecast, by Component, 2018 – 2031
Table 33: Asia Pacific Data Center Rack Market Value (US$ Mn) Forecast, by Rack Height, 2018 – 2031
Table 34: Asia Pacific Data Center Rack Market Value (US$ Mn) Forecast, by End-user, 2018 – 2031
Table 35: Asia Pacific Data Center Rack Market Value (US$ Mn) Forecast, by Country, 2018 - 2031
Table 36: China Data Center Rack Market Revenue CAGR Breakdown (%), by Growth Term
Table 37: India Data Center Rack Market Revenue CAGR Breakdown (%), by Growth Term
Table 38: Japan Data Center Rack Market Revenue CAGR Breakdown (%), by Growth Term
Table 39: ASEAN Data Center Rack Market Revenue CAGR Breakdown (%), by Growth Term
Table 40: Middle East & Africa Data Center Rack Market Value (US$ Mn) Forecast, by Component, 2018 – 2031
Table 41: Middle East & Africa Data Center Rack Market Value (US$ Mn) Forecast, by Rack Height, 2018 – 2031
Table 42: Middle East & Africa Data Center Rack Market Value (US$ Mn) Forecast, by End-user, 2018 – 2031
Table 43: Middle East & Africa Data Center Rack Market Value (US$ Mn) Forecast, by Country, 2018 - 2031
Table 44: Saudi Arabia Data Center Rack Market Revenue CAGR Breakdown (%), by Growth Term
Table 45: The United Arab Emirates Data Center Rack Market Revenue CAGR Breakdown (%), by Growth Term
Table 46: South Africa Data Center Rack Market Revenue CAGR Breakdown (%), by Growth Term
Table 47: South America Data Center Rack Market Value (US$ Mn) Forecast, by Component, 2018 – 2031
Table 48: South America Data Center Rack Market Value (US$ Mn) Forecast, by Rack Height, 2018 – 2031
Table 49: South America Data Center Rack Market Value (US$ Mn) Forecast, by End-user, 2018 – 2031
Table 50: South America Data Center Rack Market Value (US$ Mn) Forecast, by Country, 2018 - 2031
Table 51: Brazil Data Center Rack Market Revenue CAGR Breakdown (%), by Growth Term
Table 52: Argentina Data Center Rack Market Revenue CAGR Breakdown (%), by Growth Term
Table 53: Mergers & Acquisitions, Partnerships (1/2)
Table 54: Mergers & Acquisitions, Partnership (2/2)
List of Figures
Figure 1: Global Data Center Rack Market Size (US$ Mn) Forecast, 2018–2031
Figure 2: Global Data Center Rack Market Revenue (US$ Mn) Opportunity Assessment, by Region, 2022E
Figure 3: Top Segment Analysis of Data Center Rack Market
Figure 4: Global Data Center Rack Market Revenue (US$ Mn) Opportunity Assessment, by Region, 2031F
Figure 5: Global Data Center Rack Market Attractiveness Assessment, by Component
Figure 6: Global Data Center Rack Market Attractiveness Assessment, by Rack Height
Figure 7: Global Data Center Rack Market Attractiveness Assessment, by End-user
Figure 8: Global Data Center Rack Market Attractiveness Assessment, by Region
Figure 9: Global Data Center Rack Market Revenue (US$ Mn) Historic Trends, 2016 – 2021
Figure 10: Global Data Center Rack Market Revenue Opportunity (US$ Mn) Historic Trends, 2016 – 2021
Figure 11: Global Data Center Rack Market Value Share Analysis, by Component, 2022
Figure 12: Global Data Center Rack Market Value Share Analysis, by Component, 2031
Figure 13: Global Data Center Rack Market Absolute Opportunity (US$ Mn), by Solution, 2022 – 2031
Figure 14: Global Data Center Rack Market Absolute Opportunity (US$ Mn), by Services, 2022 – 2031
Figure 15: Global Data Center Rack Market Value Share Analysis, by Rack Height, 2022
Figure 16: Global Data Center Rack Market Value Share Analysis, by Rack Height, 2031
Figure 17: Global Data Center Rack Market Absolute Opportunity (US$ Mn), by Below 42U, 2022 – 2031
Figure 18: Global Data Center Rack Market Absolute Opportunity (US$ Mn), by 43U to 52U, 2022 – 2031
Figure 19: Global Data Center Rack Market Absolute Opportunity (US$ Mn), by Above 52U, 2022 – 2031
Figure 20: Global Data Center Rack Market Value Share Analysis, by End-user, 2022
Figure 21: Global Data Center Rack Market Value Share Analysis, by End-user, 2031
Figure 22: Global Data Center Rack Market Absolute Opportunity (US$ Mn), by BFSI, 2022 – 2031
Figure 23: Global Data Center Rack Market Absolute Opportunity (US$ Mn), by IT & Telecom, 2022 – 2031
Figure 24: Global Data Center Rack Market Absolute Opportunity (US$ Mn), by Government, 2022 – 2031
Figure 25: Global Data Center Rack Market Absolute Opportunity (US$ Mn), by Retail, 2022 – 2031
Figure 26: Global Data Center Rack Market Absolute Opportunity (US$ Mn), by Manufacturing, 2022 – 2031
Figure 27: Global Data Center Rack Market Absolute Opportunity (US$ Mn), by Healthcare, 2022 – 2031
Figure 28: Global Data Center Rack Market Absolute Opportunity (US$ Mn), by Energy & Utilities, 2022 – 2031
Figure 29: Global Data Center Rack Market Absolute Opportunity (US$ Mn), by Others, 2022 – 2031
Figure 30: Global Data Center Rack Market Opportunity (US$ Mn), by Region
Figure 31: Global Data Center Rack Market Opportunity Share (%), by Region, 2022–2031
Figure 32: Global Data Center Rack Market Size (US$ Mn), by Region, 2022 & 2031
Figure 33: Global Data Center Rack Market Value Share Analysis, by Region, 2022
Figure 34: Global Data Center Rack Market Value Share Analysis, by Region, 2031
Figure 35: North America Data Center Rack Market Absolute Opportunity (US$ Mn), 2022 – 2031
Figure 36: Europe Data Center Rack Market Absolute Opportunity (US$ Mn), 2022 – 2031
Figure 37: Asia Pacific Data Center Rack Market Absolute Opportunity (US$ Mn), 2022 – 2031
Figure 38: Middle East & Africa Data Center Rack Market Absolute Opportunity (US$ Mn), 2022 – 2031
Figure 39: South America Data Center Rack Market Absolute Opportunity (US$ Mn), 2022 – 2031
Figure 40: North America Data Center Rack Market Revenue Opportunity Share, by Component
Figure 41: North America Data Center Rack Market Revenue Opportunity Share, by Rack Height
Figure 42: North America Data Center Rack Market Revenue Opportunity Share, by End-user
Figure 43: North America Data Center Rack Market Revenue Opportunity Share, by Country
Figure 44: North America Data Center Rack Market Value Share Analysis, by Component, 2022
Figure 45: North America Data Center Rack Market Value Share Analysis, by Component, 2031
Figure 46: North America Data Center Rack Market Absolute Opportunity (US$ Mn), by Solution, 2022 – 2031
Figure 47: North America Data Center Rack Market Absolute Opportunity (US$ Mn), by Services, 2022 – 2031
Figure 48: North America Data Center Rack Market Value Share Analysis, by Rack Height, 2022
Figure 49: North America Data Center Rack Market Value Share Analysis, by Rack Height, 2031
Figure 50: North America Data Center Rack Market Absolute Opportunity (US$ Mn), by Below 42U, 2022 – 2031
Figure 51: North America Data Center Rack Market Absolute Opportunity (US$ Mn), by 43U to 52U, 2022 – 2031
Figure 52: North America Data Center Rack Market Absolute Opportunity (US$ Mn), by Above 52U, 2022 – 2031
Figure 53: North America Data Center Rack Market Value Share Analysis, by End-user, 2022
Figure 54: North America Data Center Rack Market Value Share Analysis, by End-user, 2031
Figure 55: North America Data Center Rack Market Absolute Opportunity (US$ Mn), by BFSI, 2022 – 2031
Figure 56: North America Data Center Rack Market Absolute Opportunity (US$ Mn), by IT & Telecom, 2022 – 2031
Figure 57: North America Data Center Rack Market Absolute Opportunity (US$ Mn), by Government, 2022 – 2031
Figure 58: North America Data Center Rack Market Absolute Opportunity (US$ Mn), by Retail, 2022 – 2031
Figure 59: North America Data Center Rack Market Absolute Opportunity (US$ Mn), by Manufacturing, 2022 – 2031
Figure 60: North America Data Center Rack Market Absolute Opportunity (US$ Mn), by Healthcare, 2022 – 2031
Figure 61: North America Data Center Rack Market Absolute Opportunity (US$ Mn), by Energy & Utilities, 2022 – 2031
Figure 62: North America Data Center Rack Market Absolute Opportunity (US$ Mn), by Others, 2022 – 2031
Figure 63: North America Data Center Rack Market Value Share Analysis, by Country, 2022
Figure 64: North America Data Center Rack Market Value Share Analysis, by Country, 2031
Figure 65: U.S. Data Center Rack Market Opportunity Growth Analysis (US$ Mn) Forecast, 2022 – 2031
Figure 66: Canada Data Center Rack Market Opportunity Growth Analysis (US$ Mn) Forecast, 2022 – 2031
Figure 67: Mexico Data Center Rack Market Opportunity Growth Analysis (US$ Mn) Forecast, 2022 – 2031
Figure 68: Europe Data Center Rack Market Revenue Opportunity Share, by Component
Figure 69: Europe Data Center Rack Market Revenue Opportunity Share, by Rack Height
Figure 70: Europe Data Center Rack Market Revenue Opportunity Share, by End-user
Figure 71: Europe Data Center Rack Market Revenue Opportunity Share, by Country
Figure 72: Europe Data Center Rack Market Value Share Analysis, by Component, 2022
Figure 73: Europe Data Center Rack Market Value Share Analysis, by Component, 2031
Figure 74: Europe Data Center Rack Market Absolute Opportunity (US$ Mn), by Solution, 2022 – 2031
Figure 75: Europe Data Center Rack Market Absolute Opportunity (US$ Mn), by Services, 2022 – 2031
Figure 76: Europe Data Center Rack Market Value Share Analysis, by Rack Height, 2022
Figure 77: Europe Data Center Rack Market Value Share Analysis, by Rack Height, 2031
Figure 78: Europe Data Center Rack Market Absolute Opportunity (US$ Mn), by Below 42U, 2022 – 2031
Figure 79: Europe Data Center Rack Market Absolute Opportunity (US$ Mn), by 43U to 52U, 2022 – 2031
Figure 80: Europe Data Center Rack Market Absolute Opportunity (US$ Mn), by Above 52U, 2022 – 2031
Figure 81: Europe Data Center Rack Market Value Share Analysis, by End-user, 2022
Figure 82: Europe Data Center Rack Market Value Share Analysis, by End-user, 2031
Figure 83: Europe Data Center Rack Market Absolute Opportunity (US$ Mn), by BFSI, 2022 – 2031
Figure 84: Europe Data Center Rack Market Absolute Opportunity (US$ Mn), by IT & Telecom, 2022 – 2031
Figure 85: Europe Data Center Rack Market Absolute Opportunity (US$ Mn), by Government, 2022 – 2031
Figure 86: Europe Data Center Rack Market Absolute Opportunity (US$ Mn), by Retail, 2022 – 2031
Figure 87: Europe Data Center Rack Market Absolute Opportunity (US$ Mn), by Manufacturing, 2022 – 2031
Figure 88: Europe Data Center Rack Market Absolute Opportunity (US$ Mn), by Healthcare, 2022 – 2031
Figure 89: Europe Data Center Rack Market Absolute Opportunity (US$ Mn), by Energy & Utilities, 2022 – 2031
Figure 90: Europe Data Center Rack Market Absolute Opportunity (US$ Mn), by Others, 2022 – 2031
Figure 91: Europe Data Center Rack Market Value Share Analysis, by Country, 2022
Figure 92: Europe Data Center Rack Market Value Share Analysis, by Country, 2031
Figure 93: Germany Data Center Rack Market Opportunity Growth Analysis (US$ Mn) Forecast, 2022 – 2031
Figure 94: U.K. Data Center Rack Market Opportunity Growth Analysis (US$ Mn) Forecast, 2022 – 2031
Figure 95: France Data Center Rack Market Opportunity Growth Analysis (US$ Mn) Forecast, 2022 – 2031
Figure 96: Italy Data Center Rack Market Opportunity Growth Analysis (US$ Mn) Forecast, 2022 – 2031
Figure 97: Spain Data Center Rack Market Opportunity Growth Analysis (US$ Mn) Forecast, 2022 – 2031
Figure 98: Asia Pacific Data Center Rack Market Revenue Opportunity Share, by Component
Figure 99: Asia Pacific Data Center Rack Market Revenue Opportunity Share, by Rack Height
Figure 100: Asia Pacific Data Center Rack Market Revenue Opportunity Share, by End-user
Figure 101: Asia Pacific Data Center Rack Market Revenue Opportunity Share, by Country
Figure 102: Asia Pacific Data Center Rack Market Value Share Analysis, by Component, 2022
Figure 103: Asia Pacific Data Center Rack Market Value Share Analysis, by Component, 2031
Figure 104: Asia Pacific Data Center Rack Market Absolute Opportunity (US$ Mn), by Solution, 2022 – 2031
Figure 105: Asia Pacific Data Center Rack Market Absolute Opportunity (US$ Mn), by Services, 2022 – 2031
Figure 106: Asia Pacific Data Center Rack Market Value Share Analysis, by Rack Height, 2022
Figure 107: Asia Pacific Data Center Rack Market Value Share Analysis, by Rack Height, 2031
Figure 108: Asia Pacific Data Center Rack Market Absolute Opportunity (US$ Mn), by Below 42U, 2022 – 2031
Figure 109: Asia Pacific Data Center Rack Market Absolute Opportunity (US$ Mn), by 43U to 52U, 2022 – 2031
Figure 110: Asia Pacific Data Center Rack Market Absolute Opportunity (US$ Mn), by Above 52U, 2022 – 2031
Figure 111: Asia Pacific Data Center Rack Market Value Share Analysis, by End-user, 2022
Figure 112: Asia Pacific Data Center Rack Market Value Share Analysis, by End-user, 2031
Figure 113: Asia Pacific Data Center Rack Market Absolute Opportunity (US$ Mn), by BFSI, 2022 – 2031
Figure 114: Asia Pacific Data Center Rack Market Absolute Opportunity (US$ Mn), by IT & Telecom, 2022 – 2031
Figure 115: Asia Pacific Data Center Rack Market Absolute Opportunity (US$ Mn), by Government, 2022 – 2031
Figure 116: Asia Pacific Data Center Rack Market Absolute Opportunity (US$ Mn), by Retail, 2022 – 2031
Figure 117: Asia Pacific Data Center Rack Market Absolute Opportunity (US$ Mn), by Manufacturing, 2022 – 2031
Figure 118: Asia Pacific Data Center Rack Market Absolute Opportunity (US$ Mn), by Healthcare, 2022 – 2031
Figure 119: Asia Pacific Data Center Rack Market Absolute Opportunity (US$ Mn), by Energy & Utilities, 2022 – 2031
Figure 120: Asia Pacific Data Center Rack Market Absolute Opportunity (US$ Mn), by Others, 2022 – 2031
Figure 121: Asia Pacific Data Center Rack Market Value Share Analysis, by Country, 2022
Figure 122: Asia Pacific Data Center Rack Market Value Share Analysis, by Country, 2031
Figure 123: China Data Center Rack Market Opportunity Growth Analysis (US$ Mn) Forecast, 2022 – 2031
Figure 124: India Data Center Rack Market Opportunity Growth Analysis (US$ Mn) Forecast, 2022 – 2031
Figure 125: Japan Data Center Rack Market Opportunity Growth Analysis (US$ Mn) Forecast, 2022 – 2031
Figure 126: ASEAN Data Center Rack Market Opportunity Growth Analysis (US$ Mn) Forecast, 2022 – 2031
Figure 127: Middle East & Africa Data Center Rack Market Revenue Opportunity Share, by Component
Figure 128: Middle East & Africa Data Center Rack Market Revenue Opportunity Share, by Rack Height
Figure 129: Middle East & Africa Data Center Rack Market Revenue Opportunity Share, by End-user
Figure 130: Middle East & Africa Data Center Rack Market Revenue Opportunity Share, by Country
Figure 131: Middle East & Africa Data Center Rack Market Value Share Analysis, by Component, 2022
Figure 132: Middle East & Africa Data Center Rack Market Value Share Analysis, by Component, 2031
Figure 133: Middle East & Africa Data Center Rack Market Absolute Opportunity (US$ Mn), by Solution, 2022 – 2031
Figure 134: Middle East & Africa Data Center Rack Market Absolute Opportunity (US$ Mn), by Services, 2022 – 2031
Figure 135: Middle East & Africa Data Center Rack Market Value Share Analysis, by Rack Height, 2022
Figure 136: Middle East & Africa Data Center Rack Market Value Share Analysis, by Rack Height, 2031
Figure 137: Middle East & Africa Data Center Rack Market Absolute Opportunity (US$ Mn), by Below 42U, 2022 – 2031
Figure 138: Middle East & Africa Data Center Rack Market Absolute Opportunity (US$ Mn), by 43U to 52U, 2022 – 2031
Figure 139: Middle East & Africa Data Center Rack Market Absolute Opportunity (US$ Mn), by Above 52U, 2022 – 2031
Figure 140: Middle East & Africa Data Center Rack Market Value Share Analysis, by End-user, 2022
Figure 141: Middle East & Africa Data Center Rack Market Value Share Analysis, by End-user, 2031
Figure 142: Middle East & Africa Data Center Rack Market Absolute Opportunity (US$ Mn), by BFSI, 2022 – 2031
Figure 143: Middle East & Africa Data Center Rack Market Absolute Opportunity (US$ Mn), by IT & Telecom, 2022 – 2031
Figure 144: Middle East & Africa Data Center Rack Market Absolute Opportunity (US$ Mn), by Government, 2022 – 2031
Figure 145: Middle East & Africa Data Center Rack Market Absolute Opportunity (US$ Mn), by Retail, 2022 – 2031
Figure 146: Middle East & Africa Data Center Rack Market Absolute Opportunity (US$ Mn), by Manufacturing, 2022 – 2031
Figure 147: Middle East & Africa Data Center Rack Market Absolute Opportunity (US$ Mn), by Healthcare, 2022 – 2031
Figure 148: Middle East & Africa Data Center Rack Market Absolute Opportunity (US$ Mn), by Energy & Utilities, 2022 – 2031
Figure 149: Middle East & Africa Data Center Rack Market Absolute Opportunity (US$ Mn), by Others, 2022 – 2031
Figure 150: Middle East & Africa Data Center Rack Market Value Share Analysis, by Country, 2022
Figure 151: Middle East & Africa Data Center Rack Market Value Share Analysis, by Country, 2031
Figure 152: Saudi Arabia Data Center Rack Market Opportunity Growth Analysis (US$ Mn) Forecast, 2022 – 2031
Figure 153: The United Arab Emirates Data Center Rack Market Opportunity Growth Analysis (US$ Mn) Forecast, 2022 – 2031
Figure 154: South Africa Data Center Rack Market Opportunity Growth Analysis (US$ Mn) Forecast, 2022 – 2031
Figure 155: South America Data Center Rack Market Revenue Opportunity Share, by Component
Figure 156: South America Data Center Rack Market Revenue Opportunity Share, by Rack Height
Figure 157: South America Data Center Rack Market Revenue Opportunity Share, by End-user
Figure 158: South America Data Center Rack Market Revenue Opportunity Share, by Country
Figure 159: South America Data Center Rack Market Value Share Analysis, by Component, 2022
Figure 160: South America Data Center Rack Market Value Share Analysis, by Component, 2031
Figure 161: South America Data Center Rack Market Absolute Opportunity (US$ Mn), by Solution, 2022 – 2031
Figure 162: South America Data Center Rack Market Absolute Opportunity (US$ Mn), by Services, 2022 – 2031
Figure 163: South America Data Center Rack Market Value Share Analysis, by Rack Height, 2022
Figure 164: South America Data Center Rack Market Value Share Analysis, by Rack Height, 2031
Figure 165: South America Data Center Rack Market Absolute Opportunity (US$ Mn), by Below 42U, 2022 – 2031
Figure 166: South America Data Center Rack Market Absolute Opportunity (US$ Mn), by 43U to 52U, 2022 – 2031
Figure 167: South America Data Center Rack Market Absolute Opportunity (US$ Mn), by Above 52U, 2022 – 2031
Figure 168: South America Data Center Rack Market Value Share Analysis, by End-user, 2022
Figure 169: South America Data Center Rack Market Value Share Analysis, by End-user, 2031
Figure 170: South America Data Center Rack Market Absolute Opportunity (US$ Mn), by BFSI, 2022 – 2031
Figure 171: South America Data Center Rack Market Absolute Opportunity (US$ Mn), by IT & Telecom, 2022 – 2031
Figure 172: South America Data Center Rack Market Absolute Opportunity (US$ Mn), by Government, 2022 – 2031
Figure 173: South America Data Center Rack Market Absolute Opportunity (US$ Mn), by Retail, 2022 – 2031
Figure 174: South America Data Center Rack Market Absolute Opportunity (US$ Mn), by Manufacturing, 2022 – 2031
Figure 175: South America Data Center Rack Market Absolute Opportunity (US$ Mn), by Healthcare, 2022 – 2031
Figure 176: South America Data Center Rack Market Absolute Opportunity (US$ Mn), by Energy & Utilities, 2022 – 2031
Figure 177: South America Data Center Rack Market Absolute Opportunity (US$ Mn), by Others, 2022 – 2031
Figure 178: South America Data Center Rack Market Value Share Analysis, by Country, 2022
Figure 179: South America Data Center Rack Market Value Share Analysis, by Country, 2031
Figure 180: Brazil Data Center Rack Market Opportunity Growth Analysis (US$ Mn) Forecast, 2022 – 2031
Figure 181: Argentina Data Center Rack Market Opportunity Growth Analysis (US$ Mn) Forecast, 2022 – 2031
Copyright © Transparency Market Research, Inc. All Rights reserved
Trust Online

Data Center Rack Market