
Reports
Reports
Data Business in Oil and Gas Market - Snapshot
Data generated in the oil and gas industry is increasing in volume, variety, and velocity. Oil and gas industry needs new technologies to integrate and interpret such large amounts of structured and unstructured data generated daily from different data sources such as seismic data, geological data, well logging data, etc. Information technology providers are continuously looking for solutions that could provide new opportunities to capture the big data and are researching tools for data managementin the oil and gas industry. Potential for deriving new insights from data generated in the oil and gas industryis the key factor driving the data business in oil and gas market. Companies in the oil and gas industry are improving operational performance by adopting data management and big data solutions to classify and streamline the data and to monitor daily workflows, thus fuelling the data business market growth. However, declined oil prices and the falling CAPEX, especially in resource development, supply chain, and IT spending in the oil and gas industry hindered the growth of the data business in oil and gasmarket for the short term. Increasing foreign investments in refineries and petrochemicals across developing countries and large proven oil reserves in Venezuela, the U.S., China, Ecuador, and Brazil brings an opportunity to drive growth of the data business in oil and gas market.
The data business in oil and gasmarket is segmented based on component, oil companies, application, and region. By component, the market is segmented as big data, data management, and direct data monetization. Big data component is further segmented into software and services. Big data software includes data analytics, data collection, data discovery and visualization, and data management software. Big data services in the oil and gas market are classified into consulting, system integration, and operation and maintenance. Data management component is also segmented into software and services. Data management software includes Corporate Data Management (CDM)/ Enterprise Data Management (EDM), Project Data Management (PDM) and National Data Repository (NDR). Data management services include consulting & planning, integration & implementation, and operation & maintenance. Data business market is also segmented based on oil companiesinto National Oil Companies (NOCs), Independent Oil Companies (IOCs), and National Data Repository (NDR).National Oil Companies (NOCs) segment is anticipated to dominate the global data business in oil and gas market. NOCs are increasingly spending on big data and data management software and services, thus accounting for the maximum share in the data business market. Further, by application, the market is segmented into upstream (conventional, unconventional), midstream, and downstream. It is anticipated that the upstream application segment will continue to dominate the market over the forecast period. Upstream application segment is also classified by E&P lifecycle into exploration, development, and production segments.Exploration is the key segment in the E&P lifecycle of the oil and gas industry driven mainly by deep-water exploration activities, shale gas exploration activities, declined exploration costs and rising focus on near field explorations.
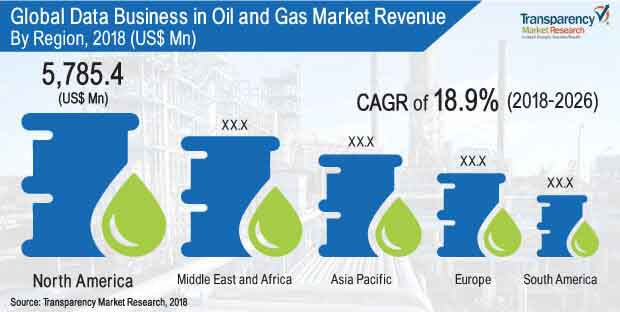
Regional segmentation ofthe data business in oil and gasmarket includes North America, Europe, Asia Pacific, South America, and Middle East & Africa (MEA). North America is projected to dominate the data business in oil and gasmarket due to presence of key industry players, increasing oil production, shale oil reserves, and necessary infrastructure. Asia Pacificis likely to observe strong growth opportunities during the forecast period dueto rising investments in the E&P sector.
Key players inthe data business in oil and gas market are Accenture, Datawatch, Drillinginfo, Hitachi Vantara Corporation, Hortonworks, Inc., IBM Corporation, EMC Corporation, Newgen Software, Inc., Cisco Software, Inc., Tata Consultancy Services Ltd., Halliburton, Informatica Corporation, Schlumberger Limited, MapR Technologies, Inc., Microsoft Corporation, Oracle Corporation, SAP SE, SAS Institute, Inc., Cloudera, Inc., Palantir Solutions, Capgemini SE, and OSIsoft LLC among others.
Technological Advancements to Play a Crucial Role in the Growth of the Data Business in Oil and Gas Market
The growing consumption of oil and gas across many countries due to factors like booming population and rising disposable income will bring immense growth opportunities for the data business in oil and gas market during the forecast period of 2018-2026.
1. Preface
1.1. Market Scope
1.2. Market Segmentation
1.3. Key Research Objectives
2. Assumptions and Research Methodology
2.1. Research Methodology
2.1.1. List of Primary and Secondary Sources
2.2. Key Assumptions for Data Modeling
3. Executive Summary : Global Data Business in Oil and Gas Market
4. Market Overview
4.1. Introduction
4.2. Global Market – Macro Economic Factors Overview
4.2.1. World GDP Indicator – For Top 20 Economies
4.2.2. Global ICT Spending (US$ Mn), 2012, 2018, 2026
4.3. Regulations and Policies by Region
4.4. Technology/Product Roadmap
4.5. Porter’s Five Forces Analysis
4.6. PESTEL Analysis
4.7. Ecosystem Analysis
4.8. Key Market Indicators
4.9. Market Dynamics (Growth Influencers)
4.9.1. Drivers
4.9.2. Restraints
4.9.3. Opportunities
4.9.4. Impact Analysis of Drivers & Restraints
4.9.5. Key Trends
4.10. Spending Analysis (2017)
4.10.1. IT spending analysis for Oil & Gas Industry
4.10.2. IT Spending, by Type (US$ Mn)
4.10.2.1. Hardware
4.10.2.2. Software/Platform
4.10.2.3. Services
4.11. Global Data Business in Oil and Gas Market Analysis and Forecast, 2016 - 2026
4.11.1. Market Revenue Analysis (US$ Mn)
4.11.1.1. Historic growth trends, 2012-2017
4.11.1.2. Forecast trends, 2018-2026
4.12. Market Outlook
4.13. Competitive Scenario and Trends
4.13.1. List of New Entrants
4.13.2. Mergers & Acquisitions, Expansions
5. Global Data Business in Oil and Gas Market Analysis and Forecast, by Component
5.1. Overview & Definitions
5.2. Data Business in Oil and Gas Market Size (US$ Mn) Forecast, by Component, 2016 - 2026
5.2.1. Big Data
5.2.1.1. Software
5.2.1.1.1. Data Analytics
5.2.1.1.2. Data Collection
5.2.1.1.3. Data Discovery and Visualization
5.2.1.1.4. Data Management
5.2.1.2. Services
5.2.1.2.1. Consulting
5.2.1.2.2. System Integration
5.2.1.2.3. Operation and Maintenance
5.2.2. Data Management
5.2.2.1. Software
5.2.2.1.1. Corporate/Enterprise Data Management
5.2.2.1.2. Project Data Management
5.2.2.1.3. National Data Repository
5.2.2.2. Services
5.2.2.2.1. Consulting & Planning
5.2.2.2.2. Integration& Implementation
5.2.2.2.3. Operation & Maintenance
5.2.3. Direct Data Monetization
5.3. Component Market Value Share
5.4. Market Attractiveness Analysis by Component
6. Global Data Business in Oil and Gas Market Analysis and Forecast, byOil Companies
6.1. Overview & Definitions
6.2. Data Business in Oil and Gas Market Size (US$ Mn) Forecast, by Oil Companies, 2016 - 2026
6.2.1. National Oil Companies
6.2.2. Independent Oil Companies
6.2.3. National Data Repository
6.3. Oil Companies Market Value Share
6.4. Market Attractiveness Analysis by Oil Companies
7. Global Data Business in Oil and Gas Market Analysis and Forecast, by Application
7.1. Overview & Definitions
7.2. Data Business in Oil and Gas Market Size (US$ Mn) Forecast, by Application, 2016 - 2026
7.2.1. Upstream
7.2.1.1. Conventional
7.2.1.2. Unconventional
7.2.2. Midstream
7.2.3. Downstream
7.3. Application Market Value Share
7.4. Market Attractiveness Analysis by Application
8. Global Upstream Data Business in Oil and Gas Market Analysis and Forecast, by E&P Lifecycle
8.1. Overview & Definitions
8.2. Upstream Data Business in Oil and Gas Market Size (US$ Mn) Forecast, by E&P Lifecycle, 2016 - 2026
8.2.1. Exploration
8.2.2. Development
8.2.3. Production
8.3. E&P Lifecycle Market Value Share
8.4. Market Attractiveness Analysis by E&P Lifecycle
9. Global Data Business in Oil and Gas Market Analysis and Forecast, by Region
9.1. Key Findings
9.2. Data Business in Oil and Gas Market Size (US$ Mn) Forecast, by Region, 2016 - 2026
9.2.1. North America
9.2.2. Europe
9.2.3. Asia Pacific
9.2.4. Middle East & Africa
9.2.5. South America
9.3. Region Market Value Share
10. North America Data Business in Oil and Gas Market Analysis and Forecast
10.1. Key Findings
10.2. Data Business in Oil and Gas Market Size (US$ Mn) Forecast, by Component, 2016 - 2026
10.2.1. Big Data
10.2.1.1. Software
10.2.1.1.1. Data Analytics
10.2.1.1.2. Data Collection
10.2.1.1.3. Data Discovery and Visualization
10.2.1.1.4. Data Management
10.2.1.2. Services
10.2.1.2.1. Consulting
10.2.1.2.2. System Integration
10.2.1.2.3. Operation and Maintenance
10.2.2. Data Management
10.2.2.1. Software
10.2.2.1.1. Corporate/Enterprise Data Management
10.2.2.1.2. Project Data Management
10.2.2.1.3. National Data Repository
10.2.2.2. Services
10.2.2.2.1. Consulting & Planning
10.2.2.2.2. Integration& Implementation
10.2.2.2.3. Operation & Maintenance
10.2.3. Direct Data Monetization
10.3. Data Business in Oil and Gas Market Size (US$ Mn) Forecast, by Oil Companies, 2016 - 2026
10.3.1. National Oil Companies
10.3.2. Independent Oil Companies
10.3.3. National Data Repository
10.4. Data Business in Oil and Gas Market Size (US$ Mn) Forecast, by Application, 2016 - 2026
10.4.1. Upstream
10.4.1.1. Conventional
10.4.1.2. Unconventional
10.4.2. Midstream
10.4.3. Downstream
10.5. Upstream Data Business in Oil and Gas Market Size (US$ Mn) Forecast, by E&P Lifecycle, 2016 - 2026
10.5.1. Exploration
10.5.2. Development
10.5.3. Production
10.6. Data Business in Oil and Gas Market Size (US$ Mn) Forecast, by Country, 2016 - 2026
10.6.1. The U.S.
10.6.2. Canada
10.6.3. Rest of North America
10.7. Market Attractiveness Analysis
10.7.1. By Component
10.7.2. By Oil Companies
10.7.3. By Application
10.7.4. By E&P Lifecycle
10.7.5. By Country
11. Europe Data Business in Oil and Gas Market Analysis and Forecast
11.1. Key Findings
11.2. Data Business in Oil and Gas Market Size (US$ Mn) Forecast, by Component, 2016 - 2026
11.2.1. Big Data
11.2.1.1. Software
11.2.1.1.1. Data Analytics
11.2.1.1.2. Data Collection
11.2.1.1.3. Data Discovery and Visualization
11.2.1.1.4. Data Management
11.2.1.2. Services
11.2.1.2.1. Consulting
11.2.1.2.2. System Integration
11.2.1.2.3. Operation and Maintenance
11.2.2. Data Management
11.2.2.1. Software
11.2.2.1.1. Corporate/Enterprise Data Management
11.2.2.1.2. Project Data Management
11.2.2.1.3. National Data Repository
11.2.2.2. Services
11.2.2.2.1. Consulting & Planning
11.2.2.2.2. Integration& Implementation
11.2.2.2.3. Operation & Maintenance
11.2.3. Direct Data Monetization
11.3. Data Business in Oil and Gas Market Size (US$ Mn) Forecast, by Oil Companies, 2016 - 2026
11.3.1. National Oil Companies
11.3.2. Independent Oil Companies
11.3.3. National Data Repository
11.4. Data Business in Oil and Gas Market Size (US$ Mn) Forecast, by Application, 2016 - 2026
11.4.1. Upstream
11.4.1.1. Conventional
11.4.1.2. Unconventional
11.4.2. Midstream
11.4.3. Downstream
11.5. Upstream Data Business in Oil and Gas Market Size (US$ Mn) Forecast, by E&P Lifecycle, 2016 - 2026
11.5.1. Exploration
11.5.2. Development
11.5.3. Production
11.6. Data Business in Oil and Gas Market Size (US$ Mn) Forecast, by Country, 2016 - 2026
11.6.1. Germany
11.6.2. France
11.6.3. UK
11.6.4. Rest of Europe
11.7. Market Attractiveness Analysis
11.7.1. By Component
11.7.2. By Oil Companies
11.7.3. By Application
11.7.4. By E&P Lifecycle
11.7.5. By Country
12. Asia Pacific Data Business in Oil and Gas Market Analysis and Forecast
12.1. Key Findings
12.2. Data Business in Oil and Gas Market Size (US$ Mn) Forecast, by Component, 2016 - 2026
12.2.1. Big Data
12.2.1.1. Software
12.2.1.1.1. Data Analytics
12.2.1.1.2. Data Collection
12.2.1.1.3. Data Discovery and Visualization
12.2.1.1.4. Data Management
12.2.1.2. Services
12.2.1.2.1. Consulting
12.2.1.2.2. System Integration
12.2.1.2.3. Operation and Maintenance
12.2.2. Data Management
12.2.2.1. Software
12.2.2.1.1. Corporate/Enterprise Data Management
12.2.2.1.2. Project Data Management
12.2.2.1.3. National Data Repository
12.2.2.2. Services
12.2.2.2.1. Consulting & Planning
12.2.2.2.2. Integration& Implementation
12.2.2.2.3. Operation & Maintenance
12.2.3. Direct Data Monetization
12.3. Data Business in Oil and Gas Market Size (US$ Mn) Forecast, by Oil Companies, 2016 - 2026
12.3.1. National Oil Companies
12.3.2. Independent Oil Companies
12.3.3. National Data Repository
12.4. Data Business in Oil and Gas Market Size (US$ Mn) Forecast, by Application, 2016 - 2026
12.4.1. Upstream
12.4.1.1. Conventional
12.4.1.2. Unconventional
12.4.2. Midstream
12.4.3. Downstream
12.5. Upstream Data Business in Oil and Gas Market Size (US$ Mn) Forecast, by E&P Lifecycle, 2016 - 2026
12.5.1. Exploration
12.5.2. Development
12.5.3. Production
12.6. Data Business in Oil and Gas Market Size (US$ Mn) Forecast, by Country, 2016 - 2026
12.6.1. China
12.6.2. Japan
12.6.3. India
12.6.4. Rest of Asia Pacific
12.7. Market Attractiveness Analysis
12.7.1. By Component
12.7.2. By Oil Companies
12.7.3. By Application
12.7.4. By E&P Lifecycle
12.7.5. By Country
13. Middle East & Africa (MEA) Data Business in Oil and Gas Market Analysis and Forecast
13.1. Key Findings
13.2. Data Business in Oil and Gas Market Size (US$ Mn) Forecast, by Component, 2016 - 2026
13.2.1. Big Data
13.2.1.1. Software
13.2.1.1.1. Data Analytics
13.2.1.1.2. Data Collection
13.2.1.1.3. Data Discovery and Visualization
13.2.1.1.4. Data Management
13.2.1.2. Services
13.2.1.2.1. Consulting
13.2.1.2.2. System Integration
13.2.1.2.3. Operation and Maintenance
13.2.2. Data Management
13.2.2.1. Software
13.2.2.1.1. Corporate/Enterprise Data Management
13.2.2.1.2. Project Data Management
13.2.2.1.3. National Data Repository
13.2.2.2. Services
13.2.2.2.1. Consulting & Planning
13.2.2.2.2. Integration& Implementation
13.2.2.2.3. Operation & Maintenance
13.2.3. Direct Data Monetization
13.3. Data Business in Oil and Gas Market Size (US$ Mn) Forecast, by Oil Companies, 2016 - 2026
13.3.1. National Oil Companies
13.3.2. Independent Oil Companies
13.3.3. National Data Repository
13.4. Data Business in Oil and Gas Market Size (US$ Mn) Forecast, by Application, 2016 - 2026
13.4.1. Upstream
13.4.1.1. Conventional
13.4.1.2. Unconventional
13.4.2. Midstream
13.4.3. Downstream
13.5. Upstream Data Business in Oil and Gas Market Size (US$ Mn) Forecast, by E&P Lifecycle, 2016 - 2026
13.5.1. Exploration
13.5.2. Development
13.5.3. Production
13.6. Data Business in Oil and Gas Market Size (US$ Mn) Forecast, by Country, 2016 - 2026
13.6.1. GCC
13.6.2. South Africa
13.6.3. Rest of MEA
13.7. Market Attractiveness Analysis
13.7.1. By Component
13.7.2. By Oil Companies
13.7.3. By Application
13.7.4. By E&P Lifecycle
13.7.5. By Country
14. South America Data Business in Oil and Gas Market Analysis and Forecast
14.1. Key Findings
14.2. Data Business in Oil and Gas Market Size (US$ Mn) Forecast, by Component, 2016 - 2026
14.2.1. Big Data
14.2.1.1. Software
14.2.1.1.1. Data Analytics
14.2.1.1.2. Data Collection
14.2.1.1.3. Data Discovery and Visualization
14.2.1.1.4. Data Management
14.2.1.2. Services
14.2.1.2.1. Consulting
14.2.1.2.2. System Integration
14.2.1.2.3. Operation and Maintenance
14.2.2. Data Management
14.2.2.1. Software
14.2.2.1.1. Corporate/Enterprise Data Management
14.2.2.1.2. Project Data Management
14.2.2.1.3. National Data Repository
14.2.2.2. Services
14.2.2.2.1. Consulting & Planning
14.2.2.2.2. Integration& Implementation
14.2.2.2.3. Operation & Maintenance
14.2.3. Direct Data Monetization
14.3. Data Business in Oil and Gas Market Size (US$ Mn) Forecast, by Oil Companies, 2016 - 2026
14.3.1. National Oil Companies
14.3.2. Independent Oil Companies
14.3.3. National Data Repository
14.4. Data Business in Oil and Gas Market Size (US$ Mn) Forecast, by Application, 2016 - 2026
14.4.1. Upstream
14.4.1.1. Conventional
14.4.1.2. Unconventional
14.4.2. Midstream
14.4.3. Downstream
14.5. Upstream Data Business in Oil and Gas Market Size (US$ Mn) Forecast, by E&P Lifecycle, 2016 - 2026
14.5.1. Exploration
14.5.2. Development
14.5.3. Production
14.6. Data Business in Oil and Gas Market Size (US$ Mn) Forecast, by Country, 2016 - 2026
14.6.1. Brazil
14.6.2. Rest of South America
14.7. Market Attractiveness Analysis
14.7.1. By Component
14.7.2. By Oil Companies
14.7.3. By Application
14.7.4. By E&P Lifecycle
14.7.5. By Country
15. Competition Landscape
15.1. Market Player – Competition Matrix
15.2. Market Share Analysis by Company (2017)
15.3. Big Data Company Profiles
15.3.1. Accenture
15.3.1.1. Overview
15.3.1.2. Key Competitors
15.3.1.3. Financial Overview
15.3.1.4. Strategy
15.3.1.5. Recent Developments
15.3.2. Datameer
15.3.2.1. Overview
15.3.2.2. Key Competitors
15.3.2.3. Financial Overview
15.3.2.4. Strategy
15.3.2.5. Recent Developments
15.3.3. Datawatch
15.3.3.1. Overview
15.3.3.2. Key Competitors
15.3.3.3. Financial Overview
15.3.3.4. Strategy
15.3.3.5. Recent Developments
15.3.4. Drillinginfo Inc.
15.3.4.1. Overview
15.3.4.2. Key Competitors
15.3.4.3. Financial Overview
15.3.4.4. Strategy
15.3.4.5. Recent Developments
15.3.5. General Electric
15.3.5.1. Overview
15.3.5.2. Key Competitors
15.3.5.3. Financial Overview
15.3.5.4. Strategy
15.3.5.5. Recent Developments
15.3.6. Hitachi Vantara Corporation
15.3.6.1. Overview
15.3.6.2. Key Competitors
15.3.6.3. Financial Overview
15.3.6.4. Strategy
15.3.6.5. Recent Developments
15.3.7. Hortonworks Inc.
15.3.7.1. Overview
15.3.7.2. Key Competitors
15.3.7.3. Financial Overview
15.3.7.4. Strategy
15.3.7.5. Recent Developments
15.3.8. International Business Machines Corporation
15.3.8.1. Overview
15.3.8.2. Key Competitors
15.3.8.3. Financial Overview
15.3.8.4. Strategy
15.3.8.5. Recent Developments
15.3.9. MapR Technologies, Inc.
15.3.9.1. Overview
15.3.9.2. Key Competitors
15.3.9.3. Financial Overview
15.3.9.4. Strategy
15.3.9.5. Recent Developments
15.3.10. Microsoft Corporation
15.3.10.1. Overview
15.3.10.2. Key Competitors
15.3.10.3. Financial Overview
15.3.10.4. Strategy
15.3.10.5. Recent Developments
15.3.11. Northwest Analytics Inc.
15.3.11.1. Overview
15.3.11.2. Key Competitors
15.3.11.3. Financial Overview
15.3.11.4. Strategy
15.3.11.5. Recent Developments
15.3.12. Oracle Corporation
15.3.12.1. Overview
15.3.12.2. Key Competitors
15.3.12.3. Financial Overview
15.3.12.4. Strategy
15.3.12.5. Recent Developments
15.3.13. OSI Soft
15.3.13.1. Overview
15.3.13.2. Key Competitors
15.3.13.3. Financial Overview
15.3.13.4. Strategy
15.3.13.5. Recent Developments
15.3.14. Palantir Economic Solutions Ltd
15.3.14.1. Overview
15.3.14.2. Key Competitors
15.3.14.3. Financial Overview
15.3.14.4. Strategy
15.3.14.5. Recent Developments
15.3.15. SAP SE
15.3.15.1. Overview
15.3.15.2. Key Competitors
15.3.15.3. Financial Overview
15.3.15.4. Strategy
15.3.15.5. Recent Developments
15.3.16. SAS Institute Inc.
15.3.16.1. Overview
15.3.16.2. Key Competitors
15.3.16.3. Financial Overview
15.3.16.4. Strategy
15.3.16.5. Recent Developments
15.3.17. Capgemini S.A.
15.3.17.1. Overview
15.3.17.2. Key Competitors
15.3.17.3. Financial Overview
15.3.17.4. Strategy
15.3.17.5. Recent Developments
15.3.18. Cloudera, Inc.
15.3.18.1. Overview
15.3.18.2. Key Competitors
15.3.18.3. Financial Overview
15.3.18.4. Strategy
15.3.18.5. Recent Developments
15.4. Data Management Company Profiles
15.4.1. EMC Corporation
15.4.1.1. Overview
15.4.1.2. Key Competitors
15.4.1.3. Financial Overview
15.4.1.4. Strategy
15.4.1.5. SWOT Analysis
15.4.2. Newgen Software, Inc.
15.4.2.1. Overview
15.4.2.2. Key Competitors
15.4.2.3. Financial Overview
15.4.2.4. Strategy
15.4.2.5. SWOT Analysis
15.4.3. Cisco Systems, Inc.
15.4.3.1. Overview
15.4.3.2. Key Competitors
15.4.3.3. Financial Overview
15.4.3.4. Strategy
15.4.3.5. SWOT Analysis
15.4.4. Tata Consultancy Services Ltd.
15.4.4.1. Overview
15.4.4.2. Key Competitors
15.4.4.3. Financial Overview
15.4.4.4. Strategy
15.4.4.5. SWOT Analysis
15.4.5. Halliburton
15.4.5.1. Overview
15.4.5.2. Key Competitors
15.4.5.3. Financial Overview
15.4.5.4. Strategy
15.4.5.5. SWOT Analysis
15.4.6. Informatica Corporation
15.4.6.1. Overview
15.4.6.2. Key Competitors
15.4.6.3. Financial Overview
15.4.6.4. Strategy
15.4.6.5. SWOT Analysis
15.4.7. Schlumberger Limited
15.4.7.1. Overview
15.4.7.2. Key Competitors
15.4.7.3. Financial Overview
15.4.7.4. Strategy
15.4.7.5. SWOT Analysis
15.5. Direct Data Monetization Company Profiles
15.5.1. National Data Repository, India
15.5.1.1. Overview
15.5.1.2. Key Competitors
15.5.1.3. Financial Overview
15.5.1.4. Strategy
15.5.1.5. Recent Developments
15.5.2. ION Geophysical Corporation
15.5.2.1. Overview
15.5.2.2. Key Competitors
15.5.2.3. Financial Overview
15.5.2.4. Strategy
15.5.2.5. Recent Developments
16. Key Takeaways
List of Tables
Table 1: Global Data Business in Oil and Gas Market Revenue (US$ Mn) Forecast, By Component, 2016 - 2026
Table 2: Global Data Business in Oil and Gas Market Revenue (US$ Mn) Forecast, By Big Data Software, 2016 - 2026
Table 3: Global Data Business in Oil and Gas Market Revenue (US$ Mn) Forecast, By Big Data Services, 2016 - 2026
Table 4: Global Data Business in Oil and Gas Market Revenue (US$ Mn) Forecast, By Data Management Software, 2016 - 2026
Table 5: Global Data Business in Oil and Gas Market Revenue (US$ Mn) Forecast, By Data Management Services, 2016 - 2026
Table 6: Global Data Business in Oil and Gas Market Revenue (US$ Mn) Forecast, By Oil companies, 2016 - 2026
Table 7: Global Data Business in Oil and Gas Market Revenue (US$ Mn) Forecast, By Application, 2016 - 2026
Table 8: Global Upstream Data Business in Oil and Gas Market Revenue (US$ Mn) Forecast, By E&P Lifecycle, 2016 - 2026
Table 9: Global Data Business in Oil and Gas Market Revenue (US$ Mn) Forecast, By Region, 2016 - 2026
Table 10: North America Data Business in Oil and Gas Market Revenue (US$ Mn) Forecast, By Component, 2016 - 2026
Table 11: North America Data Business in Oil and Gas Market Revenue (US$ Mn) Forecast, By Big Data Software, 2016 - 2026
Table 12: North America Data Business in Oil and Gas Market Revenue (US$ Mn) Forecast, By Big Data Services, 2016 - 2026
Table 13: North America Data Business in Oil and Gas Market Revenue (US$ Mn) Forecast, By Data Management Software, 2016 - 2026
Table 14: North America Data Business in Oil and Gas Market Revenue (US$ Mn) Forecast, By Data Management Services, 2016 - 2026
Table 15: North America Data Business in Oil and Gas Market Revenue (US$ Mn) Forecast, By Oil companies, 2016 - 2026
Table 16: North America Data Business in Oil and Gas Market Revenue (US$ Mn) Forecast, By Application, 2016 - 2026
Table 17: North America Upstream Data Business in Oil and Gas Market Revenue (US$ Mn) Forecast, By E&P Lifecycle, 2016 - 2026
Table 18: North America Data Business in Oil and Gas Market Revenue (US$ Mn) Forecast, By Country, 2016 - 2026
Table 19: Europe Data Business in Oil and Gas Market Revenue (US$ Mn) Forecast, By Component, 2016 - 2026
Table 20: Europe Data Business in Oil and Gas Market Revenue (US$ Mn) Forecast, By Big Data Software, 2016 - 2026
Table 21: Europe Data Business in Oil and Gas Market Revenue (US$ Mn) Forecast, By Big Data Services, 2016 - 2026
Table 22: Europe Data Business in Oil and Gas Market Revenue (US$ Mn) Forecast, By Data Management Software, 2016 - 2026
Table 23: Europe Data Business in Oil and Gas Market Revenue (US$ Mn) Forecast, By Data Management Services, 2016 - 2026
Table 24: Europe Data Business in Oil and Gas Market Revenue (US$ Mn) Forecast, By Oil companies, 2016 - 2026
Table 25: Europe Data Business in Oil and Gas Market Revenue (US$ Mn) Forecast, By Application, 2016 - 2026
Table 26: Europe Upstream Data Business in Oil and Gas Market Revenue (US$ Mn) Forecast, By E&P Lifecycle, 2016 - m 2026
Table 27: Europe Data Business in Oil and Gas Market Revenue (US$ Mn) Forecast, By Country, 2016 - 2026
Table 28: Asia Pacific Data Business in Oil and Gas Market Revenue (US$ Mn) Forecast, By Component, 2016 - 2026
Table 29: Asia Pacific Data Business in Oil and Gas Market Revenue (US$ Mn) Forecast, By Big Data Software, 2016 - 2026
Table 30: Asia Pacific Data Business in Oil and Gas Market Revenue (US$ Mn) Forecast, By Big Data Services, 2016 - 2026
Table 31: Asia Pacific Data Business in Oil and Gas Market Revenue (US$ Mn) Forecast, By Data Management Software, 2016 - 2026
Table 32: Asia Pacific Data Business in Oil and Gas Market Revenue (US$ Mn) Forecast, By Data Management Services, 2016 - 2026
Table 33: Asia Pacific Data Business in Oil and Gas Market Revenue (US$ Mn) Forecast, By Oil companies, 2016 - 2026
Table 34: Asia Pacific Data Business in Oil and Gas Market Revenue (US$ Mn) Forecast, By Application, 2016 - 2026
Table 35: Asia Pacific Upstream Data Business in Oil and Gas Market Revenue (US$ Mn) Forecast, By E&P Lifecycle, 2016 - 2026
Table 36: North America Data Business in Oil and Gas Market Revenue (US$ Mn) Forecast, By Country, 2016 - 2026
Table 37: Middle East and Africa (MEA) Data Business in Oil and Gas Market Revenue (US$ Mn) Forecast, By Component, 2016 - 2026
Table 38: Middle East and Africa (MEA) Data Business in Oil and Gas Market Revenue (US$ Mn) Forecast, By Big Data Software, 2016 - 2026
Table 39: Middle East and Africa (MEA) Data Business in Oil and Gas Market Revenue (US$ Mn) Forecast, By Big Data Services, 2016 - 2026
Table 40: Middle East and Africa (MEA) Data Business in Oil and Gas Market Revenue (US$ Mn) Forecast, By Data Management Software, 2016 - 2026
Table 41: Middle East and Africa (MEA) Data Business in Oil and Gas Market Revenue (US$ Mn) Forecast, By Data Management Services, 2016 - 2026
Table 42: Middle East and Africa (MEA) Data Business in Oil and Gas Market Revenue (US$ Mn) Forecast, By Oil companies, 2016 - 2026
Table 43: Middle East and Africa (MEA) Data Business in Oil and Gas Market Revenue (US$ Mn) Forecast, By Application, 2016 - 2026
Table 44: Middle East and Africa (MEA) Upstream Data Business in Oil and Gas Market Revenue (US$ Mn) Forecast, By E&P Lifecycle, 2016 - 2026
Table 45: North America Data Business in Oil and Gas Market Revenue (US$ Mn) Forecast, By Country, 2016 - 2026
Table 46: South America Data Business in Oil and Gas Market Revenue (US$ Mn) Forecast, By Component, 2016 - 2026
Table 47: South America Data Business in Oil and Gas Market Revenue (US$ Mn) Forecast, By Big Data Software, 2016 - 2026
Table 48: South America Data Business in Oil and Gas Market Revenue (US$ Mn) Forecast, By Big Data Services, 2016 - 2026
Table 49: South America Data Business in Oil and Gas Market Revenue (US$ Mn) Forecast, By Data Management Software, 2016 - 2026
Table 50: South America Data Business in Oil and Gas Market Revenue (US$ Mn) Forecast, By Data Management Services, 2016 - 2026
Table 51: South America Data Business in Oil and Gas Market Revenue (US$ Mn) Forecast, By Oil companies, 2016 - 2026
Table 52: South America Data Business in Oil and Gas Market Revenue (US$ Mn) Forecast, By Application, 2016 - 2026
Table 53: South America Upstream Data Business in Oil and Gas Market Revenue (US$ Mn) Forecast, By E&P Lifecycle, 2016 - 2026
Table 54: North America Data Business in Oil and Gas Market Revenue (US$ Mn) Forecast, By Country, 2016 - 2026
List of Figures
Figure 1: Research Methodology
Figure 2: Global Data Business in Oil and Gas Market
Figure 3: World GDP Indicator
Figure 4: Global ICT Spending (US$ Bn), 2015 - 2017
Figure 5: Global Oil and Gas CAPEX (US$ Mn), 2015 – 2017
Figure 6: Global Oil and Gas IT Spending (US$ Mn), 2015 – 2017
Figure 7: Global Oil and Gas IT Spending, By Type (US$ Mn)
Figure 8: Global Oil and Gas IT Spending, By Type (% Share)
Figure 9: Market Revenue Analysis, 2012-2017 (US$ Mn)
Figure 10: Historic growth trends, 2012-2017
Figure 11: Market Volume Analysis, 2018-2026 (US$ Mn)
Figure 12: Forecast growth trends, 2018-2026
Figure 13: Global Data Business in Oil and Gas Market Revenue (US$ Mn) and Y-o-Y Forecast, 2018– 2026
Figure 14: Global Data Business in Oil and Gas Opportunity Growth Analysis (US$ Mn) Forecast, 2016 – 2026
Figure 15: Global Data Business in Oil and Gas Market Share Analysis, By Component (2018)
Figure 16: Global Data Business in Oil and Gas Market Share Analysis, By Component (2026)
Figure 17: Global Data Business in Oil and Gas Market Share Analysis, By Big Data Software (2018)
Figure 18: Global Data Business in Oil and Gas Market Share Analysis, By Big Data Software (2026)
Figure 19: Global Data Business in Oil and Gas Market Share Analysis, By Big Data Services (2018)
Figure 20: Global Data Business in Oil and Gas Market Share Analysis, By Big Data Services (2026)
Figure 21: Global Data Business in Oil and Gas Market Share Analysis, By Data Management Software (2018)
Figure 22: Global Data Business in Oil and Gas Market Share Analysis, By Data Management Software (2026)
Figure 23: Global Data Business in Oil and Gas Market Share Analysis, By Data Management Services (2018)
Figure 24: Global Data Business in Oil and Gas Market Share Analysis, By Data Management Services (2026)
Figure 25: Global Data Business in Oil and Gas Market Attractiveness Analysis, By Component, 2016 - 2026
Figure 26: Global Data Business in Oil and Gas Market Attractiveness Analysis, By Big Data Software, 2016 - 2026
Figure 27: Global Data Business in Oil and Gas Market Attractiveness Analysis, By Big Data Services, 2016 - 2026
Figure 28: Global Data Business in Oil and Gas Market Attractiveness Analysis, By Data Management Software, 2016 – 2026
Figure 29: Global Data Business in Oil and Gas Market Attractiveness Analysis, By Data Management Services, 2016 – 2026
Figure 30: Global Data Business in Oil and Gas Market Share Analysis, By Oil Companies (2018)
Figure 31: Global Data Business in Oil and Gas Market Share Analysis, By Companies (2026)
Figure 32: Global Data Business in Oil and Gas Market Attractiveness Analysis, By Oil Companies, 2016 - 2026
Figure 33: Global Data Business in Oil and Gas Market Share Analysis, By Application (2018)
Figure 34: Global Data Business in Oil and Gas Market Share Analysis, By Application (2026)
Figure 35: Global Upstream Data Business in Oil and Gas Market Share Analysis, By E&P Lifecycle (2018)
Figure 36: Global Upstream Data Business in Oil and Gas Market Share Analysis, By E&P Lifecycle (2026)
Figure 37: Global Data Business in Oil and Gas Market Attractiveness Analysis, By Application, 2016 - 2026
Figure 38: Global Upstream Data Business in Oil and Gas Market Attractiveness Analysis, By E&P Lifecycle, 2016 - 2026
Figure 39: Global Data Business in Oil and Gas Market Share Analysis, By Region (2018)
Figure 40: Global Data Business in Oil and Gas Market Share Analysis, By Region (2026)
Figure 41: Global Data Business in Oil and Gas Market Attractiveness Analysis, by Region
Figure 42: North America Data Business in Oil and Gas Market Revenue (US$ Mn) and Y-o-Y Forecast, 2018– 2026
Figure 43: North America Data Business in Oil and Gas Opportunity Growth Analysis (US$ Mn) Forecast, 2016 – 2026
Figure 44: North America Data Business in Oil and Gas Market Share Analysis, By Component (2018)
Figure 45: North America Data Business in Oil and Gas Market Share Analysis, By Component (2026)
Figure 46: North America Data Business in Oil and Gas Market Share Analysis, By Big Data Software (2018)
Figure 47: North America Data Business in Oil and Gas Market Share Analysis, By Big Data Software (2026)
Figure 48: North America Data Business in Oil and Gas Market Share Analysis, By Big Data Services (2018)
Figure 49: North America Data Business in Oil and Gas Market Share Analysis, By Big Data Services (2026)
Figure 50: North America Data Business in Oil and Gas Market Share Analysis, By Data Management Software (2018)
Figure 51: North America Data Business in Oil and Gas Market Share Analysis, By Data Management Software (2026)
Figure 52: North America Data Business in Oil and Gas Market Share Analysis, By Data Management Services (2018)
Figure 53: North America Data Business in Oil and Gas Market Share Analysis, By Data Management Services (2026)
Figure 54: North America Data Business in Oil and Gas Market Share Analysis, By Oil Companies (2018)
Figure 55: North America Data Business in Oil and Gas Market Share Analysis, By Oil Companies (2026)
Figure 56: North America Data Business in Oil and Gas Market Share Analysis, By Application (2018)
Figure 57: North America Data Business in Oil and Gas Market Share Analysis, By Application (2026)
Figure 58: North America Upstream Data Business in Oil and Gas Market Share Analysis, By E&P Lifecycle (2018)
Figure 59: North America Upstream Data Business in Oil and Gas Market Share Analysis, By E&P Lifecycle (2026)
Figure 60: North America Data Business in Oil and Gas Market Share Analysis, By Country (2018)
Figure 61: North America Data Business in Oil and Gas Market Share Analysis, By Country (2026)
Figure 62: North America Data Business in Oil and Gas Market Attractiveness Analysis, By Component, 2016 - 2026
Figure 63: North America Data Business in Oil and Gas Market Attractiveness Analysis, By Big Data Software, 2016 - 2026
Figure 64: North America Data Business in Oil and Gas Market Attractiveness Analysis, By Big Data Services, 2016 - 2026
Figure 65: North America Data Business in Oil and Gas Market Attractiveness Analysis, By Data Management Software, 2016 - 2026
Figure 66: North America Data Business in Oil and Gas Market Attractiveness Analysis, By Data Management Services, 2016 - 2026
Figure 67: North America Data Business in Oil and Gas Market Attractiveness Analysis, By Oil Companies, 2016 - 2026
Figure 68: North America Data Business in Oil and Gas Market Attractiveness Analysis, By Application, 2016 - 2026
Figure 69: North America Upstream Data Business in Oil and Gas Market Attractiveness Analysis, By E&P Lifecycle, 2016 – 2026
Figure 70: North America Data Business in Oil and Gas Market Attractiveness Analysis, by Country
Figure 71: Europe Data Business in Oil and Gas Market Revenue (US$ Mn) and Y-o-Y Forecast, 2018– 2026
Figure 72: Europe Data Business in Oil and Gas Opportunity Growth Analysis (US$ Mn) Forecast, 2016 – 2026
Figure 73: Europe Data Business in Oil and Gas Market Share Analysis, By Component (2018)
Figure 74: Europe Data Business in Oil and Gas Market Share Analysis, By Component (2026)
Figure 75: Europe Data Business in Oil and Gas Market Share Analysis, By Big Data Software (2018)
Figure 76: Europe Data Business in Oil and Gas Market Share Analysis, By Big Data Software (2026)
Figure 77: Europe Data Business in Oil and Gas Market Share Analysis, By Big Data Services (2018)
Figure 78: Europe Data Business in Oil and Gas Market Share Analysis, By Big Data Services (2026)
Figure 79: Europe Data Business in Oil and Gas Market Share Analysis, By Data Management Software (2018)
Figure 80: Europe Data Business in Oil and Gas Market Share Analysis, By Data Management Software (2026)
Figure 81: Europe Data Business in Oil and Gas Market Share Analysis, By Data Management Services (2018)
Figure 82: Europe Data Business in Oil and Gas Market Share Analysis, By Data Management Services (2026)
Figure 83: Europe Data Business in Oil and Gas Market Share Analysis, By Oil Companies (2018)
Figure 84: Europe Data Business in Oil and Gas Market Share Analysis, By Oil Companies (2026)
Figure 85: Europe Data Business in Oil and Gas Market Share Analysis, By Application (2018)
Figure 86: Europe Data Business in Oil and Gas Market Share Analysis, By Application (2026)
Figure 87: Europe Upstream Data Business in Oil and Gas Market Share Analysis, By E&P Lifecycle (2018)
Figure 88: Europe Upstream Data Business in Oil and Gas Market Share Analysis, By E&P Lifecycle (2026)
Figure 89: Europe Data Business in Oil and Gas Market Share Analysis, By Country (2018)
Figure 90: Europe Data Business in Oil and Gas Market Share Analysis, By Country (2026)
Figure 91: Europe Data Business in Oil and Gas Market Attractiveness Analysis, By Component, 2016 - 2026
Figure 92: Europe Data Business in Oil and Gas Market Attractiveness Analysis, By Big Data Software, 2016 - 2026
Figure 93: Europe Data Business in Oil and Gas Market Attractiveness Analysis, By Big Data Services, 2016 - 2026
Figure 94: Europe Data Business in Oil and Gas Market Attractiveness Analysis, By Data Management Software, 2016 – 2026
Figure 95: Europe Data Business in Oil and Gas Market Attractiveness Analysis, By Data Management Services, 2016 – 2026
Figure 96: Europe Data Business in Oil and Gas Market Attractiveness Analysis, By Oil Companies, 2016 - 2026
Figure 97: Europe Data Business in Oil and Gas Market Attractiveness Analysis, By Application, 2016 - 2026
Figure 98: Europe Upstream Data Business in Oil and Gas Market Attractiveness Analysis, By E&P Lifecycle, 2016 - 2026
Figure 99: Europe Data Business in Oil and Gas Market Attractiveness Analysis, by Country
Figure 100: Asia Pacific Data Business in Oil and Gas Market Revenue (US$ Mn) and Y-o-Y Forecast, 2018– 2026
Figure 101: Asia Pacific Data Business in Oil and Gas Opportunity Growth Analysis (US$ Mn) Forecast, 2016 – 2026
Figure 102: Asia Pacific Data Business in Oil and Gas Market Share Analysis, By Component (2018)
Figure 103: Asia Pacific Data Business in Oil and Gas Market Share Analysis, By Component (2026)
Figure 104: Asia Pacific Data Business in Oil and Gas Market Share Analysis, By Big Data Software (2018)
Figure 105: Asia Pacific Data Business in Oil and Gas Market Share Analysis, By Big Data Software (2026)
Figure 106: Asia Pacific Data Business in Oil and Gas Market Share Analysis, By Big Data Services (2018)
Figure 107: Asia Pacific Data Business in Oil and Gas Market Share Analysis, By Big Data Services (2026)
Figure 108: Asia Pacific Data Business in Oil and Gas Market Share Analysis, By Data Management Software (2018)
Figure 109: Asia Pacific Data Business in Oil and Gas Market Share Analysis, By Data Management Software (2026)
Figure 110: Asia Pacific Data Business in Oil and Gas Market Share Analysis, By Data Management Services (2018)
Figure 111: Asia Pacific Data Business in Oil and Gas Market Share Analysis, By Data Management Services (2026)
Figure 112: Asia Pacific Data Business in Oil and Gas Market Share Analysis, By Oil Companies (2018)
Figure 113: Asia Pacific Data Business in Oil and Gas Market Share Analysis, By Oil Companies (2026)
Figure 114: Asia Pacific Data Business in Oil and Gas Market Share Analysis, By Application (2018)
Figure 115: Asia Pacific Data Business in Oil and Gas Market Share Analysis, By Application (2026)
Figure 116: Asia Pacific Upstream Data Business in Oil and Gas Market Share Analysis, By E&P Lifecycle (2018)
Figure 117: Asia Pacific Upstream Data Business in Oil and Gas Market Share Analysis, By E&P Lifecycle (2026)
Figure 118: North America Data Business in Oil and Gas Market Share Analysis, By Country (2018)
Figure 119: North America Data Business in Oil and Gas Market Share Analysis, By Country (2026)
Figure 120: Asia Pacific Data Business in Oil and Gas Market Attractiveness Analysis, By Component, 2016 - 2026
Figure 121: Asia Pacific Data Business in Oil and Gas Market Attractiveness Analysis, By Big Data Software, 2016 - 2026
Figure 122: Asia Pacific Data Business in Oil and Gas Market Attractiveness Analysis, By Big Data Services, 2016 - 2026
Figure 123: Asia Pacific Data Business in Oil and Gas Market Attractiveness Analysis, By Data Management Software, 2016 - 2026
Figure 124: Asia Pacific Data Business in Oil and Gas Market Attractiveness Analysis, By Data Management Services, 2016 - 2026
Figure 125: Asia Pacific Data Business in Oil and Gas Market Attractiveness Analysis, By Oil Companies, 2016 - 2026
Figure 126: Asia Pacific Data Business in Oil and Gas Market Attractiveness Analysis, By Application, 2016 - 2026
Figure 127: Asia Pacific Upstream Data Business in Oil and Gas Market Attractiveness Analysis, By E&P Lifecycle, 2016 - 2026
Figure 128: Asia Pacific Data Business in Oil and Gas Market Attractiveness Analysis, by Country
Figure 129: Middle East & Africa Data Business in Oil and Gas Market Revenue (US$ Mn) and Y-o-Y Forecast, 2018– 2026
Figure 130: Middle East & Africa Data Business in Oil and Gas Opportunity Growth Analysis (US$ Mn) Forecast, 2016 – 2026
Figure 131: Middle East and Africa (MEA) Data Business in Oil and Gas Market Share Analysis, By Component (2018)
Figure 132: Middle East and Africa (MEA) Data Business in Oil and Gas Market Share Analysis, By Component (2026)
Figure 133: Middle East and Africa (MEA) Data Business in Oil and Gas Market Share Analysis, By Big Data Software (2018)
Figure 134: Middle East and Africa (MEA) Data Business in Oil and Gas Market Share Analysis, By Big Data Software (2026)
Figure 135: Middle East and Africa (MEA) Data Business in Oil and Gas Market Share Analysis, By Big Data Services (2018)
Figure 136: Middle East and Africa (MEA) Data Business in Oil and Gas Market Share Analysis, By Big Data Services (2026)
Figure 137: Middle East and Africa (MEA) Data Business in Oil and Gas Market Share Analysis, By Data Management Software (2018)
Figure 138: Middle East and Africa (MEA) Data Business in Oil and Gas Market Share Analysis, By Data Management Software (2026)
Figure 139: Middle East and Africa (MEA) Data Business in Oil and Gas Market Share Analysis, By Data Management Services (2018)
Figure 140: Middle East and Africa (MEA) Data Business in Oil and Gas Market Share Analysis, By Data Management Services (2026)
Figure 141: Middle East and Africa (MEA) Data Business in Oil and Gas Market Share Analysis, By Oil Companies (2018)
Figure 142: Middle East and Africa (MEA) Data Business in Oil and Gas Market Share Analysis, By Oil Companies (2026)
Figure 143: Middle East and Africa (MEA) Data Business in Oil and Gas Market Share Analysis, By Application (2018)
Figure 144: Middle East and Africa (MEA) Data Business in Oil and Gas Market Share Analysis, By Application (2026)
Figure 145: Middle East and Africa (MEA) Upstream Data Business in Oil and Gas Market Share Analysis, By E&P Lifecycle (2018)
Figure 146: Middle East and Africa (MEA) Upstream Data Business in Oil and Gas Market Share Analysis, By E&P Lifecycle (2026)
Figure 147: North America Data Business in Oil and Gas Market Share Analysis, By Country (2018)
Figure 148: North America Data Business in Oil and Gas Market Share Analysis, By Country (2026)
Figure 149: Middle East and Africa (MEA) Data Business in Oil and Gas Market Attractiveness Analysis, By Component, 2016 - 2026
Figure 150: Middle East and Africa (MEA) Data Business in Oil and Gas Market Attractiveness Analysis, By Big Data Software, 2016 - 2026
Figure 151: Middle East and Africa (MEA) Data Business in Oil and Gas Market Attractiveness Analysis, By Big Data Services, 2016 - 2026
Figure 152: Middle East and Africa (MEA) Data Business in Oil and Gas Market Attractiveness Analysis, By Data Management Software, 2016 - 2026
Figure 153: Middle East and Africa (MEA) Data Business in Oil and Gas Market Attractiveness Analysis, By Data Management Services, 2016 - 2026
Figure 154: Middle East and Africa (MEA) Data Business in Oil and Gas Market Attractiveness Analysis, By Oil Companies, 2016 - 2026
Figure 155: Middle East and Africa (MEA) Data Business in Oil and Gas Market Attractiveness Analysis, By Application, 2016 - 2026
Figure 156: Middle East and Africa (MEA) Upstream Data Business in Oil and Gas Market Attractiveness Analysis, By E&P Lifecycle, 2016 - 2026
Figure 157: Middle East and Africa (MEA) Data Business in Oil and Gas Market Attractiveness Analysis, By Country
Figure 158: South America Data Business in Oil and Gas Market Revenue (US$ Mn) and Y-o-Y Forecast, 2018– 2026
Figure 159: South America Data Business in Oil and Gas Opportunity Growth Analysis (US$ Mn) Forecast, 2016 – 2026
Figure 160: South America Data Business in Oil and Gas Market Share Analysis, By Component (2018)
Figure 161: South America Data Business in Oil and Gas Market Share Analysis, By Component (2026)
Figure 162: South America Data Business in Oil and Gas Market Share Analysis, By Big Data Software (2018)
Figure 163: South America Data Business in Oil and Gas Market Share Analysis, By Big Data Software (2026)
Figure 164: South America Data Business in Oil and Gas Market Share Analysis, By Big Data Services (2018)
Figure 165: South America Data Business in Oil and Gas Market Share Analysis, By Big Data Services (2026)
Figure 166: South America Data Business in Oil and Gas Market Share Analysis, By Data Management Software (2018)
Figure 167: South America Data Business in Oil and Gas Market Share Analysis, By Data Management Software (2026)
Figure 168: South America Data Business in Oil and Gas Market Share Analysis, By Data Maangement Services (2018)
Figure 169: South America Data Business in Oil and Gas Market Share Analysis, By Data Management Services (2026)
Figure 170: South America Data Business in Oil and Gas Market Share Analysis, By Oil Companies (2018)
Figure 171: South America Data Business in Oil and Gas Market Share Analysis, By Oil Companies (2026)
Figure 172: South America Data Business in Oil and Gas Market Share Analysis, By Application (2018)
Figure 173: South America Data Business in Oil and Gas Market Share Analysis, By Application (2026)
Figure 174: South America Upstream Data Business in Oil and Gas Market Share Analysis, By E&P Lifecycle (2018)
Figure 175: South America Upstream Data Business in Oil and Gas Market Share Analysis, By E&P Lifecycle (2026)
Figure 176: North America Data Business in Oil and Gas Market Share Analysis, By Country (2018)
Figure 177: North America Data Business in Oil and Gas Market Share Analysis, By Country (2026)
Figure 178: South America Data Business in Oil and Gas Market Attractiveness Analysis, By Component, 2016 - 2026
Figure 179: South America Data Business in Oil and Gas Market Attractiveness Analysis, By Big Data Software, 2016 – 2026
Figure 180: South America Data Business in Oil and Gas Market Attractiveness Analysis, By Big Data Services, 2016 – 2026
Figure 181: South America Data Business in Oil and Gas Market Attractiveness Analysis, By Data Management Software, 2016 - 2026
Figure 182: South America Data Business in Oil and Gas Market Attractiveness Analysis, By Data Management Services, 2016 - 2026
Figure 183: South America Data Business in Oil and Gas Market Attractiveness Analysis, By Oil Companies, 2016 - 2026
Figure 184: South America Data Business in Oil and Gas Market Attractiveness Analysis, By Application, 2016 - 2026
Figure 185: South America Upstream Data Business in Oil and Gas Market Attractiveness Analysis, By E&P Lifecycle, 2016 - 2026
Figure 186: South America Data Business in Oil and Gas Market Attractiveness Analysis, By Country
Copyright © Transparency Market Research, Inc. All Rights reserved
Trust Online

Data Business in Oil and Gas Market