
Reports
Reports
Oil and GasData Monetization Market - Snapshot
Oil and gas companies are turning the large volume and variety of data into intelligence for improved asset productivity. Real-time data analysis is essential for deriving value out of unstructured data generated from sensors present in the oil field. Predictive and prescriptive analytics are the approaches that help oil and gas companies to minimize expenses and earn money by turning this data into valuable assets.The creation and consumption of data continues to grow in the oil and gas industry and with it, the investment in data analytics and data management software and services. Data monetization can be used to leverage insights to identify new revenue opportunities, trigger product, process & service innovation and optimization, improve production, and enhance service quality in the oil and gas industry. Large proven oil reserves in Venezuela, Saudi Arabia, Canada, Iran, Iraq, Kuwait, UAE, Russia, the U.S. and China brings an opportunity to drive growth of the oil and gas data monetization market as there is significant growth opportunity for adoption of indirect data monetization i.e. the software and services for driving insights for development of these fields and direct data monetization i.e. mainly the exploration data products. Seismic surveys and geophysical surveys conducted in these regions to find new exploration sites and their potential, and the anticipated use of software solutions will continue to drive the market over the forecast period.
The data monetization in oil and gas market is segmented based on method, component, oil companies, application, E&P lifecycle, and region. The oil and gas data monetization market has two methods of monetization viz., direct and indirect. By component, the market is segmented as data-as-a-service, professional services, and platform/software. Data-as-a-service segment covers data exchange/transaction for direct monetary benefits. Platform/software and professional services represent indirect data monetization. The oil and gas data monetization market is also segmented based on upstream oil companies into National Oil Companies (NOCs), Independent Oil Companies (IOCs), National Data Repository (NDR), and oil and gas service companies. National Oil Companies (NOCs) segment is majorly driven by indirect data monetization and is anticipated to dominate the global oil and gas data monetization market over the forecast period. NOCs are increasingly spending on software/platforms and services, thus accounting for the maximum share in the data monetization market. Further, by application, the market is segmented into upstream (conventional, unconventional), midstream, and downstream. It is anticipated that the upstream application segment will continue to dominate the market over the forecast period. Upstream application segment is also classified by E&P lifecycle into exploration, development, and production segments. Exploration segment is expected to expand over the forecast period driven mainly by increasing adoption of software and solutions in deep-water exploration and shale gas exploration activities.The increasing demand for data products such as seismic survey data, geophysical data, and magnetic survey data is also driving the exploration segment in the data monetization market.
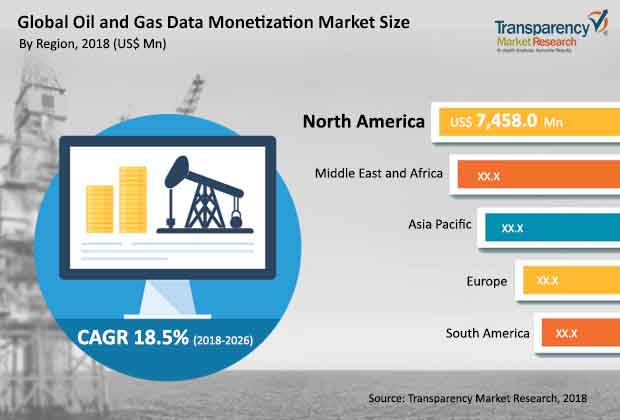
Regional segmentation of the oil and gas data monetization market includes North America, Europe, Asia Pacific, South America, and Middle East & Africa (MEA). North America is projected to dominate the oil and gas data monetization market throughout the forecast period due to availability of necessary infrastructure, increasing oil production, and use of indirect data monetization solutions for shale oil reserves exploration, development & production,and presence of oil and gas service companies involved in direct data monetization. Asia Pacific is expected tobe the fastest growing region during the forecast period due to rising investments in the E&P sector.
Key players in the oil and gas data monetization market are Halliburton, Schlumberger Limited,Informatica Corporation, SAP SE, Oracle Corporation, Accentureplc, IBM Corporation, EMC Corporation, Microsoft Corporation, Tata Consultancy Services Ltd., Datawatch, Drillinginfo, Hitachi VantaraCorporation, Hortonworks, Inc.,Capgemini SE, Newgen Software, Inc., Cloudera, Inc., Cisco Software, Inc.,SAS Institute, Inc.,MapR Technologies, Inc., Palantir Solutions, OSIsoft LLC, Infosys Limited, and NETSCOUT among others. Along with the players mentioned above, the market share analysis of direct data monetization players such as TGS, CGG, PGS, Ion Geophysical Corporation, and Western Geo is also provided separately in the report.
Focus on Asset Productivity to Expand Horizon in Oil and Gas Data Monetization Market
Oil and gas companies have in recent years have witnessed the transformative potential of advanced data analytics to make decisions across the entire value chain. Two recent developments have become the lynchpin of growing investment potential in the software and services used for monetizing data, directly or indirectly. The demand in oil and gas data monetization market has thrived on the back growing promise of data analytics to boost asset productivity on one hand to combat the declining profits. Over the years, the oil and gas companies have suffered some serious challenges arising out of the fact that hydrocarbon production is declining in popularity. Data analytics are viewed as new framework for decisions that will allow them to reinvigorate their growth strategies. Stalwarts in the oil and gas exploration and production have already leveraged the advantage by collaborating with oil and gas service companies. Asset management, notably predictive and preventive management, is become one of the key objectives for data monetization trends. Various areas including portfolio management and operations management are unlocking the unique value propositions of data analytics. This is a key trend shaping the expansion of the oil and gas data monetization market.
The Covid-19 pandemic has brought several unprecedented challenges to economic growth across the world. Several nations have witnessed the disruptive potential of the still-emerging pandemic on the firms’ production, major business models across key sectors, and strategic frameworks for meeting the end users’ demands. The pandemic has hit the bottom-line of many companies and organizations across almost all industries. The oil and gas data monetization market has also seen some notable upheavals, and have begun looking for frameworks to absorb the macroeconomics and microeconomics shocks. Thus, approaches to harness RoI have changed dramatically in numerous industries, including for upstream and downstream players in the oil and gas sector. Further, the data-driven decisions are expected to become more important than ever, given the uncertainties prevalent in the post-pandemic world.
1. Preface
1.1. Market Scope
1.2. Market Segmentation
1.3. Key Research Objectives
2. Assumptions and Research Methodology
2.1. Research Methodology
2.1.1. List of Primary and Secondary Sources
2.2. Key Assumptions for Data Modeling
3. Executive Summary: Global Oil and Gas Data Monetization Market
4. Market Overview
4.1. Introduction
4.2. Key Findings
4.3. Global Market – Macro Economic Factors Overview
4.3.1. World GDP Indicator – For Top 20 Economies
4.3.2. Global IT Spending in Oil and Gas (US$ Mn), 2015, 2016, 2017
4.4. Market Factor Analysis
4.4.1. Porter’s Five Forces Analysis
4.4.2. Value Chain Analysis
4.4.3. Key Market Indicators
4.4.3.1. Multi-client Data Services in Oil and Gas Direct Data Monetization Market
4.4.3.2. Global Oil and Gas Well Data, By Country (2016)
4.4.4. Market Dynamics (Growth Influencers)
4.4.4.1. Drivers
4.4.4.2. Restraints
4.4.4.3. Opportunities
4.4.4.4. Impact Analysis of Drivers & Restraints
4.4.4.5. Key Trends
4.5. Global Oil and Gas Data Monetization Market Analysis and Forecast, 2016 - 2026
4.5.1. Market Revenue Analysis (US$ Mn)
4.5.1.1. Historic growth trends, 2012-2017
4.5.1.2. Forecast trends, 2017-2026
4.6. Market Outlook
5. Global Oil and Gas Data Monetization Market Analysis and Forecasts, byMethod
5.1. Definitions
5.2. Market Size (US$ Mn) Forecast by Method, 2016-2026
5.2.1. Indirect Data Monetization
5.2.2. Direct Data Monetization
5.3. Market Attractiveness By Method
6. Global Oil and Gas Data Monetization Market Analysis and Forecasts, by Component
6.1. Definitions
6.2. Market Size (US$ Mn) Forecast byComponent, 2016-2026
6.2.1. Data as a Service
6.2.2. Professional Services
6.2.3. Platform/Software
6.3. Market Attractiveness by Component
7. Global Oil and Gas Direct Data Monetization Market Analysis and Forecasts, byApplication
7.1. Definitions
7.2. Market Size (US$ Mn) Forecast byApplication, 2016-2026
7.2.1. Upstream
7.2.1.1. Conventional
7.2.1.2. Unconventional
7.2.2. Midstream
7.2.3. Downstream
7.3. Market Attractiveness by Application
8. Global Oil and Gas Indirect Data Monetization Market Analysis and Forecasts, byApplication
8.1. Definitions
8.2. Market Size (US$ Mn) Forecast byApplication, 2016-2026
8.2.1. Upstream
8.2.1.1. Conventional
8.2.1.2. Unconventional
8.2.2. Midstream
8.2.3. Downstream
8.3. Market Attractiveness by Application
9. Global Upstream Oil and Gas Direct Data Monetization Market Analysis and Forecasts, byE&P Lifecycle
9.1. Definitions
9.2. Market Size (US$ Mn) Forecast by E&P Lifecycle, 2016-2026
9.2.1. Exploration
9.2.2. Development
9.2.3. Production
9.3. Market Attractiveness by E&P Lifecycle
10. Global Upstream Oil and Gas Indirect Data Monetization Market Analysis and Forecasts, by E&P Lifecycle
10.1. Definitions
10.2. Market Size (US$ Mn) Forecast by E&P Lifecycle, 2016-2026
10.2.1. Exploration
10.2.2. Development
10.2.3. Production
10.3. Market Attractiveness by E&P Lifecycle
11. Global Upstream Oil and Gas Direct Data Monetization Market Analysis and Forecasts, byOil Companies
11.1. Definitions
11.2. Market Size (US$ Mn) Forecast by Oil Companies, 2016-2026
11.2.1. National Oil Companies
11.2.2. Independent Oil Companies
11.2.3. National Data Repository
11.2.4. Oil and Gas Service Company
11.3. Market Attractiveness by Oil Companies
12. Global Upstream Oil and Gas Indirect Data Monetization Market Analysis and Forecasts, byOil Companies
12.1. Definitions
12.2. Market Size (US$ Mn) Forecast by Oil Companies, 2016-2026
12.2.1. National Oil Companies
12.2.2. Independent Oil Companies
12.2.3. National Data Repository
12.2.4. Oil and Gas Service Company
12.3. Market Attractiveness by Oil Companies
13. Global Oil and Gas Data Monetization Market Analysis and Forecast, by Country
13.1. Overview
13.2. Oil and Gas Data Monetization Market Size (US$ Mn) Forecast, by Country, 2016 - 2026
13.2.1. The U.S.
13.2.2. Canada
13.2.3. Rest of North America
13.2.4. Germany
13.2.5. France
13.2.6. UK
13.2.7. Rest of Europe
13.2.8. China
13.2.9. Japan
13.2.10. India
13.2.11. Australia
13.2.12. Rest of Asia Pacific
13.2.13. GCC
13.2.14. South Africa
13.2.15. Rest of MEA
13.2.16. Brazil
13.2.17. Rest of South America
13.3. Market Attractiveness by Country
14. The U.S.Oil and Gas Data Monetization Market Analysis and Forecast
14.1. Key Findings
14.2. Market Size (US$ Mn) Forecast by Method, 2016-2026
14.2.1. Indirect Data Monetization
14.2.2. Direct Data Monetization
14.3. Data Monetization Market Size (US$ Mn) Forecast byComponent, 2016-2026
14.3.1. Data as a Service
14.3.2. Professional Services
14.3.3. Platform/Software
14.4. Direct Data Monetization Market Size (US$ Mn) Forecast byApplication, 2016-2026
14.4.1. Upstream
14.4.1.1. Conventional
14.4.1.2. Unconventional
14.4.2. Midstream
14.4.3. Downstream
14.5. IndirectData Monetization Market Size (US$ Mn) Forecast byApplication, 2016-2026
14.5.1. Upstream
14.5.1.1. Conventional
14.5.1.2. Unconventional
14.5.2. Midstream
14.5.3. Downstream
14.6. Upstream Direct Data Monetization Market Size (US$ Mn) Forecast by E&P Lifecycle, 2016-2026
14.6.1. Exploration
14.6.2. Development
14.6.3. Production
14.7. Upstream Indirect Data Monetization Market Size (US$ Mn) Forecast by E&P Lifecycle, 2016-2026
14.7.1. Exploration
14.7.2. Development
14.7.3. Production
14.8. Upstream Direct Data Monetization Market Size (US$ Mn) Forecast by Oil Companies, 2016-2026
14.8.1. National Oil Companies
14.8.2. Independent Oil Companies
14.8.3. National Data Repository
14.8.4. Oil and Gas Service Company
14.9. Upstream IndirectData Monetization Market Size (US$ Mn) Forecast by Oil Companies, 2016-2026
14.9.1. National Oil Companies
14.9.2. Independent Oil Companies
14.9.3. National Data Repository
14.9.4. Oil and Gas Service Company
14.10. Market Attractiveness Analysis
14.10.1. By Component
14.10.2. By Method
14.10.3. By Application
14.10.4. By E&P Lifecycle
14.10.5. By Oil Companies
15. Canada Oil and Gas Data Monetization Market Analysis and Forecast
15.1. Key Findings
15.2. Market Size (US$ Mn) Forecast by Method, 2016-2026
15.2.1. Indirect Data Monetization
15.2.2. Direct Data Monetization
15.3. Data Monetization Market Size (US$ Mn) Forecast byComponent, 2016-2026
15.3.1. Data as a Service
15.3.2. Professional Services
15.3.3. Platform/Software
15.4. Direct Data Monetization Market Size (US$ Mn) Forecast byApplication, 2016-2026
15.4.1. Upstream
15.4.1.1. Conventional
15.4.1.2. Unconventional
15.4.2. Midstream
15.4.3. Downstream
15.5. IndirectData Monetization Market Size (US$ Mn) Forecast byApplication, 2016-2026
15.5.1. Upstream
15.5.1.1. Conventional
15.5.1.2. Unconventional
15.5.2. Midstream
15.5.3. Downstream
15.6. Upstream Direct Data Monetization Market Size (US$ Mn) Forecast by E&P Lifecycle, 2016-2026
15.6.1. Exploration
15.6.2. Development
15.6.3. Production
15.7. Upstream Indirect Data Monetization Market Size (US$ Mn) Forecast by E&P Lifecycle, 2016-2026
15.7.1. Exploration
15.7.2. Development
15.7.3. Production
15.8. Upstream Direct Data Monetization Market Size (US$ Mn) Forecast by Oil Companies, 2016-2026
15.8.1. National Oil Companies
15.8.2. Independent Oil Companies
15.8.3. National Data Repository
15.8.4. Oil and Gas Service Company
15.9. Upstream Indirect Data Monetization Market Size (US$ Mn) Forecast by Oil Companies, 2016-2026
15.9.1. National Oil Companies
15.9.2. Independent Oil Companies
15.9.3. National Data Repository
15.9.4. Oil and Gas Service Company
15.10. Market Attractiveness Analysis
15.10.1. By Component
15.10.2. By Method
15.10.3. By Application
15.10.4. By E&P Lifecycle
15.10.5. By Oil Companies
16. GermanyOil and Gas Data Monetization Market Analysis and Forecast
16.1. Key Findings
16.2. Market Size (US$ Mn) Forecast by Method, 2016-2026
16.2.1. Indirect Data Monetization
16.2.2. Direct Data Monetization
16.3. Data Monetization Market Size (US$ Mn) Forecast byComponent, 2016-2026
16.3.1. Data as a Service
16.3.2. Professional Services
16.3.3. Platform/Software
16.4. Direct Data Monetization Market Size (US$ Mn) Forecast byApplication, 2016-2026
16.4.1. Upstream
16.4.1.1. Conventional
16.4.1.2. Unconventional
16.4.2. Midstream
16.4.3. Downstream
16.5. IndirectData Monetization Market Size (US$ Mn) Forecast byApplication, 2016-2026
16.5.1. Upstream
16.5.1.1. Conventional
16.5.1.2. Unconventional
16.5.2. Midstream
16.5.3. Downstream
16.6. Upstream Direct Data Monetization Market Size (US$ Mn) Forecast by E&P Lifecycle, 2016-2026
16.6.1. Exploration
16.6.2. Development
16.6.3. Production
16.7. Upstream Indirect Data Monetization Market Size (US$ Mn) Forecast by E&P Lifecycle, 2016-2026
16.7.1. Exploration
16.7.2. Development
16.7.3. Production
16.8. Upstream Direct Data Monetization Market Size (US$ Mn) Forecast by Oil Companies, 2016-2026
16.8.1. National Oil Companies
16.8.2. Independent Oil Companies
16.8.3. National Data Repository
16.8.4. Oil and Gas Service Company
16.9. Upstream Indirect Data Monetization Market Size (US$ Mn) Forecast by Oil Companies, 2016-2026
16.9.1. National Oil Companies
16.9.2. Independent Oil Companies
16.9.3. National Data Repository
16.9.4. Oil and Gas Service Company
16.10. Market Attractiveness Analysis
16.10.1. By Component
16.10.2. By Method
16.10.3. By Application
16.10.4. By E&P Lifecycle
16.10.5. By Oil Companies
17. FranceOil and Gas Data Monetization Market Analysis and Forecast
17.1. Key Findings
17.2. Market Size (US$ Mn) Forecast by Method, 2016-2026
17.2.1. Indirect Data Monetization
17.2.2. Direct Data Monetization
17.3. Data Monetization Market Size (US$ Mn) Forecast byComponent, 2016-2026
17.3.1. Data as a Service
17.3.2. Professional Services
17.3.3. Platform/Software
17.4. Direct Data Monetization Market Size (US$ Mn) Forecast byApplication, 2016-2026
17.4.1. Upstream
17.4.1.1. Conventional
17.4.1.2. Unconventional
17.4.2. Midstream
17.4.3. Downstream
17.5. IndirectData Monetization Market Size (US$ Mn) Forecast byApplication, 2016-2026
17.5.1. Upstream
17.5.1.1. Conventional
17.5.1.2. Unconventional
17.5.2. Midstream
17.5.3. Downstream
17.6. Upstream Direct Data Monetization Market Size (US$ Mn) Forecast by E&P Lifecycle, 2016-2026
17.6.1. Exploration
17.6.2. Development
17.6.3. Production
17.7. Upstream Indirect Data Monetization Market Size (US$ Mn) Forecast by E&P Lifecycle, 2016-2026
17.7.1. Exploration
17.7.2. Development
17.7.3. Production
17.8. Upstream Direct Data Monetization Market Size (US$ Mn) Forecast by Oil Companies, 2016-2026
17.8.1. National Oil Companies
17.8.2. Independent Oil Companies
17.8.3. National Data Repository
17.8.4. Oil and Gas Service Company
17.9. Upstream Indirect Data Monetization Market Size (US$ Mn) Forecast by Oil Companies, 2016-2026
17.9.1. National Oil Companies
17.9.2. Independent Oil Companies
17.9.3. National Data Repository
17.9.4. Oil and Gas Service Company
17.10. Market Attractiveness Analysis
17.10.1. By Component
17.10.2. By Method
17.10.3. By Application
17.10.4. By E&P Lifecycle
17.10.5. By Oil Companies
18. UK Oil and Gas Data Monetization Market Analysis and Forecast
18.1. Key Findings
18.2. Market Size (US$ Mn) Forecast by Method, 2016-2026
18.2.1. Indirect Data Monetization
18.2.2. Direct Data Monetization
18.3. Data Monetization Market Size (US$ Mn) Forecast byComponent, 2016-2026
18.3.1. Data as a Service
18.3.2. Professional Services
18.3.3. Platform/Software
18.4. Direct Data Monetization Market Size (US$ Mn) Forecast byApplication, 2016-2026
18.4.1. Upstream
18.4.1.1. Conventional
18.4.1.2. Unconventional
18.4.2. Midstream
18.4.3. Downstream
18.5. IndirectData Monetization Market Size (US$ Mn) Forecast byApplication, 2016-2026
18.5.1. Upstream
18.5.1.1. Conventional
18.5.1.2. Unconventional
18.5.2. Midstream
18.5.3. Downstream
18.6. Upstream Direct Data Monetization Market Size (US$ Mn) Forecast by E&P Lifecycle, 2016-2026
18.6.1. Exploration
18.6.2. Development
18.6.3. Production
18.7. Upstream Indirect Data Monetization Market Size (US$ Mn) Forecast by E&P Lifecycle, 2016-2026
18.7.1. Exploration
18.7.2. Development
18.7.3. Production
18.8. Upstream Direct Data Monetization Market Size (US$ Mn) Forecast by Oil Companies, 2016-2026
18.8.1. National Oil Companies
18.8.2. Independent Oil Companies
18.8.3. National Data Repository
18.8.4. Oil and Gas Service Company
18.9. Upstream Indirect Data Monetization Market Size (US$ Mn) Forecast by Oil Companies, 2016-2026
18.9.1. National Oil Companies
18.9.2. Independent Oil Companies
18.9.3. National Data Repository
18.9.4. Oil and Gas Service Company
18.10. Market Attractiveness Analysis
18.10.1. By Component
18.10.2. By Method
18.10.3. By Application
18.10.4. By E&P Lifecycle
18.10.5. By Oil Companies
19. China Oil and Gas Data Monetization Market Analysis and Forecast
19.1. Key Findings
19.2. Market Size (US$ Mn) Forecast by Method, 2016-2026
19.2.1. Indirect Data Monetization
19.2.2. Direct Data Monetization
19.3. Data Monetization Market Size (US$ Mn) Forecast byComponent, 2016-2026
19.3.1. Data as a Service
19.3.2. Professional Services
19.3.3. Platform/Software
19.4. Direct Data Monetization Market Size (US$ Mn) Forecast byApplication, 2016-2026
19.4.1. Upstream
19.4.1.1. Conventional
19.4.1.2. Unconventional
19.4.2. Midstream
19.4.3. Downstream
19.5. Indirect Data Monetization Market Size (US$ Mn) Forecast byApplication, 2016-2026
19.5.1. Upstream
19.5.1.1. Conventional
19.5.1.2. Unconventional
19.5.2. Midstream
19.5.3. Downstream
19.6. Upstream Direct Data Monetization Market Size (US$ Mn) Forecast by E&P Lifecycle, 2016-2026
19.6.1. Exploration
19.6.2. Development
19.6.3. Production
19.7. Upstream Indirect Data Monetization Market Size (US$ Mn) Forecast by E&P Lifecycle, 2016-2026
19.7.1. Exploration
19.7.2. Development
19.7.3. Production
19.8. Upstream Direct Data Monetization Market Size (US$ Mn) Forecast by Oil Companies, 2016-2026
19.8.1. National Oil Companies
19.8.2. Independent Oil Companies
19.8.3. National Data Repository
19.8.4. Oil and Gas Service Company
19.9. Upstream Indirect Data Monetization Market Size (US$ Mn) Forecast by Oil Companies, 2016-2026
19.9.1. National Oil Companies
19.9.2. Independent Oil Companies
19.9.3. National Data Repository
19.9.4. Oil and Gas Service Company
19.10. Market Attractiveness Analysis
19.10.1. By Component
19.10.2. By Method
19.10.3. By Application
19.10.4. By E&P Lifecycle
19.10.5. By Oil Companies
20. India Oil and Gas Data Monetization Market Analysis and Forecast
20.1. Key Findings
20.2. Market Size (US$ Mn) Forecast by Method, 2016-2026
20.2.1. Indirect Data Monetization
20.2.2. Direct Data Monetization
20.3. Data Monetization Market Size (US$ Mn) Forecast byComponent, 2016-2026
20.3.1. Data as a Service
20.3.2. Professional Services
20.3.3. Platform/Software
20.4. Direct Data Monetization Market Size (US$ Mn) Forecast byApplication, 2016-2026
20.4.1. Upstream
20.4.1.1. Conventional
20.4.1.2. Unconventional
20.4.2. Midstream
20.4.3. Downstream
20.5. Indirect Data Monetization Market Size (US$ Mn) Forecast byApplication, 2016-2026
20.5.1. Upstream
20.5.1.1. Conventional
20.5.1.2. Unconventional
20.5.2. Midstream
20.5.3. Downstream
20.6. Upstream Direct Data Monetization Market Size (US$ Mn) Forecast by E&P Lifecycle, 2016-2026
20.6.1. Exploration
20.6.2. Development
20.6.3. Production
20.7. Upstream Indirect Data Monetization Market Size (US$ Mn) Forecast by E&P Lifecycle, 2016-2026
20.7.1. Exploration
20.7.2. Development
20.7.3. Production
20.8. Upstream Direct Data Monetization Market Size (US$ Mn) Forecast by Oil Companies, 2016-2026
20.8.1. National Oil Companies
20.8.2. Independent Oil Companies
20.8.3. National Data Repository
20.8.4. Oil and Gas Service Company
20.9. Upstream Indirect Data Monetization Market Size (US$ Mn) Forecast by Oil Companies, 2016-2026
20.9.1. National Oil Companies
20.9.2. Independent Oil Companies
20.9.3. National Data Repository
20.9.4. Oil and Gas Service Company
20.10. Market Attractiveness Analysis
20.10.1. By Component
20.10.2. By Method
20.10.3. By Application
20.10.4. By E&P Lifecycle
20.10.5. By Oil Companies
21. Japan Oil and Gas Data Monetization Market Analysis and Forecast
21.1. Key Findings
21.2. Market Size (US$ Mn) Forecast by Method, 2016-2026
21.2.1. Indirect Data Monetization
21.2.2. Direct Data Monetization
21.3. Data Monetization Market Size (US$ Mn) Forecast byComponent, 2016-2026
21.3.1. Data as a Service
21.3.2. Professional Services
21.3.3. Platform/Software
21.4. Direct Data Monetization Market Size (US$ Mn) Forecast byApplication, 2016-2026
21.4.1. Upstream
21.4.1.1. Conventional
21.4.1.2. Unconventional
21.4.2. Midstream
21.4.3. Downstream
21.5. IndirectData Monetization Market Size (US$ Mn) Forecast byApplication, 2016-2026
21.5.1. Upstream
21.5.1.1. Conventional
21.5.1.2. Unconventional
21.5.2. Midstream
21.5.3. Downstream
21.6. Upstream Direct Data Monetization Market Size (US$ Mn) Forecast by E&P Lifecycle, 2016-2026
21.6.1. Exploration
21.6.2. Development
21.6.3. Production
21.7. Upstream Indirect Data Monetization Market Size (US$ Mn) Forecast by E&P Lifecycle, 2016-2026
21.7.1. Exploration
21.7.2. Development
21.7.3. Production
21.8. Upstream Direct Data Monetization Market Size (US$ Mn) Forecast by Oil Companies, 2016-2026
21.8.1. National Oil Companies
21.8.2. Independent Oil Companies
21.8.3. National Data Repository
21.8.4. Oil and Gas Service Company
21.9. Upstream Indirect Data Monetization Market Size (US$ Mn) Forecast by Oil Companies, 2016-2026
21.9.1. National Oil Companies
21.9.2. Independent Oil Companies
21.9.3. National Data Repository
21.9.4. Oil and Gas Service Company
21.10. Market Attractiveness Analysis
21.10.1. By Component
21.10.2. By Method
21.10.3. By Application
21.10.4. By E&P Lifecycle
21.10.5. By Oil Companies
22. Australia Oil and Gas Data Monetization Market Analysis and Forecast
22.1. Key Findings
22.2. Market Size (US$ Mn) Forecast by Method, 2016-2026
22.2.1. Indirect Data Monetization
22.2.2. Direct Data Monetization
22.3. Data Monetization Market Size (US$ Mn) Forecast byComponent, 2016-2026
22.3.1. Data as a Service
22.3.2. Professional Services
22.3.3. Platform/Software
22.4. Direct Data Monetization Market Size (US$ Mn) Forecast byApplication, 2016-2026
22.4.1. Upstream
22.4.1.1. Conventional
22.4.1.2. Unconventional
22.4.2. Midstream
22.4.3. Downstream
22.5. Indirect Data Monetization Market Size (US$ Mn) Forecast byApplication, 2016-2026
22.5.1. Upstream
22.5.1.1. Conventional
22.5.1.2. Unconventional
22.5.2. Midstream
22.5.3. Downstream
22.6. Upstream Direct Data Monetization Market Size (US$ Mn) Forecast by E&P Lifecycle, 2016-2026
22.6.1. Exploration
22.6.2. Development
22.6.3. Production
22.7. Upstream Indirect Data Monetization Market Size (US$ Mn) Forecast by E&P Lifecycle, 2016-2026
22.7.1. Exploration
22.7.2. Development
22.7.3. Production
22.8. Upstream Direct Data Monetization Market Size (US$ Mn) Forecast by Oil Companies, 2016-2026
22.8.1. National Oil Companies
22.8.2. Independent Oil Companies
22.8.3. National Data Repository
22.8.4. Oil and Gas Service Company
22.9. Upstream Indirect Data Monetization Market Size (US$ Mn) Forecast by Oil Companies, 2016-2026
22.9.1. National Oil Companies
22.9.2. Independent Oil Companies
22.9.3. National Data Repository
22.9.4. Oil and Gas Service Company
22.10. Market Attractiveness Analysis
22.10.1. By Component
22.10.2. By Method
22.10.3. By Application
22.10.4. By E&P Lifecycle
22.10.5. By Oil Companies
23. GCC Oil and Gas Data Monetization Market Analysis and Forecast
23.1. Key Findings
23.2. Market Size (US$ Mn) Forecast by Method, 2016-2026
23.2.1. Indirect Data Monetization
23.2.2. Direct Data Monetization
23.3. Data Monetization Market Size (US$ Mn) Forecast byComponent, 2016-2026
23.3.1. Data as a Service
23.3.2. Professional Services
23.3.3. Platform/Software
23.4. Direct Data Monetization Market Size (US$ Mn) Forecast byApplication, 2016-2026
23.4.1. Upstream
23.4.1.1. Conventional
23.4.1.2. Unconventional
23.4.2. Midstream
23.4.3. Downstream
23.5. IndirectData Monetization Market Size (US$ Mn) Forecast byApplication, 2016-2026
23.5.1. Upstream
23.5.1.1. Conventional
23.5.1.2. Unconventional
23.5.2. Midstream
23.5.3. Downstream
23.6. Upstream Direct Data Monetization Market Size (US$ Mn) Forecast by E&P Lifecycle, 2016-2026
23.6.1. Exploration
23.6.2. Development
23.6.3. Production
23.7. Upstream Indirect Data Monetization Market Size (US$ Mn) Forecast by E&P Lifecycle, 2016-2026
23.7.1. Exploration
23.7.2. Development
23.7.3. Production
23.8. Upstream Direct Data Monetization Market Size (US$ Mn) Forecast by Oil Companies, 2016-2026
23.8.1. National Oil Companies
23.8.2. Independent Oil Companies
23.8.3. National Data Repository
23.8.4. Oil and Gas Service Company
23.9. Upstream Indirect Data Monetization Market Size (US$ Mn) Forecast by Oil Companies, 2016-2026
23.9.1. National Oil Companies
23.9.2. Independent Oil Companies
23.9.3. National Data Repository
23.9.4. Oil and Gas Service Company
23.10. Market Attractiveness Analysis
23.10.1. By Component
23.10.2. By Method
23.10.3. By Application
23.10.4. By E&P Lifecycle
23.10.5. By Oil Companies
24. South Africa Oil and Gas Data Monetization Market Analysis and Forecast
24.1. Key Findings
24.2. Market Size (US$ Mn) Forecast by Method, 2016-2026
24.2.1. Indirect Data Monetization
24.2.2. Direct Data Monetization
24.3. Data Monetization Market Size (US$ Mn) Forecast byComponent, 2016-2026
24.3.1. Data as a Service
24.3.2. Professional Services
24.3.3. Platform/Software
24.4. Direct Data Monetization Market Size (US$ Mn) Forecast byApplication, 2016-2026
24.4.1. Upstream
24.4.1.1. Conventional
24.4.1.2. Unconventional
24.4.2. Midstream
24.4.3. Downstream
24.5. IndirectData Monetization Market Size (US$ Mn) Forecast byApplication, 2016-2026
24.5.1. Upstream
24.5.1.1. Conventional
24.5.1.2. Unconventional
24.5.2. Midstream
24.5.3. Downstream
24.6. Upstream Direct Data Monetization Market Size (US$ Mn) Forecast by E&P Lifecycle, 2016-2026
24.6.1. Exploration
24.6.2. Development
24.6.3. Production
24.7. Upstream Indirect Data Monetization Market Size (US$ Mn) Forecast by E&P Lifecycle, 2016-2026
24.7.1. Exploration
24.7.2. Development
24.7.3. Production
24.8. Upstream Direct Data Monetization Market Size (US$ Mn) Forecast by Oil Companies, 2016-2026
24.8.1. National Oil Companies
24.8.2. Independent Oil Companies
24.8.3. National Data Repository
24.8.4. Oil and Gas Service Company
24.9. Upstream Indirect Data Monetization Market Size (US$ Mn) Forecast by Oil Companies, 2016-2026
24.9.1. National Oil Companies
24.9.2. Independent Oil Companies
24.9.3. National Data Repository
24.9.4. Oil and Gas Service Company
24.10. Market Attractiveness Analysis
24.10.1. By Component
24.10.2. By Method
24.10.3. By Application
24.10.4. By E&P Lifecycle
24.10.5. By Oil Companies
25. Brazil Oil and Gas Data Monetization Market Analysis and Forecast
25.1. Key Findings
25.2. Market Size (US$ Mn) Forecast by Method, 2016-2026
25.2.1. Indirect Data Monetization
25.2.2. Direct Data Monetization
25.3. Data Monetization Market Size (US$ Mn) Forecast byComponent, 2016-2026
25.3.1. Data as a Service
25.3.2. Professional Services
25.3.3. Platform/Software
25.4. Direct Data Monetization Market Size (US$ Mn) Forecast byApplication, 2016-2026
25.4.1. Upstream
25.4.1.1. Conventional
25.4.1.2. Unconventional
25.4.2. Midstream
25.4.3. Downstream
25.5. IndirectData Monetization Market Size (US$ Mn) Forecast byApplication, 2016-2026
25.5.1. Upstream
25.5.1.1. Conventional
25.5.1.2. Unconventional
25.5.2. Midstream
25.5.3. Downstream
25.6. Upstream Direct Data Monetization Market Size (US$ Mn) Forecast by E&P Lifecycle, 2016-2026
25.6.1. Exploration
25.6.2. Development
25.6.3. Production
25.7. Upstream Indirect Data Monetization Market Size (US$ Mn) Forecast by E&P Lifecycle, 2016-2026
25.7.1. Exploration
25.7.2. Development
25.7.3. Production
25.8. Upstream Direct Data Monetization Market Size (US$ Mn) Forecast by Oil Companies, 2016-2026
25.8.1. National Oil Companies
25.8.2. Independent Oil Companies
25.8.3. National Data Repository
25.8.4. Oil and Gas Service Company
25.9. Upstream Indirect Data Monetization Market Size (US$ Mn) Forecast by Oil Companies, 2016-2026
25.9.1. National Oil Companies
25.9.2. Independent Oil Companies
25.9.3. National Data Repository
25.9.4. Oil and Gas Service Company
25.10. Market Attractiveness Analysis
25.10.1. By Component
25.10.2. By Method
25.10.3. By Application
25.10.4. By E&P Lifecycle
25.10.5. By Oil Companies
26. Competition Landscape
26.1. Market Player – Competition Matrix
26.2. Market Revenue Share Analysis (%), By Company (2017)
27. Company Profiles
27.1. Indirect Data Monetization Providers in Oil and Gas Industry
27.1.1. Accenture
27.1.1.1. Overview
27.1.1.2. Key Competitors
27.1.1.3. Financial Overview
27.1.1.4. Strategy
27.1.1.5. Recent Developments
27.1.2. Datameer
27.1.2.1. Overview
27.1.2.2. Key Competitors
27.1.2.3. Financial Overview
27.1.2.4. Strategy
27.1.2.5. Recent Developments
27.1.3. Datawatch
27.1.3.1. Overview
27.1.3.2. Key Competitors
27.1.3.3. Financial Overview
27.1.3.4. Strategy
27.1.3.5. Recent Developments
27.1.4. Drillinginfo Inc.
27.1.4.1. Overview
27.1.4.2. Key Competitors
27.1.4.3. Financial Overview
27.1.4.4. Strategy
27.1.4.5. Recent Developments
27.1.5. General Electric
27.1.5.1. Overview
27.1.5.2. Key Competitors
27.1.5.3. Financial Overview
27.1.5.4. Strategy
27.1.5.5. Recent Developments
27.1.6. Hitachi Vantara Corporation
27.1.6.1. Overview
27.1.6.2. Key Competitors
27.1.6.3. Financial Overview
27.1.6.4. Strategy
27.1.6.5. Recent Developments
27.1.7. Hortonworks Inc.
27.1.7.1. Overview
27.1.7.2. Key Competitors
27.1.7.3. Financial Overview
27.1.7.4. Strategy
27.1.7.5. Recent Developments
27.1.8. International Business Machines Corporation
27.1.8.1. Overview
27.1.8.2. Key Competitors
27.1.8.3. Financial Overview
27.1.8.4. Strategy
27.1.8.5. Recent Developments
27.1.9. MapR Technologies, Inc.
27.1.9.1. Overview
27.1.9.2. Key Competitors
27.1.9.3. Financial Overview
27.1.9.4. Strategy
27.1.9.5. Recent Developments
27.1.10. Microsoft Corporation
27.1.10.1. Overview
27.1.10.2. Key Competitors
27.1.10.3. Financial Overview
27.1.10.4. Strategy
27.1.10.5. Recent Developments
27.1.11. Northwest Analytics Inc.
27.1.11.1. Overview
27.1.11.2. Key Competitors
27.1.11.3. Financial Overview
27.1.11.4. Strategy
27.1.11.5. Recent Developments
27.1.12. Oracle Corporation
27.1.12.1. Overview
27.1.12.2. Key Competitors
27.1.12.3. Financial Overview
27.1.12.4. Strategy
27.1.12.5. Recent Developments
27.1.13. OSI Soft
27.1.13.1. Overview
27.1.13.2. Key Competitors
27.1.13.3. Financial Overview
27.1.13.4. Strategy
27.1.13.5. Recent Developments
27.1.14. Palantir Economic Solutions Ltd
27.1.14.1. Overview
27.1.14.2. Key Competitors
27.1.14.3. Financial Overview
27.1.14.4. Strategy
27.1.14.5. Recent Developments
27.1.15. SAP SE
27.1.15.1. Overview
27.1.15.2. Key Competitors
27.1.15.3. Financial Overview
27.1.15.4. Strategy
27.1.15.5. Recent Developments
27.1.16. SAS Institute Inc.
27.1.16.1. Overview
27.1.16.2. Key Competitors
27.1.16.3. Financial Overview
27.1.16.4. Strategy
27.1.16.5. Recent Developments
27.1.17. Capgemini S.A.
27.1.17.1. Overview
27.1.17.2. Key Competitors
27.1.17.3. Financial Overview
27.1.17.4. Strategy
27.1.17.5. Recent Developments
27.1.18. Cloudera, Inc.
27.1.18.1. Overview
27.1.18.2. Key Competitors
27.1.18.3. Financial Overview
27.1.18.4. Strategy
27.1.18.5. Recent Developments
27.1.19. EMC Corporation
27.1.19.1. Overview
27.1.19.2. Key Competitors
27.1.19.3. Financial Overview
27.1.19.4. Strategy
27.1.19.5. SWOT Analysis
27.1.20. Newgen Software, Inc.
27.1.20.1. Overview
27.1.20.2. Key Competitors
27.1.20.3. Financial Overview
27.1.20.4. Strategy
27.1.20.5. SWOT Analysis
27.1.21. Cisco Systems, Inc.
27.1.21.1. Overview
27.1.21.2. Key Competitors
27.1.21.3. Financial Overview
27.1.21.4. Strategy
27.1.21.5. SWOT Analysis
27.1.22. Tata Consultancy Services Ltd.
27.1.22.1. Overview
27.1.22.2. Key Competitors
27.1.22.3. Financial Overview
27.1.22.4. Strategy
27.1.22.5. SWOT Analysis
27.1.23. Halliburton
27.1.23.1. Overview
27.1.23.2. Key Competitors
27.1.23.3. Financial Overview
27.1.23.4. Strategy
27.1.23.5. SWOT Analysis
27.1.24. Informatica Corporation
27.1.24.1. Overview
27.1.24.2. Key Competitors
27.1.24.3. Financial Overview
27.1.24.4. Strategy
27.1.24.5. SWOT Analysis
27.1.25. Schlumberger Limited
27.1.25.1. Overview
27.1.25.2. Key Competitors
27.1.25.3. Financial Overview
27.1.25.4. Strategy
27.1.25.5. SWOT Analysis
27.2. Global Data Monetization Players
27.2.1. Adastra Corporation
27.2.1.1. Overview
27.2.1.2. Description
27.2.1.3. Products
27.2.1.4. Revenue
27.2.1.5. Sales Breakdown by Geography
27.2.1.6. Key Financial Indicator
27.2.1.7. SWOT Analysis
27.2.1.8. Recent Development
27.2.1.9. Strategic Overview
27.2.2. ALC
27.2.2.1. Overview
27.2.2.2. Description
27.2.2.3. Products
27.2.2.4. Revenue
27.2.2.5. Sales Breakdown by Geography
27.2.2.6. Key Financial Indicator
27.2.2.7. SWOT Analysis
27.2.2.8. Recent Development
27.2.2.9. Strategic Overview
27.2.3. Connectiva Analytics and Insights Ltd.
27.2.3.1. Overview
27.2.3.2. Description
27.2.3.3. Products
27.2.3.4. Revenue
27.2.3.5. Sales Breakdown by Geography
27.2.3.6. Key Financial Indicator
27.2.3.7. SWOT Analysis
27.2.3.8. Recent Development
27.2.3.9. Strategic Overview
27.2.4. Dawex
27.2.4.1. Overview
27.2.4.2. Description
27.2.4.3. Products
27.2.4.4. Revenue
27.2.4.5. Sales Breakdown by Geography
27.2.4.6. Key Financial Indicator
27.2.4.7. SWOT Analysis
27.2.4.8. Recent Development
27.2.4.9. Strategic Overview
27.2.5. Intel Corporation
27.2.5.1. Overview
27.2.5.2. Description
27.2.5.3. Products
27.2.5.4. Revenue
27.2.5.5. Sales Breakdown by Geography
27.2.5.6. Key Financial Indicator
27.2.5.7. SWOT Analysis
27.2.5.8. Recent Development
27.2.5.9. Strategic Overview
27.2.6. Mahindra Comviva
27.2.6.1. Overview
27.2.6.2. Description
27.2.6.3. Products
27.2.6.4. Revenue
27.2.6.5. Sales Breakdown by Geography
27.2.6.6. Key Financial Indicator
27.2.6.7. SWOT Analysis
27.2.6.8. Recent Development
27.2.6.9. Strategic Overview
27.2.7. Mnubo
27.2.7.1. Overview
27.2.7.2. Description
27.2.7.3. Products
27.2.7.4. Revenue
27.2.7.5. Sales Breakdown by Geography
27.2.7.6. Key Financial Indicator
27.2.7.7. SWOT Analysis
27.2.7.8. Recent Development
27.2.7.9. Strategic Overview
27.2.8. NETSCOUT
27.2.8.1. Overview
27.2.8.2. Description
27.2.8.3. Products
27.2.8.4. Revenue
27.2.8.5. Sales Breakdown by Geography
27.2.8.6. Key Financial Indicator
27.2.8.7. SWOT Analysis
27.2.8.8. Recent Development
27.2.8.9. Strategic Overview
27.2.9. Paxata, Inc
27.2.9.1. Overview
27.2.9.2. Description
27.2.9.3. Products
27.2.9.4. Revenue
27.2.9.5. Sales Breakdown by Geography
27.2.9.6. Key Financial Indicator
27.2.9.7. SWOT Analysis
27.2.9.8. Recent Development
27.2.9.9. Strategic Overview
27.2.10. Redknee Solutions Inc.
27.2.10.1. Overview
27.2.10.2. Description
27.2.10.3. Products
27.2.10.4. Revenue
27.2.10.5. Sales Breakdown by Geography
27.2.10.6. Key Financial Indicator
27.2.10.7. SWOT Analysis
27.2.10.8. Recent Development
27.2.10.9. Strategic Overview
27.2.11. SQLstream, Inc.
27.2.11.1. Overview
27.2.11.2. Description
27.2.11.3. Products
27.2.11.4. Revenue
27.2.11.5. Sales Breakdown by Geography
27.2.11.6. Key Financial Indicator
27.2.11.7. SWOT Analysis
27.2.11.8. Recent Development
27.2.11.9. Strategic Overview
27.2.12. Virtusa Corporation
27.2.12.1. Overview
27.2.12.2. Description
27.2.12.3. Products
27.2.12.4. Revenue
27.2.12.5. Sales Breakdown by Geography
27.2.12.6. Key Financial Indicator
27.2.12.7. SWOT Analysis
27.2.12.8. Recent Development
27.2.12.9. Strategic Overview
28. Key Takeaways
List of Tables
Table 1 : Global Oil and Gas Data Monetization Market Size (US$ Mn) Forecast, by Method, 2016 – 2026
Table 2 : Global Oil and Gas Data Monetization Market Size (US$ Mn) Forecast, by Component, 2016 – 2026
Table 3 : Global Oil and Gas Direct Data Monetization Market Size (US$ Mn) Forecast, by Application, 2016 – 2026
Table 4 : Global Oil and Gas Indirect Data Monetization Market Size (US$ Mn) Forecast, by Application, 2016 – 2026
Table 5 : Global Oil and Gas Direct Data Monetization Market Size (US$ Mn) Forecast, by E&P Lifecycle, 2016 – 2026
Table 6 : Global Oil and Gas Indirect Data Monetization Market Size (US$ Mn) Forecast, by E&P Lifecycle, 2016 – 2026
Table 7 : Global Oil and Gas Direct Data Monetization Market Size (US$ Mn) Forecast, by Oil Companies, 2016 – 2026
Table 8 : Global Oil and Gas Indirect Data Monetization Market Size (US$ Mn) Forecast, by Oil Companies, 2016 – 2026
Table 9 : North America Oil and Gas Data Monetization Market Size (US$ Mn) Forecast, by Country, 2016 – 2026
Table 10 : Europe Oil and Gas Data Monetization Market Size (US$ Mn) Forecast, by Country, 2016 – 2026
Table 11 : Asia Pacific Oil and Gas Data Monetization Market Size (US$ Mn) Forecast, by Country, 2016 – 2026
Table 12 : MEA Oil and Gas Data Monetization Market Size (US$ Mn) Forecast, by Country, 2016 – 2026
Table 13 : South America Oil and Gas Data Monetization Market Size (US$ Mn) Forecast, by Country, 2016 – 2026
Table 14 : U.S. Oil and Gas Data Monetization Market Size (US$ Mn) Forecast, by Method, 2016 – 2026
Table 15 : U.S. Oil and Gas Data Monetization Market Size (US$ Mn) Forecast, by Component, 2016 – 2026
Table 16 : U.S. Oil and Gas Direct Data Monetization Market Size (US$ Mn) Forecast, by Application, 2016 – 2026
Table 17 : U.S. Oil and Gas Indirect Data Monetization Market Size (US$ Mn) Forecast, by Application, 2016 – 2026
Table 18 : U.S. Oil and Gas Upstream Direct Data Monetization Market Size (US$ Mn) Forecast, by E&P Lifecycle, 2016 – 2026
Table 19 : U.S. Oil and Gas Upstream Indirect Data Monetization Market Size (US$ Mn) Forecast, by E&P Lifecycle, 2016 – 2026
Table 20 : U.S. Oil and Gas Upstream Direct Data Monetization Market Size (US$ Mn) Forecast, by Oil Companies, 2016 – 2026
Table 21 : U.S. Oil and Gas Upstream Indirect Data Monetization Market Size (US$ Mn) Forecast, by Oil Companies, 2016 – 2026
Table 22 : Canada Oil and Gas Data Monetization Market Size (US$ Mn) Forecast, by Method, 2016 – 2026
Table 23 : Canada Oil and Gas Data Monetization Market Size (US$ Mn) Forecast, by Component, 2016 – 2026
Table 24 : Canada Oil and Gas Direct Data Monetization Market Size (US$ Mn) Forecast, by Application, 2016 – 2026
Table 25 : Canada Oil and Gas Indirect Data Monetization Market Size (US$ Mn) Forecast, by Application, 2016 – 2026
Table 26 : Canada Oil and Gas Upstream Direct Data Monetization Market Size (US$ Mn) Forecast, by E&P Lifecycle, 2016 – 2026
Table 27 : Canada Oil and Gas Upstream Indirect Data Monetization Market Size (US$ Mn) Forecast, by E&P Lifecycle, 2016 – 2026
Table 28 : Canada Oil and Gas Upstream Direct Data Monetization Market Size (US$ Mn) Forecast, by Oil Companies, 2016 – 2026
Table 29 : Canada Oil and Gas Upstream Indirect Data Monetization Market Size (US$ Mn) Forecast, by Oil Companies, 2016 – 2026
Table 30 : Germany Oil and Gas Data Monetization Market Size (US$ Mn) Forecast, by Method, 2016 – 2026
Table 31 : Germany Oil and Gas Data Monetization Market Size (US$ Mn) Forecast, by Component, 2016 – 2026
Table 32 : Germany Oil and Gas Direct Data Monetization Market Size (US$ Mn) Forecast, by Application, 2016 – 2026
Table 33 : Germany Oil and Gas Indirect Data Monetization Market Size (US$ Mn) Forecast, by Application, 2016 – 2026
Table 34 : Germany Oil and Gas Upstream Direct Data Monetization Market Size (US$ Mn) Forecast, by E&P Lifecycle, 2016 – 2026
Table 35 : Germany Oil and Gas Upstream Indirect Data Monetization Market Size (US$ Mn) Forecast, by E&P Lifecycle, 2016 – 2026
Table 36 : Germany Oil and Gas Upstream Direct Data Monetization Market Size (US$ Mn) Forecast, by Oil Companies, 2016 – 2026
Table 37 : Germany Oil and Gas Upstream Indirect Data Monetization Market Size (US$ Mn) Forecast, by Oil Companies, 2016 – 2026
Table 38 : France Oil and Gas Data Monetization Market Size (US$ Mn) Forecast, by Method, 2016 – 2026
Table 39 : France Oil and Gas Data Monetization Market Size (US$ Mn) Forecast, by Component, 2016 – 2026
Table 40 : France Oil and Gas Direct Data Monetization Market Size (US$ Mn) Forecast, by Application, 2016 – 2026
Table 41 : France Oil and Gas Indirect Data Monetization Market Size (US$ Mn) Forecast, by Application, 2016 – 2026
Table 42 : France Oil and Gas Upstream Direct Data Monetization Market Size (US$ Mn) Forecast, by E&P Lifecycle, 2016 – 2026
Table 43 : France Oil and Gas Upstream Indirect Data Monetization Market Size (US$ Mn) Forecast, by E&P Lifecycle, 2016 – 2026
Table 44 : France Oil and Gas Upstream Direct Data Monetization Market Size (US$ Mn) Forecast, by Oil Companies, 2016 – 2026
Table 45 : France Oil and Gas Upstream Indirect Data Monetization Market Size (US$ Mn) Forecast, by Oil Companies, 2016 – 2026
Table 46 : UK Oil and Gas Data Monetization Market Size (US$ Mn) Forecast, by Method, 2016 – 2026
Table 47 : UK Oil and Gas Data Monetization Market Size (US$ Mn) Forecast, by Component, 2016 – 2026
Table 48 : UK Oil and Gas Direct Data Monetization Market Size (US$ Mn) Forecast, by Application, 2016 – 2026
Table 49 : UK Oil and Gas Indirect Data Monetization Market Size (US$ Mn) Forecast, by Application, 2016 – 2026
Table 50 : UK Oil and Gas Upstream Direct Data Monetization Market Size (US$ Mn) Forecast, by E&P Lifecycle, 2016 – 2026
Table 51 : UK Oil and Gas Upstream Indirect Data Monetization Market Size (US$ Mn) Forecast, by E&P Lifecycle, 2016 – 2026
Table 52 : UK Oil and Gas Upstream Direct Data Monetization Market Size (US$ Mn) Forecast, by Oil Companies, 2016 – 2026
Table 53 : UK Oil and Gas Upstream Indirect Data Monetization Market Size (US$ Mn) Forecast, by Oil Companies, 2016 – 2026
Table 54 : China Oil and Gas Data Monetization Market Size (US$ Mn) Forecast, by Method, 2016 – 2026
Table 55 : China Oil and Gas Data Monetization Market Size (US$ Mn) Forecast, by Component, 2016 – 2026
Table 56 : China Oil and Gas Direct Data Monetization Market Size (US$ Mn) Forecast, by Application, 2016 – 2026
Table 57 : China Oil and Gas Indirect Data Monetization Market Size (US$ Mn) Forecast, by Application, 2016 – 2026
Table 58 : China Oil and Gas Upstream Direct Data Monetization Market Size (US$ Mn) Forecast, by E&P Lifecycle, 2016 – 2026
Table 59 : China Oil and Gas Upstream Indirect Data Monetization Market Size (US$ Mn) Forecast, by E&P Lifecycle, 2016 – 2026
Table 60 : China Oil and Gas Upstream Direct Data Monetization Market Size (US$ Mn) Forecast, by Oil Companies, 2016 – 2026
Table 61 : China Oil and Gas Upstream Indirect Data Monetization Market Size (US$ Mn) Forecast, by Oil Companies, 2016 – 2026
Table 62 : Japan Oil and Gas Data Monetization Market Size (US$ Mn) Forecast, by Method, 2016 – 2026
Table 63 : Japan Oil and Gas Data Monetization Market Size (US$ Mn) Forecast, by Component, 2016 – 2026
Table 64 : Japan Oil and Gas Direct Data Monetization Market Size (US$ Mn) Forecast, by Application, 2016 – 2026
Table 65 : Japan Oil and Gas Indirect Data Monetization Market Size (US$ Mn) Forecast, by Application, 2016 – 2026
Table 66 : Japan Oil and Gas Upstream Direct Data Monetization Market Size (US$ Mn) Forecast, by E&P Lifecycle, 2016 – 2026
Table 67 : Japan Oil and Gas Upstream Indirect Data Monetization Market Size (US$ Mn) Forecast, by E&P Lifecycle, 2016 – 2026
Table 68 : Japan Oil and Gas Upstream Direct Data Monetization Market Size (US$ Mn) Forecast, by Oil Companies, 2016 – 2026
Table 69 : Japan Oil and Gas Upstream Indirect Data Monetization Market Size (US$ Mn) Forecast, by Oil Companies, 2016 – 2026
Table 70 : India Oil and Gas Data Monetization Market Size (US$ Mn) Forecast, by Method, 2016 – 2026
Table 71 : India Oil and Gas Data Monetization Market Size (US$ Mn) Forecast, by Component, 2016 – 2026
Table 72 : India Oil and Gas Direct Data Monetization Market Size (US$ Mn) Forecast, by Application, 2016 – 2026
Table 73 : India Oil and Gas Indirect Data Monetization Market Size (US$ Mn) Forecast, by Application, 2016 – 2026
Table 74 : India Oil and Gas Upstream Direct Data Monetization Market Size (US$ Mn) Forecast, by E&P Lifecycle, 2016 – 2026
Table 75 : India Oil and Gas Upstream Indirect Data Monetization Market Size (US$ Mn) Forecast, by E&P Lifecycle, 2016 – 2026
Table 76 : India Oil and Gas Upstream Direct Data Monetization Market Size (US$ Mn) Forecast, by Oil Companies, 2016 – 2026
Table 77 : India Oil and Gas Upstream Indirect Data Monetization Market Size (US$ Mn) Forecast, by Oil Companies, 2016 – 2026
Table 78 : Australia Oil and Gas Data Monetization Market Size (US$ Mn) Forecast, by Method, 2016 – 2026
Table 79 : Australia Oil and Gas Data Monetization Market Size (US$ Mn) Forecast, by Component, 2016 – 2026
Table 80 : Australia Oil and Gas Direct Data Monetization Market Size (US$ Mn) Forecast, by Application, 2016 – 2026
Table 81 : Australia Oil and Gas Indirect Data Monetization Market Size (US$ Mn) Forecast, by Application, 2016 – 2026
Table 82 : Australia Oil and Gas Upstream Direct Data Monetization Market Size (US$ Mn) Forecast, by E&P Lifecycle, 2016 – 2026
Table 83 : Australia Oil and Gas Upstream Indirect Data Monetization Market Size (US$ Mn) Forecast, by E&P Lifecycle, 2016 – 2026
Table 84 : Australia Oil and Gas Upstream Direct Data Monetization Market Size (US$ Mn) Forecast, by Oil Companies, 2016 – 2026
Table 85 : Australia Oil and Gas Upstream Indirect Data Monetization Market Size (US$ Mn) Forecast, by Oil Companies, 2016 – 2026
Table 86 : GCC Oil and Gas Data Monetization Market Size (US$ Mn) Forecast, by Method, 2016 – 2026
Table 87 : GCC Oil and Gas Data Monetization Market Size (US$ Mn) Forecast, by Component, 2016 – 2026
Table 88 : GCC Oil and Gas Direct Data Monetization Market Size (US$ Mn) Forecast, by Application, 2016 – 2026
Table 89 : GCC Oil and Gas Indirect Data Monetization Market Size (US$ Mn) Forecast, by Application, 2016 – 2026
Table 90 : GCC Oil and Gas Upstream Direct Data Monetization Market Size (US$ Mn) Forecast, by E&P Lifecycle, 2016 – 2026
Table 91 : GCC Oil and Gas Upstream Indirect Data Monetization Market Size (US$ Mn) Forecast, by E&P Lifecycle, 2016 – 2026
Table 92 : GCC Oil and Gas Upstream Direct Data Monetization Market Size (US$ Mn) Forecast, by Oil Companies, 2016 – 2026
Table 93 : GCC Oil and Gas Upstream Indirect Data Monetization Market Size (US$ Mn) Forecast, by Oil Companies, 2016 – 2026
Table 94 : South Africa Oil and Gas Data Monetization Market Size (US$ Mn) Forecast, by Method, 2016 – 2026
Table 95 : South Africa Oil and Gas Data Monetization Market Size (US$ Mn) Forecast, by Component, 2016 – 2026
Table 96 : South Africa Oil and Gas Direct Data Monetization Market Size (US$ Mn) Forecast, by Application, 2016 – 2026
Table 97 : South Africa Oil and Gas Indirect Data Monetization Market Size (US$ Mn) Forecast, by Application, 2016 – 2026
Table 98 : South Africa Oil and Gas Upstream Direct Data Monetization Market Size (US$ Mn) Forecast, by E&P Lifecycle, 2016 – 2026
Table 99 : South Africa Oil and Gas Upstream Indirect Data Monetization Market Size (US$ Mn) Forecast, by E&P Lifecycle, 2016 – 2026
Table 100 : South Africa Oil and Gas Upstream Direct Data Monetization Market Size (US$ Mn) Forecast, by Oil Companies, 2016 – 2026
Table 101 : South Africa Oil and Gas Upstream Indirect Data Monetization Market Size (US$ Mn) Forecast, by Oil Companies, 2016 – 2026
Table 102 : Brazil Oil and Gas Data Monetization Market Size (US$ Mn) Forecast, by Method, 2016 – 2026
Table 103 : Brazil Oil and Gas Data Monetization Market Size (US$ Mn) Forecast, by Component, 2016 – 2026
Table 104 : Brazil Oil and Gas Direct Data Monetization Market Size (US$ Mn) Forecast, by Application, 2016 – 2026
Table 105 : Brazil Oil and Gas Indirect Data Monetization Market Size (US$ Mn) Forecast, by Application, 2016 – 2026
Table 106 : Brazil Oil and Gas Upstream Direct Data Monetization Market Size (US$ Mn) Forecast, by E&P Lifecycle, 2016 – 2026
Table 107 : Brazil Oil and Gas Upstream Indirect Data Monetization Market Size (US$ Mn) Forecast, by E&P Lifecycle, 2016 – 2026
Table 108 : Brazil Oil and Gas Upstream Direct Data Monetization Market Size (US$ Mn) Forecast, by Oil Companies, 2016 – 2026
Table 109 : Brazil Oil and Gas Upstream Indirect Data Monetization Market Size (US$ Mn) Forecast, by Oil Companies, 2016 – 2026
List of Figures
Figure 1: Research Methodology
Figure 2 : Global Oil and Gas Data Monetization Market
Figure 3 : Gross Domestic Product (GDP) per Capita; Analysis (1/2) (US$ Tn), By Major Countries, 2011-2016
Figure 4 : Global Oil and Gas CAPEX (US$ Mn), 2015 – 2017
Figure 5 : Global Oil and Gas IT Spending CAPEX (US$ Mn), 2015 – 2017
Figure 6 : Energy Consumption (Quadrillion British Thermal Units)
Figure 7 : Number of IoT Devices/Year (Bn Units)
Figure 8 : Global Oil and Gas Data Monetization Market Size (US$ Mn) and Forecast, 2012 – 2026
Figure 9 : Global Oil and Gas Data Monetization Market Opportunity Analysis, 2016 – 2026
Figure 10 : Global Oil and Gas Data Monetization Market Value Share (Value %), by Component, 2018
Figure 11 : Global Oil and Gas Indirect Data Monetization Market Value Share (Value %), by Application, 2018
Figure 12 : Global Oil and Gas Data Indirect Monetization Market Value Share (Value %), by E&P Lifecycle, 2018
Figure 13 : Global Oil and Gas Indirect Data Monetization Market Value Share (Value %), by Oil Companies, 2018
Figure 14 : Global Oil and Gas Data Monetization Market Value Share (Value %), by Method, 2018
Figure 15 : Global Oil and Gas Direct Data Monetization Market Value Share (Value %), by Application, 2018
Figure 16 : Global Oil and Gas Data Direct Monetization Market Value Share (Value %), by E&P Lifecycle, 2018
Figure 17 : Global Oil and Gas Direct Data Monetization Market Value Share (Value %), by Oil Companies, 2018
Figure 18 : Global Oil and Gas Data Monetization Market Attractiveness Analysis, by Method (2018)
Figure 19 : Global Oil and Gas Data Monetization Market Attractiveness Analysis, by Component (2018)
Figure 20 : Global Oil and Gas Direct Data Monetization Market Attractiveness Analysis, by Application (2018)
Figure 21 : Global Oil and Gas Indirect Data Monetization Market Attractiveness Analysis, by Application (2018)
Figure 22 : Global Oil and Gas Direct Data Monetization Market Attractiveness Analysis, by E&P Lifecycle (2018)
Figure 23 : Global Oil and Gas Indirect Data Monetization Market Attractiveness Analysis, by E&P Lifecycle (2018)
Figure 24 : Global Oil and Gas Direct Data Monetization Market Attractiveness Analysis, by Oil Companies (2018)
Figure 25 : Global Oil and Gas Indirect Data Monetization Market Attractiveness Analysis, by Oil Companies (2018)
Figure 26 : U.S. Oil and Gas Data Monetization Market Attractiveness Analysis, by Method (2018)
Figure 27 : U.S. Oil and Gas Data Monetization Market Attractiveness Analysis, by Component (2018)
Figure 28 : U.S. Oil and Gas Direct Data Monetization Market Attractiveness Analysis, by Application (2018)
Figure 29 : U.S. Oil and Gas Indirect Data Monetization Market Attractiveness Analysis, by Application (2018)
Figure 30 : U.S. Oil and Gas Direct Data Monetization Market Attractiveness Analysis, by E&P Lifecycle (2018)
Figure 31 : U.S. Oil and Gas Indirect Data Monetization Market Attractiveness Analysis, by E&P Lifecycle (2018)
Figure 32 : U.S. Oil and Gas Direct Data Monetization Market Attractiveness Analysis, by Oil Companies (2018)
Figure 33 : U.S. Oil and Gas Indirect Data Monetization Market Attractiveness Analysis, by Oil Companies (2018)
Figure 34 : Canada Oil and Gas Data Monetization Market (US$ Mn) Forecast, 2016 – 2026
Figure 35 : Canada Oil and Gas Data Monetization Market Y-o-Y Growth (Value %) Forecast, 2016 – 2026
Figure 36 : Canada Oil and Gas Data Monetization Market Attractiveness Analysis, by Method (2018)
Figure 37 : Canada Oil and Gas Data Monetization Market Attractiveness Analysis, by Component (2018)
Figure 38 : Canada Oil and Gas Direct Data Monetization Market Attractiveness Analysis, by Application (2018)
Figure 39 : Canada Oil and Gas Indirect Data Monetization Market Attractiveness Analysis, by Application (2018)
Figure 40 : Canada Oil and Gas Direct Data Monetization Market Attractiveness Analysis, by E&P Lifecycle (2018)
Figure 41 : Canada Oil and Gas Indirect Data Monetization Market Attractiveness Analysis, by E&P Lifecycle (2018)
Figure 42 : Canada Oil and Gas Direct Data Monetization Market Attractiveness Analysis, by Oil Companies (2018)
Figure 43 : Canada Oil and Gas Indirect Data Monetization Market Attractiveness Analysis, by Oil Companies (2018)
Figure 44 : Germany Oil and Gas Data Monetization Market (US$ Mn) Forecast, 2016 – 2026
Figure 45 : Germany Oil and Gas Data Monetization Market Y-o-Y Growth (Value %) Forecast, 2016 – 2026
Figure 46 : Germany Oil and Gas Data Monetization Market Attractiveness Analysis, by Method (2018)
Figure 47 : Germany Oil and Gas Data Monetization Market Attractiveness Analysis, by Component (2018)
Figure 48 : Germany Oil and Gas Direct Data Monetization Market Attractiveness Analysis, by Application (2018)
Figure 49 : Germany Oil and Gas Indirect Data Monetization Market Attractiveness Analysis, by Application (2018)
Figure 50 : Germany Oil and Gas Direct Data Monetization Market Attractiveness Analysis, by E&P Lifecycle (2018)
Figure 51 : Germany Oil and Gas Indirect Data Monetization Market Attractiveness Analysis, by E&P Lifecycle (2018)
Figure 52 : Germany Oil and Gas Direct Data Monetization Market Attractiveness Analysis, by Oil Companies (2018)
Figure 53 : Germany Oil and Gas Indirect Data Monetization Market Attractiveness Analysis, by Oil Companies (2018)
Figure 54 : France Oil and Gas Data Monetization Market (US$ Mn) Forecast, 2016 – 2026
Figure 55 : France Oil and Gas Data Monetization Market Y-o-Y Growth (Value %) Forecast, 2016 – 2026
Figure 56 : France Oil and Gas Data Monetization Market Attractiveness Analysis, by Method (2018)
Figure 57 : France Oil and Gas Data Monetization Market Attractiveness Analysis, by Component (2018)
Figure 58 : France Oil and Gas Direct Data Monetization Market Attractiveness Analysis, by Application (2018)
Figure 59 : France Oil and Gas Indirect Data Monetization Market Attractiveness Analysis, by Application (2018)
Figure 60 : France Oil and Gas Direct Data Monetization Market Attractiveness Analysis, by E&P Lifecycle (2018)
Figure 61 : France Oil and Gas Indirect Data Monetization Market Attractiveness Analysis, by E&P Lifecycle (2018)
Figure 62 : France Oil and Gas Direct Data Monetization Market Attractiveness Analysis, by Oil Companies (2018)
Figure 63 : France Oil and Gas Indirect Data Monetization Market Attractiveness Analysis, by Oil Companies (2018)
Figure 64 : UK Oil and Gas Data Monetization Market (US$ Mn) Forecast, 2016 – 2026
Figure 65 : UK Oil and Gas Data Monetization Market Y-o-Y Growth (Value %) Forecast, 2016 – 2026
Figure 66 : UK Oil and Gas Data Monetization Market Attractiveness Analysis, by Method (2018)
Figure 67 : UK Oil and Gas Data Monetization Market Attractiveness Analysis, by Component (2018)
Figure 68 : UK Oil and Gas Direct Data Monetization Market Attractiveness Analysis, by Application (2018)
Figure 69 : UK Oil and Gas Indirect Data Monetization Market Attractiveness Analysis, by Application (2018)
Figure 70 : UK Oil and Gas Direct Data Monetization Market Attractiveness Analysis, by E&P Lifecycle (2018)
Figure 71 : UK Oil and Gas Indirect Data Monetization Market Attractiveness Analysis, by E&P Lifecycle (2018)
Figure 72 : UK Oil and Gas Direct Data Monetization Market Attractiveness Analysis, by Oil Companies (2018)
Figure 73 : UK Oil and Gas Indirect Data Monetization Market Attractiveness Analysis, by Oil Companies (2018)
Figure 74 : China Oil and Gas Data Monetization Market (US$ Mn) Forecast, 2016 – 2026
Figure 75 : China Oil and Gas Data Monetization Market Y-o-Y Growth (Value %) Forecast, 2016 – 2026
Figure 76 : China Oil and Gas Data Monetization Market Attractiveness Analysis, by Method (2018)
Figure 77 : China Oil and Gas Data Monetization Market Attractiveness Analysis, by Component (2018)
Figure 78 : China Oil and Gas Direct Data Monetization Market Attractiveness Analysis, by Application (2018)
Figure 79 : China Oil and Gas Indirect Data Monetization Market Attractiveness Analysis, by Application (2018)
Figure 80 : China Oil and Gas Direct Data Monetization Market Attractiveness Analysis, by E&P Lifecycle (2018)
Figure 81 : China Oil and Gas Indirect Data Monetization Market Attractiveness Analysis, by E&P Lifecycle (2018)
Figure 82 : China Oil and Gas Direct Data Monetization Market Attractiveness Analysis, by Oil Companies (2018)
Figure 83 : China Oil and Gas Indirect Data Monetization Market Attractiveness Analysis, by Oil Companies (2018)
Figure 84 : Japan Oil and Gas Data Monetization Market (US$ Mn) Forecast, 2016 – 2026
Figure 85 : Japan Oil and Gas Data Monetization Market Y-o-Y Growth (Value %) Forecast, 2016 – 2026
Figure 86 : Japan Oil and Gas Data Monetization Market Attractiveness Analysis, by Method (2018)
Figure 87 : Japan Oil and Gas Data Monetization Market Attractiveness Analysis, by Component (2018)
Figure 88 : Japan Oil and Gas Direct Data Monetization Market Attractiveness Analysis, by Application (2018)
Figure 89 : Japan Oil and Gas Indirect Data Monetization Market Attractiveness Analysis, by Application (2018)
Figure 90 : Japan Oil and Gas Direct Data Monetization Market Attractiveness Analysis, by E&P Lifecycle (2018)
Figure 91 : Japan Oil and Gas Indirect Data Monetization Market Attractiveness Analysis, by E&P Lifecycle (2018)
Figure 92 : Japan Oil and Gas Direct Data Monetization Market Attractiveness Analysis, by Oil Companies (2018)
Figure 93 : Japan Oil and Gas Indirect Data Monetization Market Attractiveness Analysis, by Oil Companies (2018)
Figure 94: India Oil and Gas Data Monetization Market (US$ Mn) Forecast, 2016 – 2026
Figure 95: India Oil and Gas Data Monetization Market Y-o-Y Growth (Value %) Forecast, 2016 – 2026
Figure 96: India Oil and Gas Data Monetization Market Attractiveness Analysis, by Method (2018)
Figure 97: India Oil and Gas Data Monetization Market Attractiveness Analysis, by Component (2018)
Figure 98: India Oil and Gas Direct Data Monetization Market Attractiveness Analysis, by Application (2018)
Figure 99: India Oil and Gas Indirect Data Monetization Market Attractiveness Analysis, by Application (2018)
Figure 100: India Oil and Gas Direct Data Monetization Market Attractiveness Analysis, by E&P Lifecycle (2018)
Figure 101: India Oil and Gas Indirect Data Monetization Market Attractiveness Analysis, by E&P Lifecycle (2018)
Figure 102: India Oil and Gas Direct Data Monetization Market Attractiveness Analysis, by Oil Companies (2018)
Figure 103 : India Oil and Gas Indirect Data Monetization Market Attractiveness Analysis, by Oil Companies (2018)
Figure 104 : Australia Oil and Gas Data Monetization Market (US$ Mn) Forecast, 2016 – 2026
Figure 105 : Australia Oil and Gas Data Monetization Market Y-o-Y Growth (Value %) Forecast, 2016 – 2026
Figure 106 : Australia Oil and Gas Data Monetization Market Attractiveness Analysis, by Method (2018)
Figure 107 : Australia Oil and Gas Data Monetization Market Attractiveness Analysis, by Component (2018)
Figure 108 : Australia Oil and Gas Direct Data Monetization Market Attractiveness Analysis, by Application (2018)
Figure 109 : Australia Oil and Gas Indirect Data Monetization Market Attractiveness Analysis, by Application (2018)
Figure 110 : Australia Oil and Gas Direct Data Monetization Market Attractiveness Analysis, by E&P Lifecycle (2018)
Figure 111 : Australia Oil and Gas Indirect Data Monetization Market Attractiveness Analysis, by E&P Lifecycle (2018)
Figure 112 : Australia Oil and Gas Direct Data Monetization Market Attractiveness Analysis, by Oil Companies (2018)
Figure 113 : Australia Oil and Gas Indirect Data Monetization Market Attractiveness Analysis, by Oil Companies (2018)
Figure 114 : GCC Oil and Gas Data Monetization Market (US$ Mn) Forecast, 2016 – 2026
Figure 115: GCC Oil and Gas Data Monetization Market Y-o-Y Growth (Value %) Forecast, 2016 – 2026
Figure 116 : GCC Oil and Gas Data Monetization Market Attractiveness Analysis, by Method (2018)
Figure 117 : GCC Oil and Gas Data Monetization Market Attractiveness Analysis, by Component (2018)
Figure 118 : GCC Oil and Gas Direct Data Monetization Market Attractiveness Analysis, by Application (2018)
Figure 119 : GCC Oil and Gas Indirect Data Monetization Market Attractiveness Analysis, by Application (2018)
Figure 120 : GCC Oil and Gas Direct Data Monetization Market Attractiveness Analysis, by E&P Lifecycle (2018)
Figure 121 : GCC Oil and Gas Indirect Data Monetization Market Attractiveness Analysis, by E&P Lifecycle (2018)
Figure 122 : GCC Oil and Gas Direct Data Monetization Market Attractiveness Analysis, by Oil Companies (2018)
Figure 123 : GCC Oil and Gas Indirect Data Monetization Market Attractiveness Analysis, by Oil Companies (2018)
Figure 124 : South Africa Oil and Gas Data Monetization Market (US$ Mn) Forecast, 2016 – 2026
Figure 125: South Africa Oil and Gas Data Monetization Market Y-o-Y Growth (Value %) Forecast, 2016 – 2026
Figure 126 : South Africa Oil and Gas Data Monetization Market Attractiveness Analysis, by Method (2018)
Figure 127 : South Africa Oil and Gas Data Monetization Market Attractiveness Analysis, by Component (2018)
Figure 128 : South Africa Oil and Gas Direct Data Monetization Market Attractiveness Analysis, by Application (2018)
Figure 129 : South Africa Oil and Gas Indirect Data Monetization Market Attractiveness Analysis, by Application (2018)
Figure 130 : South Africa Oil and Gas Direct Data Monetization Market Attractiveness Analysis, by E&P Lifecycle (2018)
Figure 131 : South Africa Oil and Gas Indirect Data Monetization Market Attractiveness Analysis, by E&P Lifecycle (2018)
Figure 132 : South Africa Oil and Gas Direct Data Monetization Market Attractiveness Analysis, by Oil Companies (2018)
Figure 133 : South Africa Oil and Gas Indirect Data Monetization Market Attractiveness Analysis, by Oil Companies (2018)
Figure 134 : Brazil Oil and Gas Data Monetization Market (US$ Mn) Forecast, 2016 – 2026
Figure 135: Brazil Oil and Gas Data Monetization Market Y-o-Y Growth (Value %) Forecast, 2016 – 2026
Figure 136 : Brazil Oil and Gas Data Monetization Market Attractiveness Analysis, by Method (2018)
Figure 137 : Brazil Oil and Gas Data Monetization Market Attractiveness Analysis, by Component (2018)
Figure 138 : Brazil Oil and Gas Direct Data Monetization Market Attractiveness Analysis, by Application (2018)
Copyright © Transparency Market Research, Inc. All Rights reserved
Trust Online

Oil and Gas Data Monetization Market