
Reports
Reports
Analysts’ Viewpoint on Cryotubes Market Scenario
The global cryotubes market is expected to grow at a steady pace during the forecast period due to the increase in demand for safe storage containers for preserving various biological samples in research organizations and healthcare institutions. Demand for cryotubes is driven by their unique properties. Cryotubes are gaining attention in health care and life sciences sectors, as they offer temperature resistance properties. Cryotubes are being widely used in medical and pharmaceutical applications, as biological samples require an extended shelf life and need to be stored safely. Companies in the global cryotubes market should tap into incremental opportunities by offering customized solutions based on demand of end-use industries to broaden their revenue streams.
Cryotubes are used to store biological samples at extreme temperatures in healthcare institutions, research organizations, etc. Various microbiological samples such as human or animal cells, tissues, embryos, and biological materials can be preserved at very low temperatures using these cryotubes. The global cryotubes market is expected to grow during the forecast period, owing to the increase in need for sample containers in research organizations to store various medical samples.
The COVID-19 situation has positively impacted the global cryotubes market due to the increase in production and supply of medicines and drugs during the pandemic. The global cryotubes market is driven by the higher production of vaccines for various testing purposes. Higher immunization has also boosted the demand for cryotubes. Various research organizations use cryotubes significantly for testing and sampling processes. Cryotubes were used widely in the medical industry during the peak of the COVID-19 pandemic. This created lucrative opportunities for manufacturers of cryotubes.
Despite the pandemic situation, the growth of research and pharmaceutical industries remained unaffected. Demand for vaccines, drugs, and other medications rose significantly during the peak of the pandemic.
Healthcare organizations and research institutions are focusing on different types of vaccines and materials to store biological samples. This is augmenting the sales of cryotubes. Cryotubes are widely used for storing blood samples without any atmospheric effect. Increase in number of research organizations and rise in government initiatives for increased research on various drugs and samples are fueling the demand for cryotubes. Thus, the global cryotubes market growth forecast appears positive during the forecast period.
Key players operating in the cryotubes market are focusing on providing innovative cryotubes for end-use applications. ‘CryoTraq’ provides a barcode system in the base of cryotubes. These tubes have a 2D data matrix barcode service, which provides full sample traceability. Manufacturers are provided with external and internal threaded caps. This is creating a positive growth outlook and multiple revenue opportunities for players in the global cryotubes market.
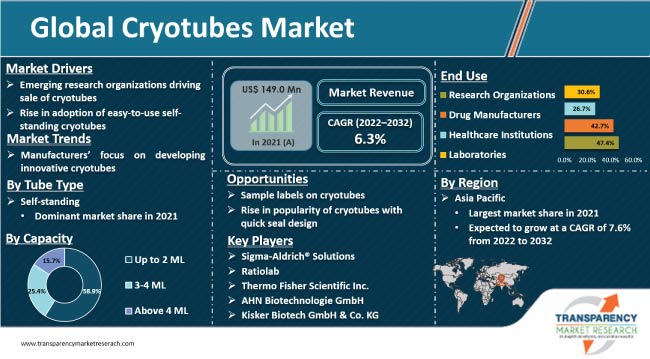
Biological samples are stored for several months in cold storage. Such samples need information on containers for identification purposes. Thus, the usage of sample labels for cryotubes is gaining traction among manufacturers. Besides this, some of the cryotubes are offered with color caps for easy recognition. Research organizations and laboratories store large amounts of samples for different purposes. Therefore, it is mandatory to use the correct sample labels. These are the positive cryotubes market aspects that are expected to propel the market during the forecast period.
In terms of tube type, the global cryotubes market has been divided into self-standing and round bottom. The self-standing segment held major share of the global market in 2021. The segment is expected to maintain its leading position in the market during the forecast period. Self-standing cryotubes are easy-to-use and remain stable for a long time. They do not require support during the sample pouring and storing process. Demand for self-standing cryotubes is high, as these cryotubes can be kept directly in the refrigerator for a longer duration without any support. There is no chance of leakage of the sample stored.
Cryotubes are widely used in research labs for sample storage. Cryotubes require opening and closing with both the hands, as the sample in it is important for further testing. However, it is difficult to handle cryotubes with both hands during the reaction process, as the pipetting sample gets underway. Therefore, AHN Biotechnologie GmbH has launched the Maxxline cryotubes that are easy to seal and easy to use for various purposes in life science and research labs.
The U.S. FDA advises drug manufacturers that Burkholderia cepacia complex poses a contamination risk in non-sterile water-based drug products. Demand for cryotubes is rising, as these tubes help avoid the issue of contamination during drug storage and help maintain the drug sample. Cryotubes are primarily prepared by using the polypropylene material, as the material has the efficacy of reaching ultra-high temperature (up to 196°C) without any cracking. Cryotubes can be decontaminated through the autoclave process at a temperature of 121°C. This reduces the chance of cross-contamination. Hence, storage of drug samples with the ability to maintain them without any contamination is fueling the demand for cryotubes.
Cryotubes have the ability to store samples at a lower temperature for serval months from cold storage till transportation without any drug leakage. Hence, drug manufacturers have started using cryotubes for safe transportation and storage of drugs.
Asia Pacific is estimated to remain the leading market for cryotubes during the forecast period. Emerging research organizations, development of new medications, and rise in investment in R&D by healthcare companies in the region are major factors projected to drive the Asia Pacific cryotubes market in the next few years. The market in Asia Pacific is projected to grow 1.6 times its present market value during the forecast period. Developing countries such as Japan and China have favorable market dynamics for cryotubes owing to the rise in number of research labs and chemical testing labs; increase in demand for medical and healthcare services; and entry of various local & global packaging manufacturers in these countries. Rise in awareness about health is also expected to drive the demand for cryotubes in Asia Pacific during the forecast period. Furthermore, government initiatives and increase in expenditure on R&D are projected to augment the demand for cryotubes in the region.
The global cryotubes market is fragmented, with the presence of large numbers of manufacturers that control majority of the share. Mergers and acquisitions and development of product portfolios are major strategies adopted by key players. The global cryotubes market assessment report includes various sections such as cryotubes market drivers, cryotubes market restraints, cryotubes market challenges, cryotubes market pricing analysis, cryotubes market supply analysis, cryotubes market sales analysis, and cryotubes market opportunities analysis. It also focuses on cryotubes market competition analysis, cryotubes market trends, cryotubes market recent developments, and cryotubes market demand analysis.
Key players operating in the global cryotubes market are Sigma-Aldrich® Solutions (Merck KGaA), Ratiolab, Thermo Fisher Scientific Inc., AHN Biotechnologie GmbH, Kisker Biotech GmbH & Co. KG, CAPP, Biologix Group Ltd., TPP Techno Plastic Products AG, Citotest Labware Manufacturing Co. Ltd., WATSON Bio Lab USA, and Ziath Ltd.
Each of these companies has been summarized in the cryotubes market report based on factors such as financial overview, company overview, business strategies, business segments, application portfolio, and recent developments.
|
Attribute |
Detail |
|
Market Size Value in 2021 |
US$ 149.0 Mn |
|
Market Forecast Value in 2032 |
US$ 285.6 Mn |
|
Growth Rate (CAGR) |
6.3% from 2022 to 2032 |
|
Forecast Period |
2022–2032 |
|
Quantitative Units |
US$ Mn for Value and Units for Volume |
|
Market Analysis |
It includes cross-segment analysis at the global as well as regional levels. Moreover, the qualitative analysis includes drivers, restraints, opportunities, key trends, and a parent industry overview. |
|
Competition Landscape |
|
|
Format |
Electronic (PDF) + Excel |
|
Market Segmentation |
|
|
Regions Covered |
|
|
Countries Covered |
|
|
Companies Profiled |
|
|
Customization Scope |
Available upon request |
|
Pricing |
Available upon request |
The global cryotubes market was valued at US$ 149.0 Mn in 2021
The global cryotubes market is projected to grow at a CAGR of 6.3% during 2022 to 2032
The global cryotubes market is projected to reach US$ 285.6 Mn by the end of 2032
Surge in demand for sample containers in healthcare industry
The self-standing tube type is largely preferred by end-use industries due to its various benefits
Asia Pacific is estimated to showcase high demand for cryotubes during the forecast period
Sigma-Aldrich® Solutions (Merck KGaA), Ratiolab, Thermo Fisher Scientific Inc., AHN Biotechnologie GmbH, Kisker Biotech GmbH & Co. KG, and CAPP
As per TMR analysis, the China cryotubes market is anticipated to grow 1.7 times the current market value during the forecast period
1. Executive Summary
1.1. Market Overview
1.2. Market Analysis
1.3. TMR Analysis and Recommendations
2. Market Viewpoint
2.1. Market Definition
2.2. Market Taxonomy
3. Cryotubes Market Overview
3.1. Introduction
3.2. Global Cryotubes Market Overview
3.3. Cryotubes Market (US$ Mn) Forecast
3.4. Value Chain Analysis
3.4.1. Exhaustive List of Active Participants
3.4.1.1. Raw Material Suppliers
3.4.1.2. Cryotubes Manufacturers/Distributors
3.4.1.3. End Users/Customers
3.4.2. Profitability Margins
3.5. Macro-economic Factors – Correlation Analysis
3.6. Forecast Factors – Relevance & Impact
4. Impact of COVID-19
4.1. Current Statistics and Probable Future Impact
4.2. Impact of COVID-19 on Target Market
5. Cryotubes Market Analysis
5.1. Pricing Analysis
5.1.1. Pricing Assumption
5.1.2. Price Projections By Region
5.2. Market Size (US$ Mn) and Forecast
5.2.1. Market Size and Y-o-Y Growth
5.2.2. Absolute $ Opportunity
6. Cryotubes Market Dynamics
6.1. Drivers
6.2. Restraints
6.3. Opportunity Analysis
6.4. Trends
7. Global Cryotubes Market Analysis and Forecast, By Tube Type
7.1. Introduction
7.1.1. Market share and Basis Points (BPS) Analysis, By Tube Type
7.1.2. Y-o-Y Growth Projections, By Tube Type
7.2. Historical Market Value (US$ Mn) and Volume (Units), 2016-2021, By Tube Type
7.2.1. Self-standing
7.2.2. Round Bottom
7.3. Market Size (US$ Mn) and Volume (Units) Forecast Analysis 2022-2032, By Tube Type
7.3.1. Self-standing
7.3.2. Round Bottom
7.4. Market Attractiveness Analysis, By Tube Type
8. Global Cryotubes Market Analysis and Forecast, By Capacity
8.1. Introduction
8.1.1. Market share and Basis Points (BPS) Analysis, By Capacity
8.1.2. Y-o-Y Growth Projections, By Capacity
8.2. Historical Market Value (US$ Mn) and Volume (Units), 2016-2021, By Capacity
8.2.1. Up to 2 ML
8.2.2. 3-4 ML
8.2.3. Above 4 ML
8.3. Market Size (US$ Mn) and Volume (Units) Forecast Analysis 2022-2032, By Capacity
8.3.1. Up to 2 ML
8.3.2. 3-4 ML
8.3.3. Above 4 ML
8.4. Market Attractiveness Analysis, By Capacity
9. Global Cryotubes Market Analysis and Forecast, By End Use
9.1. Introduction
9.1.1. Market share and Basis Points (BPS) Analysis, By End Use
9.1.2. Y-o-Y Growth Projections, By End Use
9.2. Historical Market Value (US$ Mn) and Volume (Units), 2016-2021, By End Use
9.2.1. Research Organizations
9.2.2. Drug Manufacturers
9.2.3. Healthcare Institutions
9.2.4. Laboratories
9.3. Market Size (US$ Mn) and Volume (Units) Forecast Analysis 2022-2032, By End Use
9.3.1. Research Organizations
9.3.2. Drug Manufacturers
9.3.3. Healthcare Institutions
9.3.4. Laboratories
9.4. Market Attractiveness Analysis, By End Use
9.5. Prominent Trends
10. Global Cryotubes Market Analysis and Forecast, By Region
10.1. Introduction
10.1.1. Market share and Basis Points (BPS) Analysis By Region
10.1.2. Y-o-Y Growth Projections By Region
10.2. Historical Market Value (US$ Mn) and Volume (Units), 2016-2021, By Region
10.2.1. North America
10.2.2. Latin America
10.2.3. Europe
10.2.4. Asia Pacific
10.2.5. Middle East & Africa
10.3. Market Size (US$ Mn) and Volume (Units) Forecast Analysis 2022-2032 By Region
10.3.1. North America
10.3.2. Latin America
10.3.3. Europe
10.3.4. Asia Pacific
10.3.5. Middle East & Africa
10.4. Market Attractiveness Analysis By Region
11. North America Cryotubes Market Analysis and Forecast
11.1. Introduction
11.1.1. Market share and Basis Points (BPS) Analysis, By Country
11.1.2. Y-o-Y Growth Projections, By Country
11.2. Historical Market Value (US$ Mn) and Volume (Units), 2016-2021, By Country
11.3. Market Size (US$ Mn) and Volume (Units) Forecast Analysis 2022-2032, By Country
11.3.1. U.S.
11.3.2. Canada
11.4. Historical Market Value (US$ Mn) and Volume (Units), 2016-2021, By Tube Type
11.5. Market Size (US$ Mn) and Volume (Units) Forecast Analysis 2022-2032 Analysis 2022-2032, By Tube Type
11.5.1. Self-standing
11.5.2. Round Bottom
11.6. Historical Market Value (US$ Mn) and Volume (Units), 2016-2021, By Capacity
11.7. Market Size (US$ Mn) and Volume (Units) Forecast Analysis 2022-2032 Analysis 2022-2032, By Capacity
11.7.1. Up to 2 ML
11.7.2. 3-4 ML
11.7.3. Above 4 ML
11.8. Historical Market Value (US$ Mn) and Volume (Units), 2016-2021, By End Use
11.9. Market Size (US$ Mn) and Volume (Units) Forecast Analysis 2022-2032, By End Use
11.9.1. Research Organizations
11.9.2. Drug Manufacturers
11.9.3. Healthcare Institutions
11.9.4. Laboratories
11.10. Market Attractiveness Analysis
11.10.1. By Country
11.10.2. By Tube Type
11.10.3. By Capacity
11.10.4. By End Use
12. Latin America Cryotubes Market Analysis and Forecast
12.1. Introduction
12.1.1. Market share and Basis Points (BPS) Analysis, By Country
12.1.2. Y-o-Y Growth Projections, By Country
12.2. Historical Market Value (US$ Mn) and Volume (Units), 2016-2021, By Country
12.3. Market Size (US$ Mn) and Volume (Units) Forecast Analysis 2022-2032 By Country
12.3.1. Brazil
12.3.2. Mexico
12.3.3. Argentina
12.3.4. Rest of Latin America
12.4. Historical Market Value (US$ Mn) and Volume (Units), 2016-2021, By Tube Type
12.5. Market Size (US$ Mn) and Volume (Units) Forecast Analysis 2022-2032 Analysis 2022-2032, By Tube Type
12.5.1. Self-standing
12.5.2. Round Bottom
12.6. Historical Market Value (US$ Mn) and Volume (Units), 2016-2021, By Capacity
12.7. Market Size (US$ Mn) and Volume (Units) Forecast Analysis 2022-2032 Analysis 2022-2032, By Capacity
12.7.1. Up to 2 ML
12.7.2. 3-4 ML
12.7.3. Above 4 ML
12.8. Historical Market Value (US$ Mn) and Volume (Units), 2016-2021, By End Use
12.9. Market Size (US$ Mn) and Volume (Units) Forecast Analysis 2022-2032, By End Use
12.9.1. Research Organizations
12.9.2. Drug Manufacturers
12.9.3. Healthcare Institutions
12.9.4. Laboratories
12.10. Market Attractiveness Analysis
12.10.1. By Country
12.10.2. By Tube Type
12.10.3. By Capacity
12.10.4. By End Use
13. Europe Cryotubes Market Analysis and Forecast
13.1. Introduction
13.1.1. Market share and Basis Points (BPS) Analysis, By Country
13.1.2. Y-o-Y Growth Projections, By Country
13.2. Historical Market Value (US$ Mn) and Volume (Units), 2016-2021, By Country
13.3. Market Size (US$ Mn) and Volume (Units) Forecast Analysis 2022-2032 By Country
13.3.1. Germany
13.3.2. Italy
13.3.3. Spain
13.3.4. Russia
13.3.5. U.K.
13.3.6. France
13.3.7. Benelux
13.3.8. Rest of Europe
13.4. Historical Market Value (US$ Mn) and Volume (Units), 2016-2021, By Tube Type
13.5. Market Size (US$ Mn) and Volume (Units) Forecast Analysis 2022-2032 Analysis 2022-2032, By Tube Type
13.5.1. Self-standing
13.5.2. Round Bottom
13.6. Historical Market Value (US$ Mn) and Volume (Units), 2016-2021, By Capacity
13.7. Market Size (US$ Mn) and Volume (Units) Forecast Analysis 2022-2032 Analysis 2022-2032, By Capacity
13.7.1. Up to 2 ML
13.7.2. 3-4 ML
13.7.3. Above 4 ML
13.8. Historical Market Value (US$ Mn) and Volume (Units), 2016-2021, By End Use
13.9. Market Size (US$ Mn) and Volume (Units) Forecast Analysis 2022-2032, By End Use
13.9.1. Research Organizations
13.9.2. Drug Manufacturers
13.9.3. Healthcare Institutions
13.9.4. Laboratories
13.10. Market Attractiveness Analysis
13.10.1. By Country
13.10.2. By Tube Type
13.10.3. By Capacity
13.10.4. By End Use
14. Asia Pacific Cryotubes Market Analysis and Forecast
14.1. Introduction
14.1.1. Market share and Basis Points (BPS) Analysis, By Country
14.1.2. Y-o-Y Growth Projections, By Country
14.2. Historical Market Value (US$ Mn) and Volume (Units), 2016-2021, By Country
14.3. Market Size (US$ Mn) and Volume (Units) Forecast Analysis 2022-2032 By Country
14.3.1. China
14.3.2. India
14.3.3. ASEAN
14.3.4. Australia & New Zealand
14.3.5. Japan
14.3.6. Rest of Asia Pacific
14.4. Historical Market Value (US$ Mn) and Volume (Units), 2016-2021, By Tube Type
14.5. Market Size (US$ Mn) and Volume (Units) Forecast Analysis 2022-2032 Analysis 2022-2032, By Tube Type
14.5.1. Self-standing
14.5.2. Round Bottom
14.6. Historical Market Value (US$ Mn) and Volume (Units), 2016-2021, By Capacity
14.7. Market Size (US$ Mn) and Volume (Units) Forecast Analysis 2022-2032 Analysis 2022-2032, By Capacity
14.7.1. Up to 2 ML
14.7.2. 3-4 ML
14.7.3. Above 4 ML
14.8. Historical Market Value (US$ Mn) and Volume (Units), 2016-2021, By End Use
14.9. Market Size (US$ Mn) and Volume (Units) Forecast Analysis 2022-2032, By End Use
14.9.1. Research Organizations
14.9.2. Drug Manufacturers
14.9.3. Healthcare Institutions
14.9.4. Laboratories
14.10. Market Attractiveness Analysis
14.10.1. By Country
14.10.2. By Tube Type
14.10.3. By Capacity
14.10.4. By End Use
15. Middle East & Africa Cryotubes Market Analysis and Forecast
15.1. Introduction
15.1.1. Market share and Basis Points (BPS) Analysis, By Country
15.1.2. Y-o-Y Growth Projections, By Country
15.2. Historical Market Value (US$ Mn) and Volume (Units), 2016-2021, By Country
15.3. Market Size (US$ Mn) and Volume (Units) Forecast Analysis 2022-2032, By Country
15.3.1. Northern Africa
15.3.2. GCC countries
15.3.3. South Africa
15.3.4. Turkey
15.3.5. Rest of MEA
15.4. Historical Market Value (US$ Mn) and Volume (Units), 2016-2021, By Tube Type
15.5. Market Size (US$ Mn) and Volume (Units) Forecast Analysis 2022-2032 Analysis 2022-2032, By Tube Type
15.5.1. Self-standing
15.5.2. Round Bottom
15.6. Historical Market Value (US$ Mn) and Volume (Units), 2016-2021, By Capacity
15.7. Market Size (US$ Mn) and Volume (Units) Forecast Analysis 2022-2032 Analysis 2022-2032, By Capacity
15.7.1. Up to 2 ML
15.7.2. 3-4 ML
15.7.3. Above 4 ML
15.8. Historical Market Value (US$ Mn) and Volume (Units), 2016-2021, By End Use
15.9. Market Size (US$ Mn) and Volume (Units) Forecast Analysis 2022-2032, By End Use
15.9.1. Research Organizations
15.9.2. Drug Manufacturers
15.9.3. Healthcare Institutions
15.9.4. Laboratories
15.10. Market Attractiveness Analysis
15.10.1. By Country
15.10.2. By Tube Type
15.10.3. By Capacity
15.10.4. By End Use
16. Country-wise Cryotubes Market Analysis, 2022-2032
16.1. U.S. Cryotubes Market Analysis
16.1.1. By Tube Type
16.1.2. By Capacity
16.1.3. By End Use
16.2. Canada Cryotubes Market Analysis
16.2.1. By Tube Type
16.2.2. By Capacity
16.2.3. By End Use
16.3. Brazil Cryotubes Market Analysis
16.3.1. By Tube Type
16.3.2. By Capacity
16.3.3. By End Use
16.4. Mexico Cryotubes Market Analysis
16.4.1. By Tube Type
16.4.2. By Capacity
16.4.3. By End Use
16.5. Germany Cryotubes Market Analysis
16.5.1. By Tube Type
16.5.2. By Capacity
16.5.3. By End Use
16.6. Spain Cryotubes Market Analysis
16.6.1. By Tube Type
16.6.2. By Capacity
16.6.3. By End Use
16.7. France Cryotubes Market Analysis
16.7.1. By Tube Type
16.7.2. By Capacity
16.7.3. By End Use
16.8. U K Cryotubes Market Analysis
16.8.1. By Tube Type
16.8.2. By Capacity
16.8.3. By End Use
16.9. Italy Cryotubes Market Analysis
16.9.1. By Tube Type
16.9.2. By Capacity
16.9.3. By End Use
16.10. Russia Cryotubes Market Analysis
16.10.1. By Tube Type
16.10.2. By Capacity
16.10.3. By End Use
16.11. China Cryotubes Market Analysis
16.11.1. By Tube Type
16.11.2. By Capacity
16.11.3. By End Use
16.12. India Cryotubes Market Analysis
16.12.1. By Tube Type
16.12.2. By Capacity
16.12.3. By End Use
16.13. Japan Cryotubes Market Analysis
16.13.1. By Tube Type
16.13.2. By Capacity
16.13.3. By End Use
16.14. GCC Countries Cryotubes Market Analysis
16.14.1. By Tube Type
16.14.2. By Capacity
16.14.3. By End Use
16.15. South Africa Cryotubes Market Analysis
16.15.1. By Tube Type
16.15.2. By Capacity
16.15.3. By End Use
17. Competitive Landscape
17.1. Market Structure
17.2. Competition Dashboard
17.3. Company Market Share Analysis
17.4. Company Profiles (Details – Overview, Financials, Strategy, Recent Developments, SWOT analysis)
17.5. Competition Deep Dive
(Key Global Market Players)
17.5.1. Sigma-Aldrich® Solutions (Merck KGaA)
17.5.1.1. Overview
17.5.1.2. Financials
17.5.1.3. Strategy
17.5.1.4. Recent Developments
17.5.1.5. SWOT Analysis
17.5.2. Ratiolab
17.5.2.1. Overview
17.5.2.2. Financials
17.5.2.3. Strategy
17.5.2.4. Recent Developments
17.5.2.5. SWOT Analysis
17.5.3. Thermo Fisher Scientific Inc.
17.5.3.1. Overview
17.5.3.2. Financials
17.5.3.3. Strategy
17.5.3.4. Recent Developments
17.5.3.5. SWOT Analysis
17.5.4. AHN Biotechnologie GmbH
17.5.4.1. Overview
17.5.4.2. Financials
17.5.4.3. Strategy
17.5.4.4. Recent Developments
17.5.4.5. SWOT Analysis
17.5.5. Kisker Biotech GmbH & Co. KG
17.5.5.1. Overview
17.5.5.2. Financials
17.5.5.3. Strategy
17.5.5.4. Recent Developments
17.5.5.5. SWOT Analysis
17.5.6. CAPP
17.5.6.1. Overview
17.5.6.2. Financials
17.5.6.3. Strategy
17.5.6.4. Recent Developments
17.5.6.5. SWOT Analysis
17.5.7. Biologix Group Ltd.
17.5.7.1. Overview
17.5.7.2. Financials
17.5.7.3. Strategy
17.5.7.4. Recent Developments
17.5.7.5. SWOT Analysis
17.5.8. Placon Corporation Inc.
17.5.8.1. Overview
17.5.8.2. Financials
17.5.8.3. Strategy
17.5.8.4. Recent Developments
17.5.8.5. SWOT Analysis
17.5.9. TPP Techno Plastic Products AG
17.5.9.1. Overview
17.5.9.2. Financials
17.5.9.3. Strategy
17.5.9.4. Recent Developments
17.5.9.5. SWOT Analysis
17.5.10. Zhejiang Sorfa Life Science Research Co. Ltd.
17.5.10.1. Overview
17.5.10.2. Financials
17.5.10.3. Strategy
17.5.10.4. Recent Developments
17.5.10.5. SWOT Analysis
17.5.11. Citotest Labware Manufacturing Co. Ltd.
17.5.11.1. Overview
17.5.11.2. Financials
17.5.11.3. Strategy
17.5.11.4. Recent Developments
17.5.11.5. SWOT Analysis
17.5.12. ZHEJIANG RUNLAB TECHNOLOGY CO., LTD.
17.5.12.1. Overview
17.5.12.2. Financials
17.5.12.3. Strategy
17.5.12.4. Recent Developments
17.5.12.5. SWOT Analysis
17.5.13. Jinhua Noke Biotechnology Co., Ltd.
17.5.13.1. Overview
17.5.13.2. Financials
17.5.13.3. Strategy
17.5.13.4. Recent Developments
17.5.13.5. SWOT Analysis
17.5.14. JIANGSU HXRT MD CO., LTD.
17.5.14.1. Overview
17.5.14.2. Financials
17.5.14.3. Strategy
17.5.14.4. Recent Developments
17.5.14.5. SWOT Analysis
17.5.15. WATSON Bio Lab USA
17.5.15.1. Overview
17.5.15.2. Financials
17.5.15.3. Strategy
17.5.15.4. Recent Developments
17.5.15.5. SWOT Analysis
17.5.16. Ziath Ltd.
17.5.16.1. Overview
17.5.16.2. Financials
17.5.16.3. Strategy
17.5.16.4. Recent Developments
17.5.16.5. SWOT Analysis
18. Assumptions and Acronyms Used
19. Research Methodology
List of Tables
Table 01: Global Cryotubes Market Historic Value (US$ Mn), by Tube Type 2016(H)-2021(A)
Table 02: Global Cryotubes Market Forecast Value (US$ Mn), by Tube Type 2022(E)-2032(F)
Table 03: Global Cryotubes Market Historic Volume (Units), by Tube Type 2016(H)-2021(A)
Table 04: Global Cryotubes Market Forecast Volume (Units), by Tube Type 2022(E)-2032(F)
Table 05: Global Cryotubes Market Historic Value (US$ Mn), by Capacity 2016(H)-2021(A)
Table 06: Global Cryotubes Market Forecast Value (US$ Mn), by Capacity 2022(E)-2032(F)
Table 07: Global Cryotubes Market Historic Volume (Units), by Capacity 2016(H)-2021(A)
Table 08: Global Cryotubes Market Forecast Volume (Units), by Capacity 2022(E)-2032(F)
Table 09: Global Cryotubes Market Historic Value (US$ Mn), by End Use2016(H)-2021(A)
Table 10: Global Cryotubes Market Forecast Value (US$ Mn), by End Use2022(E)-2032(F)
Table 11: Global Cryotubes Market Historic Volume (Units), by End Use2016(H)-2021(A)
Table 12: Global Cryotubes Market Forecast Volume (Units), by End Use2022(E)-2032(F)
Table 13: Global Cryotubes Market Historic Value (US$ Mn), by Region 2016(H)-2021(A)
Table 14: Global Cryotubes Market Forecast Value (US$ Mn), by Region 2022(E)-2032(F)
Table 15: Global Cryotubes Market Historic Volume (Units), by Region 2016(H)-2021(A)
Table 16: Global Cryotubes Market Forecast Volume (Units), by Region 2022(E)-2032(F)
Table 17: North America Cryotubes Market Historic Value (US$ Mn), by Tube Type 2016(H)-2021(A)
Table 18: North America Cryotubes Market Forecast Value (US$ Mn), by Tube Type 2022(E)-2032(F)
Table 19: North America Cryotubes Market Historic Volume (Units), by Tube Type 2016(H)-2021(A)
Table 20: North America Cryotubes Market Forecast Volume (Units), by Tube Type 2022(E)-2032(F)
Table 21: North America Cryotubes Market Historic Value (US$ Mn), by Capacity 2016(H)-2021(A)
Table 22: North America Cryotubes Market Forecast Value (US$ Mn), by Capacity 2022(E)-2032(F)
Table 23: North America Cryotubes Market Historic Volume (Units), by Capacity 2016(H)-2021(A)
Table 24: North America Cryotubes Market Forecast Volume (Units), by Capacity 2022(E)-2032(F)
Table 25: North America Cryotubes Market Historic Value (US$ Mn), by End Use2016(H)-2021(A)
Table 26: North America Cryotubes Market Forecast Value (US$ Mn), by End Use2022(E)-2032(F)
Table 27: North America Cryotubes Market Historic Volume (Units), by End Use2016(H)-2021(A)
Table 28: North America Cryotubes Market Forecast Volume (Units), by End Use2022(E)-2032(F)
Table 29: North America Cryotubes Market Historic Value (US$ Mn), by Country 2016(H)-2021(A)
Table 30: North America Cryotubes Market Forecast Value (US$ Mn), by Country 2022(E)-2032(F)
Table 31: North America Cryotubes Market Historic Volume (Units), by Country 2016(H)-2021(A)
Table 32: North America Cryotubes Market Forecast Volume (Units), by Country 2022(E)-2032(F)
Table 33: Latin America Cryotubes Market Historic Value (US$ Mn), by Tube Type 2016(H)-2021(A)
Table 34: Latin America Cryotubes Market Forecast Value (US$ Mn), by Tube Type 2022(E)-2032(F)
Table 35: Latin America Cryotubes Market Historic Volume (Units), by Tube Type 2016(H)-2021(A)
Table 36: Latin America Cryotubes Market Forecast Volume (Units), by Tube Type 2022(E)-2032(F)
Table 37: Latin America Cryotubes Market Historic Value (US$ Mn), by Capacity 2016(H)-2021(A)
Table 38: Latin America Cryotubes Market Forecast Value (US$ Mn), by Capacity 2022(E)-2032(F)
Table 39: Latin America Cryotubes Market Historic Volume (Units), by Capacity 2016(H)-2021(A)
Table 40: Latin America Cryotubes Market Forecast Volume (Units), by Capacity 2022(E)-2032(F)
Table 41: Latin America Cryotubes Market Historic Value (US$ Mn), by End Use2016(H)-2021(A)
Table 42: Latin America Cryotubes Market Forecast Value (US$ Mn), by End Use2022(E)-2032(F)
Table 43: Latin America Cryotubes Market Historic Volume (Units), by End Use2016(H)-2021(A)
Table 44: Latin America Cryotubes Market Forecast Volume (Units), by End Use2022(E)-2032(F)
Table 45: Latin America Cryotubes Market Historic Value (US$ Mn), by Country 2016(H)-2021(A)
Table 46: Latin America Cryotubes Market Forecast Value (US$ Mn), by Country 2022(E)-2032(F)
Table 47: Latin America Cryotubes Market Historic Volume (Units), by Country 2016(H)-2021(A)
Table 48: Latin America Cryotubes Market Forecast Volume (Units), by Country 2022(E)-2032(F)
Table 49: Europe Cryotubes Market Historic Value (US$ Mn), by Tube Type 2016(H)-2021(A)
Table 50: Europe Cryotubes Market Forecast Value (US$ Mn), by Tube Type 2022(E)-2032(F)
Table 51: Europe Cryotubes Market Historic Volume (Units), by Tube Type 2016(H)-2021(A)
Table 52: Europe Cryotubes Market Forecast Volume (Units), by Tube Type 2022(E)-2032(F)
Table 53: Europe Cryotubes Market Historic Value (US$ Mn), by Capacity 2016(H)-2021(A)
Table 54: Europe Cryotubes Market Forecast Value (US$ Mn), by Capacity 2022(E)-2032(F)
Table 55: Europe Cryotubes Market Historic Volume (Units), by Capacity 2016(H)-2021(A)
Table 56: Europe Cryotubes Market Forecast Volume (Units), by Capacity 2022(E)-2032(F)
Table 57: Europe Cryotubes Market Historic Value (US$ Mn), by End Use2016(H)-2021(A)
Table 58: Europe Cryotubes Market Forecast Value (US$ Mn), by End Use2022(E)-2032(F)
Table 59: Europe Cryotubes Market Historic Volume (Units), by End Use2016(H)-2021(A)
Table 60: Europe Cryotubes Market Forecast Volume (Units), by End Use2022(E)-2032(F)
Table 61: Europe Cryotubes Market Historic Value (US$ Mn), by Country 2016(H)-2021(A)
Table 62: Europe Cryotubes Market Forecast Value (US$ Mn), by Country 2022(E)-2032(F)
Table 63: Europe Cryotubes Market Historic Volume (Units), by Country 2016(H)-2021(A)
Table 64: Europe Cryotubes Market Forecast Volume (Units), by Country 2022(E)-2032(F)
Table 65: Asia Pacific Cryotubes Market Historic Value (US$ Mn), by Tube Type 2016(H)-2021(A)
Table 66: Asia Pacific Cryotubes Market Forecast Value (US$ Mn), by Tube Type 2022(E)-2032(F)
Table 67: Asia Pacific Cryotubes Market Historic Volume (Units), by Tube Type 2016(H)-2021(A)
Table 68: Asia Pacific Cryotubes Market Forecast Volume (Units), by Tube Type 2022(E)-2032(F)
Table 69: Asia Pacific Cryotubes Market Historic Value (US$ Mn), by Capacity 2016(H)-2021(A)
Table 70: Asia Pacific Cryotubes Market Forecast Value (US$ Mn), by Capacity 2022(E)-2032(F)
Table 71: Asia Pacific Cryotubes Market Historic Volume (Units), by Capacity 2016(H)-2021(A)
Table 72: Asia Pacific Cryotubes Market Forecast Volume (Units), by Capacity 2022(E)-2032(F)
Table 73: Asia Pacific Cryotubes Market Historic Value (US$ Mn), by End Use2016(H)-2021(A)
Table 74: Asia Pacific Cryotubes Market Forecast Value (US$ Mn), by End Use2022(E)-2032(F)
Table 75: Asia Pacific Cryotubes Market Historic Volume (Units), by End Use2016(H)-2021(A)
Table 76: Asia Pacific Cryotubes Market Forecast Volume (Units), by End Use2022(E)-2032(F)
Table 77: Asia Pacific Cryotubes Market Historic Value (US$ Mn), by Country 2016(H)-2021(A)
Table 78: Asia Pacific Cryotubes Market Forecast Value (US$ Mn), by Country 2022(E)-2032(F)
Table 79: Asia Pacific Cryotubes Market Historic Volume (Units), by Country 2016(H)-2021(A)
Table 80: Asia Pacific Cryotubes Market Forecast Volume (Units), by Country 2022(E)-2032(F)
Table 81: MEA Cryotubes Market Historic Value (US$ Mn), by Tube Type 2016(H)-2021(A)
Table 82: MEA Cryotubes Market Forecast Value (US$ Mn), by Tube Type 2022(E)-2032(F)
Table 83: MEA Cryotubes Market Historic Volume (Units), by Tube Type 2016(H)-2021(A)
Table 84: MEA Cryotubes Market Forecast Volume (Units), by Tube Type 2022(E)-2032(F)
Table 85: MEA Cryotubes Market Historic Value (US$ Mn), by Capacity 2016(H)-2021(A)
Table 86: MEA Cryotubes Market Forecast Value (US$ Mn), by Capacity 2022(E)-2032(F)
Table 87: MEA Cryotubes Market Historic Volume (Units), by Capacity 2016(H)-2021(A)
Table 88: MEA Cryotubes Market Forecast Volume (Units), by Capacity 2022(E)-2032(F)
Table 89: MEA Cryotubes Market Historic Value (US$ Mn), by End Use2016(H)-2021(A)
Table 90: MEA Cryotubes Market Forecast Value (US$ Mn), by End Use2022(E)-2032(F)
Table 91: MEA Cryotubes Market Historic Volume (Units), by End Use2016(H)-2021(A)
Table 92: MEA Cryotubes Market Forecast Volume (Units), by End Use2022(E)-2032(F)
Table 93: MEA Cryotubes Market Historic Value (US$ Mn), by Country 2016(H)-2021(A)
Table 94: MEA Cryotubes Market Forecast Value (US$ Mn), by Country 2022(E)-2032(F)
Table 95: MEA Cryotubes Market Historic Volume (Units), by Country 2016(H)-2021(A)
Table 96: MEA Cryotubes Market Forecast Volume (Units), by Country 2022(E)-2032(F)
List of Figures
Figure 01: Global Cryotubes Market Share Analysis by Tube Type, 2022E & 2032F
Figure 02: Global Cryotubes Market Attractiveness Analysis by Tube Type, 2022E-2032F
Figure 03: Global Cryotubes Market Y-o-Y Analysis by Tube Type, 2019H-2032F
Figure 04: Global Cryotubes Market Share Analysis by Capacity, 2022E & 2032F
Figure 05: Global Cryotubes Market Attractiveness Analysis by Capacity, 2022E-2032F
Figure 06: Global Cryotubes Market Y-o-Y Analysis by Capacity, 2019H-2032F
Figure 07: Global Cryotubes Market Share Analysis by End Use, 2022E & 2032F
Figure 08: Global Cryotubes Market Attractiveness Analysis by End Use, 2022E-2032F
Figure 09: Global Cryotubes Market Y-o-Y Analysis by End Use, 2019H-2032F
Figure 10: Global Cryotubes Market Share Analysis by Region, 2022E & 2032F
Figure 11: Global Cryotubes Market Attractiveness Analysis by Region, 2022E-2032F
Figure 12: Global Cryotubes Market Y-o-Y Analysis by Region, 2019H-2032F
Figure 13: North America Cryotubes Market Share Analysis by Tube Type, 2022E & 2032F
Figure 14: North America Cryotubes Market Value Share Analysis by Capacity 2022(E)
Figure 15: North America Cryotubes Market Attractiveness Analysis by End Use, 2022E-2031F
Figure 16: North America Cryotubes Market Value Share Analysis by Country 2022(E)
Figure 17: Latin America Cryotubes Market Share Analysis by Tube Type, 2022E & 2032F
Figure 18: Latin America Cryotubes Market Value Share Analysis by Capacity 2022(E)
Figure 19: Latin America Cryotubes Market Attractiveness Analysis by End Use, 2022E-2031F
Figure 20: Latin America Cryotubes Market Value Share Analysis by Country 2022(E)
Figure 21: Europe Cryotubes Market Share Analysis by Tube Type, 2022E & 2032F
Figure 22: Europe Cryotubes Market Value Share Analysis by Capacity 2022(E)
Figure 23: Europe Cryotubes Market Attractiveness Analysis by End Use, 2022E-2031F
Figure 24: Europe Cryotubes Market Value Share Analysis by Country 2022(E)
Figure 25: Asia Pacific Cryotubes Market Share Analysis by Tube Type, 2022E & 2032F
Figure 26: Asia Pacific Cryotubes Market Value Share Analysis by Capacity 2022(E)
Figure 27: Asia Pacific Cryotubes Market Attractiveness Analysis by End Use, 2022E-2031F
Figure 28: Asia Pacific Cryotubes Market Value Share Analysis by Country 2022(E)
Figure 29: MEA Cryotubes Market Share Analysis by Tube Type, 2022E & 2032F
Figure 30: MEA Cryotubes Market Value Share Analysis by Capacity 2022(E)
Figure 31: MEA Cryotubes Market Attractiveness Analysis by End Use, 2022E-2031F
Figure 32: MEA Cryotubes Market Value Share Analysis by Country 2022(E)
Figure 33: U.S. Cryotubes Market Value Share Analysis, by Tube Type, 2022E & 2032F
Figure 34: U.S. Cryotubes Market Value Share Analysis, by Capacity, 2022E
Figure 35: U.S. Cryotubes Market Value Share Analysis, by End Use, 2022E & 2032F
Figure 36: Canada Cryotubes Market Value Share Analysis, by Tube Type, 2022E & 2032F
Figure 37: Canada Cryotubes Market Value Share Analysis, by Capacity, 2022E
Figure 38: Canada Cryotubes Market Value Share Analysis, by End Use, 2022E & 2032F
Figure 39: Brazil Cryotubes Market Value Share Analysis, by Tube Type, 2022E & 2032F
Figure 40: Brazil Cryotubes Market Value Share Analysis, by Capacity, 2022E
Figure 41: Brazil Cryotubes Market Value Share Analysis, by End Use, 2022E & 2032F
Figure 42: Mexico Cryotubes Market Value Share Analysis, by Tube Type, 2022E & 2032F
Figure 43: Mexico Cryotubes Market Value Share Analysis, by Capacity, 2022E
Figure 44: Mexico Cryotubes Market Value Share Analysis, by End Use, 2022E & 2032F
Figure 45: Germany Cryotubes Market Value Share Analysis, by Tube Type, 2022E & 2032F
Figure 46: Germany Cryotubes Market Value Share Analysis, by Capacity, 2022E
Figure 47: Germany Specialty Paper Market Value Share Analysis, by End Use, 2022E & 2032F
Figure 48: Spain Cryotubes Market Value Share Analysis, by Tube Type, 2022E & 2032F
Figure 49: Spain Cryotubes Market Value Share Analysis, by Capacity, 2022E
Figure 50: Spain Cryotubes Market Value Share Analysis, by End Use, 2022E & 2032F
Figure 51: France Cryotubes Market Value Share Analysis, by Tube Type, 2022E & 2032F
Figure 52: France Cryotubes Market Value Share Analysis, by Capacity, 2022E
Figure 53: France Cryotubes Market Value Share Analysis, by End Use, 2022E & 2032F
Figure 54: U.K. Cryotubes Market Value Share Analysis, by Tube Type, 2022E & 2032F
Figure 55: U.K. Cryotubes Market Value Share Analysis, by Capacity, 2022E
Figure 56: U.K. Cryotubes Market Value Share Analysis, by End Use, 2022E & 2032F
Figure 57: Italy Cryotubes Market Value Share Analysis, by Tube Type, 2022E & 2032F
Figure 58: Italy Cryotubes Market Value Share Analysis, by Capacity, 2022E
Figure 59: Italy Cryotubes Market Value Share Analysis, by End Use, 2022E & 2032F
Figure 60: Russia Cryotubes Market Value Share Analysis, by Tube Type, 2022E & 2032F
Figure 61: Russia Cryotubes Market Value Share Analysis, by Capacity, 2022E
Figure 62: Russia Cryotubes Market Value Share Analysis, by End Use, 2022E & 2032F
Figure 63: China Cryotubes Market Value Share Analysis, by Tube Type, 2022E & 2032F
Figure 64: China Cryotubes Market Value Share Analysis, by Capacity, 2022E
Figure 65: China Cryotubes Market Value Share Analysis, by End Use, 2022E & 2032F
Figure 66: India Cryotubes Market Value Share Analysis, by Tube Type, 2022E & 2032F
Figure 67: India Cryotubes Market Value Share Analysis, by Capacity, 2022E
Figure 68: India Cryotubes Market Value Share Analysis, by End Use, 2022E & 2032F
Figure 69: Japan Cryotubes Market Value Share Analysis, by Tube Type, 2022E & 2032F
Figure 70: Japan Cryotubes Market Value Share Analysis, by Capacity, 2022E
Figure 71: Japan Cryotubes Market Value Share Analysis, by End Use, 2022E & 2032F
Figure 72: GCC Countries Cryotubes Market Value Share Analysis, by Tube Type, 2022E & 2032F
Figure 73: GCC Countries Cryotubes Market Value Share Analysis, by Capacity, 2022E
Figure 74: GCC Countries Cryotubes Market Value Share Analysis, by End Use, 2022E & 2032F
Figure 75: South Africa Cryotubes Market Value Share Analysis, by Tube Type, 2022E & 2032F
Figure 76: South Africa Cryotubes Market Value Share Analysis, by Capacity, 2022E
Figure 77: South Africa Cryotubes Market Value Share Analysis, by End Use, 2022E & 2032F
Copyright © Transparency Market Research, Inc. All Rights reserved
Trust Online

Cryotubes Market