
Reports
Reports
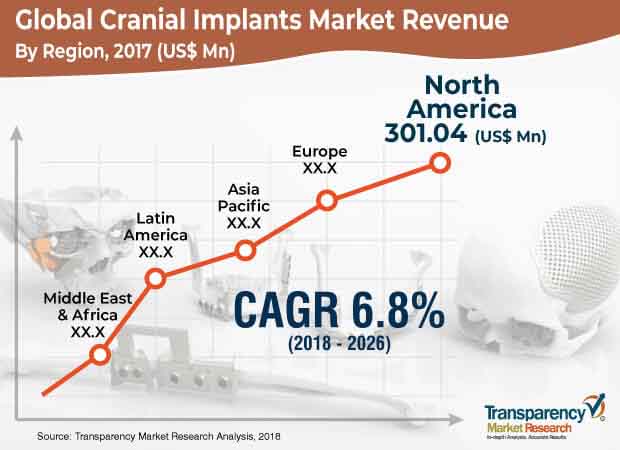
The global cranial implants market is expanding due to an increase in the number of brain cancer and trauma cases and rapid technological advancements for establishing effective and efficient treatment platforms for cranial reconstruction. The global cranial implants market was valued at more than US$ 792.0 Mn in 2017. It is projected to reach a value of US$ 1.4 Bn by 2026, expanding at a CAGR of more than 6.5% from 2018 to 2026. The global market is expanding at a relatively higher growth rate due to an increase in the geriatric population, rise in the prevalence of cancer and trauma cases, increase in the number of cranial surgeries, research and developmental activities in the health care sector in both developed and developing countries
The human head can be subjected to several impactful loadings, such as those taking place due to falls, injuries, road accidents, etc.. These loadings may result in skull fracture, and in some cases, part of the skull may need to be replaced by a biomedical implant. Accidents may also lead to brain swelling, which can be treated by decompressive craniectomy.
Cranioplasty is a neurosurgical procedure that is used to repair cranial defects resulting due to traumatic brain injury (TBI), brain tumors, and hemorrhagic diseases. This procedure is conducted with the aid of cranial implants. Earlier, several different types of materials were used for cranioplasty. With technological advancements, new materials and technological interventions are available, providing specificity for the patient population according to the treatment and surgeon.
Increase in technological advancements, such as implant computer-aided design, 3-D printing, and regenerative medicine has resulted in the advent of 3-D-print patient-specific implants that can be made from a variety of materials, including polymer, ceramic, or metal. They are more effective and accurate for treatment and help surgeons achieve increased success rates. Also, factors such as a rise in the geriatric population, increase in demand for customized cranial implants, and rise in the number of injuries and road accidents are boosting the growth of the cranial implants market. Furthermore, an increase in research and development activities and studies and rise in awareness are also anticipated to boost the cranial implants market.
The global cranial implants market has been segmented based on product, material, end-user, and region. In terms of product, the market has been classified into customized cranial implants and non-customized cranial implants. The non-customized cranial implants segment is expected to hold a significant share of the market, while the customized cranial implants segment is expected to expand at a significant CAGR of 7.1% during the forecast period. Customized cranial implants are considered to be specific and well-fitted according to the cranial defects, save operating room procedure time and aid surgeons, may render the procedure less invasive, and reduce the risk of infection and complications. Generally, non-customized implants comprise traditional methods for cranial implantation. The number of non-customized implant products available in the market is higher.
In terms of material, the global cranial implants market has been classified into polymer, ceramic, and metal. The metal segment is projected to hold a prominent share of the market, while the polymer segment is anticipated to expand at a significant CAGR during the forecast period. The metal segment is estimated to expand at a CAGR of 6.8% during the forecast period. The most commonly used metal is grade 5 surgical titanium (i.e., Ti-6Al-4V), usually referred to as ‘titanium’ or Ti-6-4. Metal is used in the cranium for fixation devices (e.g., plates and screws), solid plates, or mesh, or in combination with other materials such as ceramic components or inert plastic. The availability and long-term success rates of metals such as titanium, specifically related to resistance to infections, have contributed to their leading position in the cranial implants market.
In terms of end-user, the global cranial implants market has been classified into hospitals and neurosurgery specialty centers. The hospitals segment is expected to dominate the market and expand at a CAGR of 6.9% during the forecast period. This is due to a rise in the number of hospitals, high surgery volume, and rise in the number of medical professionals.
Based on region, the global cranial implants market has been segmented into North America, Europe, Asia Pacific, Latin America, and Middle East & Africa. North America is expected to dominate the global market and account for a prominent share in the coming years. The market in North America is primarily driven by a rapid increase in the geriatric population; rise in the patient population; high prevalence of trauma, injuries, road accidents, and brain cancer cases; and increase in the acceptance of technologically advanced cranial implants. Moreover, increase in awareness among people, rise in the number of players and products, and substantial focus on research and development are anticipated to fuel the global cranial implants market in North America during the forecast period. According to The American Association for the Surgery of Trauma (AAST), in the U.S., traumatic brain Injury (TBI) is the single largest cause of death from injury. The market in Asia Pacific is anticipated to expand at a rapid pace during the forecast period. The market in the region is estimated to be augmented by the presence of a large base of geriatric population, government initiatives in the health care field, expansion in research and development activities, and improving health care infrastructure.
Companies such as Zimmer Biomet, Stryker, Kelyniam Global Inc., accounted for a major share of the global market in 2017. Increase in the number of technological advancements, rise in approvals from government bodies, acquisitions and mergers, and research and development are the key factors strengthening the position of these players in the market. In October, 2018, OssDsign AB, a distributor and manufacturer of regenerative implants for facial and cranial reconstruction, received 510(k) clearance by the U.S. FDA for the marketing and sale of its latest product, OSSDSIGN Cranioplug. Its implant is used during neurosurgical procedures, and it is made from an osteoconductive calcium phosphate ceramic composition reinforced with a titanium mesh plate. In October 2018, Kelyniam Global Inc., , submitted its third 510(k) application to the FDA for expanding its line of custom implants. Companies are adopting the strategies of acquisitions and collaborations with parallel companies in order to improve and strengthen their presence in the global market.
1. Preface
1.1. Market Definition and Scope
1.2. Market Segmentation
1.3. Key Research Objectives
1.4. Research Highlights
2. Assumptions and Research Methodology
3. Executive Summary : Global Cranial Implants Market
4. Market Overview
4.1. Market Dynamics
4.1.1. Drivers
4.1.2. Restraints
4.1.3. Opportunities
5. Market Outlook
5.1. Prevalence of Brain Tumors in Key Countries
5.2. Comparative Analysis of Cranial Implants Based on Material
5.3. Regulatory Scenario of Cranial Implants
6. Global Cranial Implants Market Analysis and Forecasts, by Product
6.1. Introduction & Definition
6.2. Key Findings/Developments
6.3. Market Value Forecast, by Product, 2016–2026
6.3.1. Customized Cranial Implants
6.3.2. Non-customized Cranial Implants
6.4. Market Attractiveness, by Product
7. Global Cranial Implants Market Analysis and Forecasts, by Material
7.1. Introduction & Definition
7.2. Key Findings/Developments
7.3. Market Value Forecast, by Material, 2016–2026
7.3.1. Polymer
7.3.2. Ceramic
7.3.3. Metal
7.4. Market Attractiveness, by Material
8. Global Cranial Implants Market Analysis and Forecasts, by End-user
8.1. Introduction & Definition
8.2. Key Findings/Developments
8.3. Market Value Forecast, by End-user, 2016–2026
8.3.1. Hospitals
8.3.2. Neurosurgery Specialty Centers
8.4. Market Attractiveness, by End-user
9. Global Cranial Implants Market Analysis and Forecasts, by Region
9.1. Key Findings
9.2. Market Value Forecast, by Region
9.2.1. North America
9.2.2. Europe
9.2.3. Asia Pacific
9.2.4. Latin America
9.2.5. Middle East & Africa
9.3. Market Attractiveness, by Country/Region
10. North America Cranial Implants Market Analysis and Forecast
10.1. Introduction
10.1.1. Key Findings
10.2. Market Value Forecast, by Product, 2016–2026
10.2.1. Customized Cranial Implants
10.2.2. Non-customized Cranial Implants
10.3. Market Value Forecast, by Material, 2016–2026
10.3.1. Polymer
10.3.2. Ceramic
10.3.3. Metal
10.4. Market Value Forecast, by End-user, 2016–2026
10.4.1. Hospitals
10.4.2. Neurosurgery Specialty Centers
10.5. Market Value Forecast, by Country, 2016–2026
10.5.1. U.S.
10.5.2. Canada
10.6. Market Attractiveness Analysis
10.6.1. By Product
10.6.2. By Material
10.6.3. By End-user
10.6.4. By Country
11. Europe Cranial Implants Market Analysis and Forecast
11.1. Introduction
11.1.1. Key Findings
11.2. Market Value Forecast, by Product, 2016–2026
11.2.1. Customized Cranial Implants
11.2.2. Non-customized Cranial Implants
11.3. Market Value Forecast, by Material, 2016–2026
11.3.1. Polymer
11.3.2. Ceramic
11.3.3. Metal
11.4. Market Value Forecast, by End-user, 2016–2026
11.4.1. Hospitals
11.4.2. Neurosurgery Specialty Centers
11.5. Market Value Forecast, by Country, 2016–2026
11.5.1. Germany
11.5.2. U.K.
11.5.3. France
11.5.4. Spain
11.5.5. Italy
11.5.6. Russia
11.5.7. Rest of Europe
11.6. Market Attractiveness Analysis
11.6.1. By Product
11.6.2. By Material
11.6.3. By End-user
11.6.4. By Country
12. Asia Pacific Cranial Implants Market Analysis and Forecast
12.1. I ntroduction
12.1.1. Key Findings
12.2. Market Value Forecast, by Product, 2016–2026
12.2.1. Customized Cranial Implants
12.2.2. Non-customized Cranial Implants
12.3. Market Value Forecast, by Material, 2016–2026
12.3.1. Polymer
12.3.2. Ceramic
12.3.3. Metal
12.4. Market Value Forecast, by End-user, 2016–2026
12.4.1. Hospitals
12.4.2. Neurosurgery Specialty Centers
12.5. Market Value Forecast, by Country, 2016–2026
12.5.1. China
12.5.2. Japan
12.5.3. India
12.5.4. Australia & New Zealand
12.5.5. Rest of Asia Pacific
12.6. Market Attractiveness Analysis
12.6.1. By Product
12.6.2. By Material
12.6.3. By End-user
12.6.4. By Country
13. Latin America Cranial Implants Market Analysis and Forecast
13.1. Introduction
13.1.1. Key Findings
13.2. Market Value Forecast, by Product, 2016–2026
13.2.1. Customized Cranial Implants
13.2.2. Non-customized Cranial Implants
13.3. Market Value Forecast, by Material, 2016–2026
13.3.1. Polymer
13.3.2. Ceramic
13.3.3. Metal
13.4. Market Value Forecast, by End-user, 2016–2026
13.4.1. Hospitals
13.4.2. Neurosurgery Specialty Centers
13.5. Market Value Forecast, by Country, 2016–2026
13.5.1. Brazil
13.5.2. Mexico
13.5.3. Rest of Latin America
13.6. Market Attractiveness Analysis
13.6.1. By Product
13.6.2. By Material
13.6.3. By End-user
13.6.4. By Country
14. Middle East & Africa Cranial Implants Market Analysis and Forecast
14.1.Introduction
14.1.1. Key Findings
14.2. Market Value Forecast, by Product, 2016–2026
14.2.1. Customized Cranial Implants
14.2.2. Non-customized Cranial Implants
14.3. Market Value Forecast, by Material, 2016–2026
14.3.1. Polymer
14.3.2. Ceramic
14.3.3. Metal
14.4. Market Value Forecast, by End-user, 2016–2026
14.4.1. Hospitals
14.4.2. Neurosurgery Specialty Centers
14.5. Market Value Forecast, by Country, 2016–2026
14.5.1. GCC Countries
14.5.2. South Africa
14.5.3. Israel
14.5.4. Rest of Middle East & Africa
14.6. Market Attractiveness Analysis
14.6.1. By Product
14.6.2. By Material
14.6.3. By End-user
14.6.4. By Country
15. Competition Landscape
15.1. Market Player – Competition Matrix (By Tier and Size of companies)
15.2. Market Share Analysis by Company (2017)
15.3. Company Profiles
15.3.1. Zimmer Biomet
15.3.2. Stryker
15.3.3. Kelyniam Global Inc
15.3.4. Medartis
15.3.5. B. Braun Melsungen AG
15.3.6. DePuy Synthes
15.3.7. KLS Martin Group
15.3.8. Xilloc Medical B.V.
15.3.9. Ortho Baltic
15.3.10. Medtronic
List of Figures
Figure 01 Global Cranial Implants Market Size (US$ Mn) and Distribution (%), by Geography, 2018 and 2026
Figure 02 Global Cranial Implants Market Value (US$ Mn) Forecast, 2016–2026
Figure 03 Global Cranial Implants Market Value Share, by Product (2017)
Figure 04 Global Cranial Implants Market Value Share, by Material (2017)
Figure 05 Global Cranial Implants Market Value Share, by End-user (2017)
Figure 06 Global Cranial Implants Market Value Share (%), by Product, 2018 and 2026
Figure 07 Global Cranial Implants Market Attractiveness, by Product, 2018–2026
Figure 08 Global Cranial Implants Market Value (US$ Mn) Forecast and Y-o-Y Growth (%) Projection, by Customized Cranial Implants, 2016–2026
Figure 09 Global Cranial Implants Market Value (US$ Mn) Forecast and Y-o-Y Growth (%) Projection, by Non-customized Cranial Implants, 2016–2026
Figure 10 Global Cranial Implants Market Value Share, by Material, 2018 and 2026
Figure 11 Global Cranial Implants Market Attractiveness, by Material, 2018–2026
Figure 12 Global Cranial Implants Market Revenue (US$ Mn) and Y-o-Y Growth Projection (%), by Polymer, 2016–2026
Figure 13 Global Cranial Implants Market Revenue (US$ Mn) and Y-o-Y Growth Projection (%), by Ceramic, 2016–2026
Figure 14 Global Cranial Implants Market Revenue (US$ Mn) and Y-o-Y Growth Projection (%), by Metal, 2016–2026
Figure 15 Global Cranial Implants Market Value Share, by End-user, 2018 and 2026
Figure 16 Global Cranial Implants Market Attractiveness, by End-user, 2018–2026
Figure 17 Global Cranial Implants Market Revenue (US$ Mn) and Y-o-Y Growth Projection (%), by Hospitals, 2016–2026
Figure 18 Global Cranial Implants Market Revenue (US$ Mn) and Y-o-Y Growth Projection (%), by Neurosurgery Specialty Centers, 2016–2026
Figure 19 Global Cranial Implants Market Value Share, by Region, 2018 and 2026
Figure 20 Global Cranial Implants Market Attractiveness, by Region, 2018–2026
Figure 21 North America Cranial Implants Market Value (US$ Mn) Forecast and Y-o-Y Growth Projection (%), 2016–2026
Figure 22 North America Cranial Implants Market Value Share (%), by Country, 2018 and 2026
Figure 23 North America Cranial Implants Market Attractiveness, by Country, 2018–2026
Figure 24 North America Cranial implants Market Value Share, by Product, 2018 and 2026
Figure 25 North America Cranial Implants Market Attractiveness, by Product, 2018–2026
Figure 26 North America Cranial Implants Market Value Share Analysis, by Material, 2018 and 2026
Figure 27 North America Cranial Implants Market Attractiveness, by Material, 2018–2026
Figure 28 North America Cranial Implants Market Value Share Analysis, by End-user, 2018 and 2026
Figure 29 North America Cranial Implants Market Attractiveness, by End-user, 2018–2026
Figure 30 Europe Cranial Implants Market Value (US$ Mn) Forecast and Y-o-Y Growth Projection (%), 2016–2026
Figure 31 Europe Cranial Implants Market Value Share (%), by Country, 2018 and 2026
Figure 32 Europe Cranial Implants Market Attractiveness, by Country, 2018–2026
Figure 33 Europe Cranial implants Market Value Share, by Product, 2018 and 2026
Figure 34 Europe Cranial Implants Market Attractiveness, by Product, 2018–2026
Figure 35 Europe Cranial Implants Market Value Share Analysis, by Material, 2018 and 2026
Figure 36 Europe Cranial Implants Market Attractiveness, by Material, 2018–2026
Figure 37 Europe Cranial Implants Market Value Share Analysis, by End-user, 2018 and 2026
Figure 38 Europe Cranial Implants Market Attractiveness, by End-user, 2018–2026
Figure 39 Asia Pacific Cranial Implants Market Value (US$ Mn) Forecast and Y-o-Y Growth Projection (%), 2016–2026
Figure 40 Asia Pacific Cranial implants Market Value Share, by Country, 2018 and 2026
Figure 41 Asia Pacific Cranial Implants Market Attractiveness, by Country, 2018–2026
Figure 42 Asia Pacific Cranial implants Market Value Share, by Product, 2018 and 2026
Figure 43 Asia Pacific Cranial Implants Market Attractiveness, by Product, 2018–2026
Figure 44 Asia Pacific Cranial Implants Market Value Share Analysis, by Material, 2018 and 2026
Figure 45 Asia Pacific Cranial Implants Market Attractiveness, by Material, 2018–2026
Figure 46 Asia Pacific Cranial Implants Market Value Share Analysis, by End-user, 2018 and 2026
Figure 47 Asia Pacific Cranial Implants Market Attractiveness, by End-user, 2018–2026
Figure 48 Latin America Cranial Implants Market Value (US$ Mn) Forecast and Y-o-Y Growth Projection (%), 2016–2026
Figure 49 Latin America Cranial implants Market Value Share, by Country, 2018 and 2026
Figure 50 Latin America Cranial Implants Market Attractiveness, by Country, 2018–2026
Figure 51 Latin America Cranial implants Market Value Share, by Product, 2018 and 2026
Figure 52 Latin America Cranial Implants Market Attractiveness, by Product, 2018–2026
Figure 53 Latin America Cranial Implants Market Value Share Analysis, by Material, 2018 and 2026
Figure 54 Latin America Cranial Implants Market Attractiveness, by Material, 2018–2026
Figure 55 Latin America Cranial Implants Market Value Share Analysis, by End-user, 2018 and 2026
Figure 56 Latin America Cranial Implants Market Attractiveness, by End-user, 2018–2026
Figure 57 Middle East & Africa Cranial Implants Market Value (US$ Mn) Forecast and Y-o-Y Growth Projection (%), 2016–2026
Figure 58 Middle East & Africa Cranial implants Market Value Share, by Country, 2018 and 2026
Figure 59 Middle East & Africa Cranial Implants Market Attractiveness, by Country, 2018–2026
Figure 60 Middle East & Africa Cranial implants Market Value Share, by Product, 2018 and 2026
Figure 61 Middle East & Africa Cranial Implants Market Attractiveness, by Product, 2018–2026
Figure 62 Middle East & Africa Cranial Implants Market Value Share Analysis, by Material, 2018 and 2026
Figure 63 Middle East & Africa Cranial Implants Market Attractiveness, by Material, 2018–2026
Figure 64 Middle East & Africa Cranial Implants Market Value Share Analysis, by End-user, 2018 and 2026
Figure 65 Middle East & Africa Cranial Implants Market Attractiveness, by End-user, 2018–2026
Figure 66 Cranial Implants Market Share, by Company, 2017
Figure 67 Zimmer Biomet Revenue (US$ Mn) and Y-o-Y Growth (%), 2014–2017
Figure 68 Zimmer Biomet Breakdown of Net Sales (%), by Region/Country, 2017
Figure 69 Zimmer Biomet Breakdown of Net Sales (%), by Product Segment, 2017
Figure 70 Zimmer Biomet R&D Expenses (US$ Mn) and Y-o-Y Growth (%), 2014–2017
Figure 71 Stryker Revenue (US$ Mn) and Y-o-Y Growth (%), 2014–2017
Figure 72 Stryker Breakdown of Net Sales (%), by Region/Country, 2017
Figure 73 Stryker Breakdown of Net Sales (%), by Product Segment, 2017
Figure 74 Stryker R&D Expenses (US$ Mn) and Y-o-Y Growth (%), 2014–2017
Figure 75 KELYNIAM GLOBAL INC. Revenue (US$ Mn) and Y-o-Y Growth (%), 2014–2017
Figure 76 Medtronic Revenue (US$ Mn) and Y-o-Y Growth (%), 2014–2017
Figure 77 Medtronic Breakdown of Net Sales (%), by Region/Country, 2017
Figure 78 Medtronic Breakdown of Net Sales (%), by Business Segment, 2017
Figure 79 Medtronic R&D Expenses (US$ Mn) and Y-o-Y Growth (%), 2014–2017
Figure 80 Revenue (US$ Mn) and Y-o-Y Growth (%), 2014–2017
Figure 81 Breakdown of Net Sales (%), by Region, 2017
Figure 82 Johnson & Johnson Revenue (US$ Mn) and Y-o-Y Growth (%), 2014–2017
Figure 83 Johnson & Johnson Breakdown of Net Sales (%), by Region/Country, 2017
Figure 84 Johnson & Johnson Breakdown of Net Sales (%), by Business Segment, 2017
Figure 85 Johnson & Johnson R&D Expenses (US$ Mn) and Y-o-Y Growth (%), 2014–2017
Copyright © Transparency Market Research, Inc. All Rights reserved
Trust Online

Cranial Implants Market Trends, 2018-2026