
Reports
Reports
Analysts’ Viewpoint on Crack Proof Paint Market Scenario
Manufacturers operating in the crack proof paint market are focusing on residential and commercial industries, owing to a surge in the demand for superior wall and roof finishes without cracks and dampness, especially for exterior applications. Crack proof paints aid in the retention of the paint's structure even when the coated material (typically wood) expands or contracts in response to temperature changes or when subjected to abrasive conditions. Surge in investment in the building and construction industry due to various government-sponsored public housing programs is expected to boost the demand for crack proof paint. Moreover, crack proof paint companies are investing in the development of product quality to consolidate their position in the market. Resistance to extreme weather conditions along with the environment-friendliness of crack proof paint is estimated to propel the crack proof paint market during the forecast period.
Crack proof paint, or roof crack proof paint, helps protect home exteriors from algae and fungus, dirt, and dust, as compared to regular exterior paint. Acrylic paint is a common water-based paint that can be used for both interior and exterior walls. It is the most popular paint among construction painters. Crack proof paints are widely used in residential construction to reduce shrinkage and cracks in concrete, while also improving its esthetic quality and workability. Economic growth and higher incomes in the last few years have resulted in the construction of several new houses and the remodeling of older ones. Wall crack proof paint, or crack proof exterior paint, can be utilized for fill cracks in interior and exterior absorbent surfaces as well as to fill cracks and gaps caused by drying and shrinkage. Crack proof paint is more commonly employed on exterior rather than interior absorbent surfaces. Technological advancements in paints & coating technology coupled with the developments to increase the performance of paints are expected to drive the demand for crack proof paints. The global crack proof paint market value is estimated to increase at a significant pace during the forecast period, owing to the favorable properties of crack proof paint, specifically for various industries such as residential, commercial, and industrial. Top key players in crack proof paints market are developing innovative solutions to gain revenue benefits.
Investment in the building & construction industry has been rising due to the implementation of various government-backed welfare housing schemes. Rapid urbanization and changing lifestyles are expected to drive the global building & construction industry in the next few years. Growing population and improving economic conditions have increased expenditure on housing and infrastructure development activities across the globe. Low-interest rates in housing have also led to investments in the building & construction industry. Uses of crack proof paints are increasing in the construction industry. This is estimated to propel the crack proof paint market during the forecast period.
Crack proof paint provides all-weather protection for home interiors and exteriors, as it stretches more to cover larger hairline cracks and prevents dampness, not only on the exteriors but also on the interiors of homes. Crack proof paint possess various properties, including crack filling ability, flexibility, mechanical strength, waterproofing, and adhesion. It has a high elongation film that enables movement and is reinforced with glass fibers for superior mechanical properties. Crack proof paint has waterproofing properties, which means it prevents water ingress through cracks. It also adheres strongly to all absorbent surfaces such as plaster, wood, gypsum, Plaster of Paris (POP), and asbestos.
In terms of resin, the global crack proof paint market has been divided into polyurethanes, acrylic, epoxy, nitrocellulosic, alkyd, and others. The acrylic segment dominated the global crack proof paint market and held more than 35% share in 2021. Acrylic paints consist of pigments suspended in acrylic polymer suspension. Acrylic paints are water-based and consist of three major components: pigments, acrylic binder and water, and other additives such as buffers, initiators, surfactants, defoamers, preservatives, thickeners, and stabilizers. Acrylic paints are easy to use and form vibrant colors. Acrylic paints can also be used on various surfaces as they form various textures and consistencies. Acrylic paint is a popular paint in the construction industry, as it is suitable for interior and exterior painting.
In terms of technology, the global crack proof paint market has been classified into water-based and solvent-based. The water-based segment dominated the global crack proof paint market and held more than 60% share in 2021. Water-based paints contain low levels of volatile organic compounds. Therefore, demand for water-based paints has been increasing across the globe. Apart from low VOC content, water-based paints dry quickly. They have excellent adhesion qualities and do not need additive hardeners and thinners. Therefore, they are largely used in interior and exterior wall paints. The segment is estimated to expand at a notable CAGR of 6.0% during the forecast period.
In terms of volume, Asia Pacific leads the global crack proof paint market, owing to a rise in investment in the building & construction industry, which can be attributed to an increase in industrialization and urbanization in expanding economies such as China and India. Furthermore, increase in activities such as rebuilding, refurbishing, and renovating old buildings has augmented investments in the building & construction industry, thereby fuelling the demand for crack proof paint in the region. Asia Pacific accounted for more than 45% share of the global crack proof paint market in 2021.
In terms of volume, North America and Europe are also major markets for crack proof paint. These regions accounted for 19.1% and 23.1% value share, respectively, of the global market in 2021. Latin America is a larger market for crack proof paint than Middle East & Africa; however, the market in Middle East & Africa is likely to advance at a higher growth rate during the forecast period.
The global crack proof paint market is highly consolidated, with a small number of large-scale vendors controlling majority of the share. Most companies are investing considerably in comprehensive research and development activities, primarily to create environment-friendly products. Expansion of product portfolios and mergers and acquisitions are key strategies adopted by prominent players. Akzo Nobel N.V., PPG Industries, Inc., Asian Paints Limited, The Valspar Corporation, and Berger Paints India Limited are the key entities operating in the market.
In August 2021, PPG introduced PPG ENVIROCRON PCS P4 powder coatings for architectural, home décor, and furniture applications. This latest generation of powder coatings meets the increased demand for matte and premium-textured surfaces in applications ranging from aluminum and steel substrates for building construction to urban and office furniture.
In June 2021, Akzo Nobel N.V. acquired paints and coatings maker Grupo Orbis. This strategic acquisition will allow Akzo Nobel N.V. l to develop its position in South and Central America.
Each of these players has been profiled in global crack proof paint market report based on parameters such as company overview, financial overview, business strategies, product portfolio, business segments, and recent developments.
|
Attribute |
Detail |
|
Market Size Value in 2021 |
US$ 110.4 Bn |
|
Market Forecast Value in 2031 |
US$ 195.0 Bn |
|
Growth Rate (CAGR) |
5.5% |
|
Forecast Period |
2022–2031 |
|
Historical Data Available for |
2020 |
|
Quantitative Units |
US$ Bn for Value and Kilo Tons for Volume |
|
Market Analysis |
It includes cross-segment analysis at the global as well as regional level. Furthermore, the qualitative analysis includes drivers, restraints, opportunities, key trends, Porter’s Five Forces analysis, value chain analysis, and key trend analysis. |
|
Competition Landscape |
|
|
Format |
Electronic (PDF) + Excel |
|
Market Segmentation |
|
|
Regions Covered |
|
|
Countries Covered |
|
|
Companies Profiled |
|
|
Customization Scope |
Available upon request |
|
Pricing |
Available upon request |
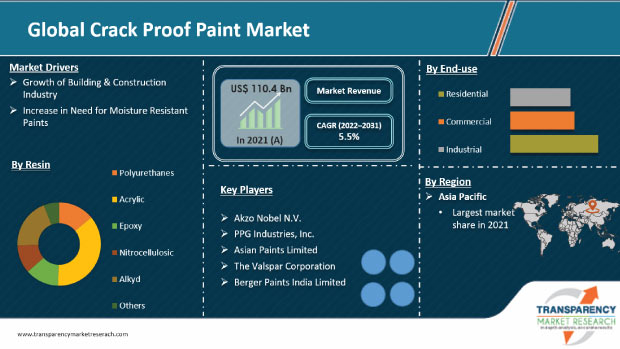
The crack proof paint market stood at US$ 110.4 Bn in 2021
The crack proof paint market is expected to grow at a CAGR of 5.5% from 2022 to 2031
Expansion of building & construction industry and increase in need for moisture resistant paints
Acrylic was the largest resin segment that held more than 35% value share in 2021
Asia Pacific was the most lucrative region and held more than 45% share of the global crack proof paint market in 2021
Akzo Nobel N.V., PPG Industries, Inc., Asian Paints Limited, The Valspar Corporation, and Berger Paints India Limited.
1. Executive Summary
1.1. Crack Proof Paint Market Snapshot
1.2. Current Market and Future Potential
2. Market Overview
2.1. Market Segmentation
2.2. Market Trends
2.3. Market Dynamics
2.3.1. Drivers
2.3.2. Restraints
2.3.3. Opportunities
2.4. Porter’s Five Forces Analysis
2.5. Regulatory Analysis
2.6. Value Chain Analysis
2.6.1. List of Crack Proof Paint Manufacturers
2.6.2. List of Potential Customer
3. COVID-19 Impact Analysis
4. Global Crack Proof Paint Market Analysis and Forecast, by Resin, 2022–2031
4.1. Introduction and Definitions
4.2. Global Crack Proof Paint Market Volume (Kilo Tons) and Value (US$ Bn) Forecast, by Resin, 2022–2031
4.2.1. Polyurethanes
4.2.2. Acrylic
4.2.3. Epoxy
4.2.4. Nitrocellulosic
4.2.5. Alkyd
4.2.6. Others
4.3. Global Crack Proof Paint Market Attractiveness, by Resin
5. Global Crack Proof Paint Market Analysis and Forecast, by Technology, 2022–2031
5.1. Introduction and Definitions
5.2. Global Crack Proof Paint Market Volume (Kilo Tons) and Value (US$ Bn) Forecast, by Technology, 2022–2031
5.2.1. Water-based
5.2.2. Solvent-based
5.3. Global Crack Proof Paint Market Attractiveness, by Technology
6. Global Crack Proof Paint Market Analysis and Forecast, End-use, 2022–2031
6.1. Introduction and Definitions
6.2. Global Crack Proof Paint Market Volume (Kilo Tons) and Value (US$ Bn) Forecast, by End-use, 2022–2031
6.2.1. Residential
6.2.1.1. Interior
6.2.1.2. Exterior
6.2.2. Commercial
6.2.2.1. Interior
6.2.2.2. Exterior
6.2.3. Industrial
6.2.3.1. Interior
6.2.3.2. Exterior
6.3. Global Crack Proof Paint Market Attractiveness, by End-use
7. Global Crack Proof Paint Market Analysis and Forecast, by Region, 2022–2031
7.1. Key Findings
7.2. Global Crack Proof Paint Market Volume (Kilo Tons) and Value (US$ Bn) Forecast, by Region, 2022–2031
7.2.1. North America
7.2.2. Europe
7.2.3. Asia Pacific
7.2.4. Latin America
7.2.5. Middle East & Africa
7.3. Global Crack Proof Paint Market Attractiveness, by Region
8. North America Crack Proof Paint Market Analysis and Forecast, 2022–2031
8.1. Key Findings
8.2. North America Crack Proof Paint Market Volume (Kilo Tons) and Value (US$ Bn) Forecast, by Resin, 2022–2031
8.3. North America Crack Proof Paint Market Volume (Kilo Tons) and Value (US$ Bn) Forecast, by Technology, 2022–2031
8.4. North America Crack Proof Paint Market Volume (Kilo Tons) and Value (US$ Bn) Forecast, by End-use, 2022–2031
8.5. North America Crack Proof Paint Market Volume (Kilo Tons) and Value (US$ Bn) Forecast, by Country, 2022–2031
8.5.1. U.S. Crack Proof Paint Market Volume (Kilo Tons) and Value (US$ Bn) Forecast, by Resin, 2022–2031
8.5.2. U.S. Crack Proof Paint Market Volume (Kilo Tons) and Value (US$ Bn) Forecast, by Technology, 2022–2031
8.5.3. U.S. Crack Proof Paint Market Volume (Kilo Tons) and Value (US$ Bn) Forecast, by End-use, 2022–2031
8.5.4. Canada Crack Proof Paint Market Volume (Kilo Tons) and Value (US$ Bn) Forecast, by Resin, 2022–2031
8.5.5. Canada Crack Proof Paint Market Volume (Kilo Tons) and Value (US$ Bn) Forecast, by Technology, 2022–2031
8.5.6. Canada Crack Proof Paint Market Volume (Kilo Tons) and Value (US$ Bn) Forecast, by End-use, 2022–2031
8.6. North America Crack Proof Paint Market Attractiveness Analysis
9. Europe Crack Proof Paint Market Analysis and Forecast, 2022–2031
9.1. Key Findings
9.2. Europe Crack Proof Paint Market Volume (Kilo Tons) and Value (US$ Bn) Forecast, by Resin, 2022–2031
9.3. Europe Crack Proof Paint Market Volume (Kilo Tons) and Value (US$ Bn) Forecast, by Technology, 2022–2031
9.4. Europe Crack Proof Paint Market Volume (Kilo Tons) and Value (US$ Bn) Forecast, by End-use, 2022–2031
9.5. Europe Crack Proof Paint Market Volume (Kilo Tons) and Value (US$ Bn) Forecast, by Country and Sub-region, 2022-2031
9.5.1. Germany Crack Proof Paint Market Volume (Kilo Tons) and Value (US$ Bn) Forecast, by Resin, 2022–2031
9.5.2. Germany Crack Proof Paint Market Volume (Kilo Tons) and Value (US$ Bn) Forecast, by Technology, 2022–2031
9.5.3. Germany Crack Proof Paint Market Volume (Kilo Tons) and Value (US$ Bn) Forecast, by End-use, 2022–2031
9.5.4. France Crack Proof Paint Market Volume (Kilo Tons) and Value (US$ Bn) Forecast, by Resin, 2022–2031
9.5.5. France Crack Proof Paint Market Volume (Kilo Tons) and Value (US$ Bn) Forecast, by Technology, 2022–2031
9.5.6. France Crack Proof Paint Market Volume (Kilo Tons) and Value (US$ Bn) Forecast, by End-use, 2022–2031
9.5.7. U.K. Crack Proof Paint Market Volume (Kilo Tons) and Value (US$ Bn) Forecast, by Resin, 2022–2031
9.5.8. U.K. Crack Proof Paint Market Volume (Kilo Tons) and Value (US$ Bn) Forecast, by Technology, 2022–2031
9.5.9. U.K. Crack Proof Paint Market Volume (Kilo Tons) and Value (US$ Bn) Forecast, by End-use, 2022–2031
9.5.10. Italy Crack Proof Paint Market Volume (Kilo Tons) and Value (US$ Bn) Forecast, by Resin, 2022–2031
9.5.11. Italy. Crack Proof Paint Market Volume (Kilo Tons) and Value (US$ Bn) Forecast, by Technology, 2022–2031
9.5.12. Italy Crack Proof Paint Market Volume (Kilo Tons) and Value (US$ Bn) Forecast, by End-use, 2022–2031
9.5.13. Russia & CIS Crack Proof Paint Market Volume (Kilo Tons) and Value (US$ Bn) Forecast, by Resin, 2022–2031
9.5.14. Russia & CIS Crack Proof Paint Market Volume (Kilo Tons) and Value (US$ Bn) Forecast, by Technology, 2022–2031
9.5.15. Russia & CIS Crack Proof Paint Market Volume (Kilo Tons) and Value (US$ Bn) Forecast, by End-use, 2022–2031
9.5.16. Rest of Europe Crack Proof Paint Market Volume (Kilo Tons) and Value (US$ Bn) Forecast, by Resin, 2022–2031
9.5.17. Rest of Europe Crack Proof Paint Market Volume (Kilo Tons) and Value (US$ Bn) Forecast, by Technology, 2022–2031
9.5.18. Rest of Europe Crack Proof Paint Market Volume (Kilo Tons) and Value (US$ Bn) Forecast, by End-use, 2022–2031
9.6. Europe Crack Proof Paint Market Attractiveness Analysis
10. Asia Pacific Crack Proof Paint Market Analysis and Forecast, 2022–2031
10.1. Key Findings
10.2. Asia Pacific Crack Proof Paint Market Volume (Kilo Tons) and Value (US$ Bn) Forecast, by Resin
10.3. Asia Pacific Crack Proof Paint Market Volume (Kilo Tons) and Value (US$ Bn) Forecast, by Technology, 2022–2031
10.4. Asia Pacific Crack Proof Paint Market Volume (Kilo Tons) and Value (US$ Bn) Forecast, by End-use, 2022–2031
10.5. Asia Pacific Crack Proof Paint Market Volume (Kilo Tons) and Value (US$ Bn) Forecast, by Country and Sub-region, 2022-2031
10.5.1. China Crack Proof Paint Market Volume (Kilo Tons) and Value (US$ Bn) Forecast, by Resin, 2022–2031
10.5.2. China Crack Proof Paint Market Volume (Kilo Tons) and Value (US$ Bn) Forecast, by Technology, 2022–2031
10.5.3. China Crack Proof Paint Market Volume (Kilo Tons) and Value (US$ Bn) Forecast, by End-use, 2022–2031
10.5.4. Japan Crack Proof Paint Market Volume (Kilo Tons) and Value (US$ Bn) Forecast, by Resin, 2022–2031
10.5.5. Japan Crack Proof Paint Market Volume (Kilo Tons) and Value (US$ Bn) Forecast, by Technology, 2022–2031
10.5.6. Japan Crack Proof Paint Market Volume (Kilo Tons) and Value (US$ Bn) Forecast, by End-use, 2022–2031
10.5.7. India Crack Proof Paint Market Volume (Kilo Tons) and Value (US$ Bn) Forecast, by Resin, 2022–2031
10.5.8. India Crack Proof Paint Market Volume (Kilo Tons) and Value (US$ Bn) Forecast, by Technology, 2022–2031
10.5.9. India Crack Proof Paint Market Volume (Kilo Tons) and Value (US$ Bn) Forecast, by End-use, 2022–2031
10.5.10. ASEAN Crack Proof Paint Market Volume (Kilo Tons) and Value (US$ Bn) Forecast, by Resin, 2022–2031
10.5.11. ASEAN Crack Proof Paint Market Volume (Kilo Tons) and Value (US$ Bn) Forecast, by Technology, 2022–2031
10.5.12. ASEAN Crack Proof Paint Market Volume (Kilo Tons) and Value (US$ Bn) Forecast, by End-use, 2022–2031
10.5.13. Rest of Asia Pacific Crack Proof Paint Market Volume (Kilo Tons) and Value (US$ Bn) Forecast, by Resin, 2022–2031
10.5.14. Rest of Asia Pacific Crack Proof Paint Market Volume (Kilo Tons) and Value (US$ Bn) Forecast, by Technology, 2022–2031
10.5.15. Rest of Asia Pacific Crack Proof Paint Market Volume (Kilo Tons) and Value (US$ Bn) Forecast, by End-use, 2022–2031
10.6. Asia Pacific Crack Proof Paint Market Attractiveness Analysis
11. Latin America Crack Proof Paint Market Analysis and Forecast, 2022–2031
11.1. Key Findings
11.2. Latin America Crack Proof Paint Market Volume (Kilo Tons) and Value (US$ Bn) Forecast, by Resin, 2022–2031
11.3. Latin America Crack Proof Paint Market Volume (Kilo Tons) and Value (US$ Bn) Forecast, by Technology, 2022–2031
11.4. Latin America Crack Proof Paint Market Volume (Kilo Tons) and Value (US$ Bn) Forecast, by End-use, 2022–2031
11.5. Latin America Crack Proof Paint Market Volume (Kilo Tons) and Value (US$ Bn) Forecast, by Country and Sub-region, 2022-2031
11.5.1. Brazil Crack Proof Paint Market Volume (Kilo Tons) and Value (US$ Bn) Forecast, by Resin, 2022–2031
11.5.2. Brazil Crack Proof Paint Market Volume (Kilo Tons) and Value (US$ Bn) Forecast, by Technology, 2022–2031
11.5.3. Brazil Crack Proof Paint Market Volume (Kilo Tons) and Value (US$ Bn) Forecast, by End-use, 2022–2031
11.5.4. Mexico Crack Proof Paint Market Volume (Kilo Tons) and Value (US$ Bn) Forecast, by Resin, 2022–2031
11.5.5. Mexico Crack Proof Paint Market Volume (Kilo Tons) and Value (US$ Bn) Forecast, by Technology, 2022–2031
11.5.6. Mexico Crack Proof Paint Market Volume (Kilo Tons) and Value (US$ Bn) Forecast, by End-use, 2022–2031
11.5.7. Rest of Latin America Crack Proof Paint Market Volume (Kilo Tons) and Value (US$ Bn) Forecast, by Resin, 2022–2031
11.5.8. Rest of Latin America Crack Proof Paint Market Volume (Kilo Tons) and Value (US$ Bn) Forecast, by Technology, 2022–2031
11.5.9. Rest of Latin America Crack Proof Paint Market Volume (Kilo Tons) and Value (US$ Bn) Forecast, by End-use, 2022–2031
11.6. Latin America Crack Proof Paint Market Attractiveness Analysis
12. Middle East & Africa Crack Proof Paint Market Analysis and Forecast, 2022–2031
12.1. Key Findings
12.2. Middle East & Africa Crack Proof Paint Market Volume (Kilo Tons) and Value (US$ Bn) Forecast, by Resin, 2022–2031
12.3. Middle East & Africa Crack Proof Paint Market Volume (Kilo Tons) and Value (US$ Bn) Forecast, by Technology, 2022–2031
12.4. Middle East & Africa Crack Proof Paint Market Volume (Kilo Tons) and Value (US$ Bn) Forecast, by End-use, 2022–2031
12.5. Middle East & Africa Crack Proof Paint Market Volume (Kilo Tons) and Value (US$ Bn) Forecast, by Country and Sub-region, 2022-2031
12.5.1. GCC Crack Proof Paint Market Volume (Kilo Tons) and Value (US$ Bn) Forecast, by Resin, 2022–2031
12.5.2. GCC Crack Proof Paint Market Volume (Kilo Tons) and Value (US$ Bn) Forecast, by Technology, 2022–2031
12.5.3. GCC Crack Proof Paint Market Volume (Kilo Tons) and Value (US$ Bn) Forecast, by End-use, 2022–2031
12.5.4. South Africa Crack Proof Paint Market Volume (Kilo Tons) and Value (US$ Bn) Forecast, by Resin, 2022–2031
12.5.5. South Africa Crack Proof Paint Market Volume (Kilo Tons) and Value (US$ Bn) Forecast, by Technology, 2022–2031
12.5.6. South Africa Crack Proof Paint Market Volume (Kilo Tons) and Value (US$ Bn) Forecast, by End-use, 2022–2031
12.5.7. Rest of Middle East & Africa Crack Proof Paint Market Volume (Kilo Tons) and Value (US$ Bn) Forecast, by Resin, 2022–2031
12.5.8. Rest of Middle East & Africa Crack Proof Paint Market Volume (Kilo Tons) and Value (US$ Bn) Forecast, by Technology, 2022–2031
12.5.9. Rest of Middle East & Africa Crack Proof Paint Market Volume (Kilo Tons) and Value (US$ Bn) Forecast, by End-use, 2022–2031
12.6. Middle East & Africa Crack Proof Paint Market Attractiveness Analysis
13. Competition Landscape
13.1. Global Crack Proof Paint Company Market Share Analysis, 2022
13.2. Company Profiles (Details – Overview, Financials, Recent Developments, and Strategy)
13.2.1. Akzo Nobel N.V.
13.2.1.1. Company Description
13.2.1.2. Business Overview
13.2.1.3. Financial Overview
13.2.1.4. Strategic Overview
13.2.2. PPG Industries, Inc.
13.2.2.1. Company Description
13.2.2.2. Business Overview
13.2.2.3. Financial Overview
13.2.2.4. Strategic Overview
13.2.3. Asian Paints Limited
13.2.3.1. Company Description
13.2.3.2. Business Overview
13.2.3.3. Financial Overview
13.2.3.4. Strategic Overview
13.2.4. Polisan Kansai Boya
13.2.4.1. Company Description
13.2.4.2. Business Overview
13.2.4.3. Financial Overview
13.2.4.4. Strategic Overview
13.2.5. The Valspar Corporation
13.2.5.1. Company Description
13.2.5.2. Business Overview
13.2.5.3. Financial Overview
13.2.5.4. Strategic Overview
13.2.6. Berger Paints India Limited
13.2.6.1. Company Description
13.2.6.2. Business Overview
13.2.6.3. Financial Overview
13.2.6.4. Strategic Overview
13.2.7. StarShield Technologies Pvt.Ltd.
13.2.7.1. Company Description
13.2.7.2. Business Overview
13.2.7.3. Financial Overview
13.2.7.4. Strategic Overview
13.2.8. Dunn-Edwards Corporation
13.2.8.1. Company Description
13.2.8.2. Business Overview
13.2.8.3. Financial Overview
13.2.8.4. Strategic Overview
13.2.9. California Paints (ICP Building Solutions Group)
13.2.9.1. Company Description
13.2.9.2. Business Overview
13.2.9.3. Financial Overview
13.2.9.4. Strategic Overview
14. Primary Research: Key Insights
15. Appendix
List of Tables
Table 1: Global Crack Proof Paint Market Volume (Kilo Tons) Forecast, by Resin, 2022–2031
Table 2: Global Crack Proof Paint Market Value (US$ Bn) Forecast, by Resin, 2022–2031
Table 3: Global Crack Proof Paint Market Volume (Kilo Tons) Forecast, by Technology, 2022–2031
Table 4: Global Crack Proof Paint Market Value (US$ Bn) Forecast, by Technology, 2022–2031
Table 5: Global Crack Proof Paint Market Volume (Kilo Tons) Forecast, by End-use, 2022–2031
Table 6: Global Crack Proof Paint Market Value (US$ Bn) Forecast, by End-use, 2022–2031
Table 7: Global Crack Proof Paint Market Volume (Kilo Tons) Forecast, by Region, 2022–2031
Table 8: Global Crack Proof Paint Market Value (US$ Bn) Forecast, by Region, 2022–2031
Table 9: North America Crack Proof Paint Market Volume (Kilo Tons) Forecast, by Resin, 2022–2031
Table 10: North America Crack Proof Paint Market Value (US$ Bn) Forecast, by Resin, 2022–2031
Table 11: North America Crack Proof Paint Market Volume (Kilo Tons) Forecast, by Technology, 2022–2031
Table 12: North America Crack Proof Paint Market Value (US$ Bn) Forecast, by Technology, 2022–2031
Table 13: North America Crack Proof Paint Market Volume (Kilo Tons) Forecast, by End-use, 2022–2031
Table 14: North America Crack Proof Paint Market Value (US$ Bn) Forecast, by End-use, 2022–2031
Table 15: North America Crack Proof Paint Market Volume (Kilo Tons) Forecast, by Country, 2022–2031
Table 16: North America Crack Proof Paint Market Value (US$ Bn) Forecast, by Country, 2022–2031
Table 17: U.S. Crack Proof Paint Market Volume (Kilo Tons) Forecast, by Resin, 2022–2031
Table 18: U.S. Crack Proof Paint Market Value (US$ Bn) Forecast, by Resin, 2022–2031
Table 19: U.S. Crack Proof Paint Market Volume (Kilo Tons) Forecast, by Technology, 2022–2031
Table 20: U.S. Crack Proof Paint Market Value (US$ Bn) Forecast, by Technology, 2022–2031
Table 21: U.S. Crack Proof Paint Market Volume (Kilo Tons) Forecast, by End-use, 2022–2031
Table 22: U.S. Crack Proof Paint Market Value (US$ Bn) Forecast, by End-use, 2022–2031
Table 23: Canada Crack Proof Paint Market Volume (Kilo Tons) Forecast, by Resin, 2022–2031
Table 24: Canada Crack Proof Paint Market Value (US$ Bn) Forecast, by Resin, 2022–2031
Table 25: Canada Crack Proof Paint Market Volume (Kilo Tons) Forecast, by Technology, 2022–2031
Table 26: Canada Crack Proof Paint Market Value (US$ Bn) Forecast, by Technology, 2022–2031
Table 27: Canada Crack Proof Paint Market Volume (Kilo Tons) Forecast, by End-use, 2022–2031
Table 28: Canada Crack Proof Paint Market Value (US$ Bn) Forecast, by End-use, 2022–2031
Table 29: Europe Crack Proof Paint Market Volume (Kilo Tons) Forecast, by Resin, 2022–2031
Table 30: Europe Crack Proof Paint Market Value (US$ Bn) Forecast, by Resin, 2022–2031
Table 31: Europe Crack Proof Paint Market Volume (Kilo Tons) Forecast, by Technology, 2022–2031
Table 32: Europe Crack Proof Paint Market Value (US$ Bn) Forecast, by Technology, 2022–2031
Table 33: Europe Crack Proof Paint Market Volume (Kilo Tons) Forecast, by End-use, 2022–2031
Table 34: Europe Crack Proof Paint Market Value (US$ Bn) Forecast, by End-use, 2022–2031
Table 35: Europe Crack Proof Paint Market Volume (Kilo Tons) Forecast, by Country and Sub-region, 2022–2031
Table 36: Europe Crack Proof Paint Market Value (US$ Bn) Forecast, by Country and Sub-region, 2022–2031
Table 37: Germany Crack Proof Paint Market Volume (Kilo Tons) Forecast, by Resin, 2022–2031
Table 38: Germany Crack Proof Paint Market Value (US$ Bn) Forecast, by Resin, 2022–2031
Table 39: Germany Crack Proof Paint Market Volume (Kilo Tons) Forecast, by Technology, 2022–2031
Table 40: Germany Crack Proof Paint Market Value (US$ Bn) Forecast, by Technology, 2022–2031
Table 41: Germany Crack Proof Paint Market Volume (Kilo Tons) Forecast, by End-use, 2022–2031
Table 42: Germany Crack Proof Paint Market Value (US$ Bn) Forecast, by End-use, 2022–2031
Table 43: France Crack Proof Paint Market Volume (Kilo Tons) Forecast, by Resin, 2022–2031
Table 44: France Crack Proof Paint Market Value (US$ Bn) Forecast, by Resin, 2022–2031
Table 45: France Crack Proof Paint Market Volume (Kilo Tons) Forecast, by Technology, 2022–2031
Table 46: France Crack Proof Paint Market Value (US$ Bn) Forecast, by Technology, 2022–2031
Table 47: France Crack Proof Paint Market Volume (Kilo Tons) Forecast, by End-use, 2022–2031
Table 48: France Crack Proof Paint Market Value (US$ Bn) Forecast, by End-use, 2022–2031
Table 49: U.K. Crack Proof Paint Market Volume (Kilo Tons) Forecast, by Resin, 2022–2031
Table 50: U.K. Crack Proof Paint Market Value (US$ Bn) Forecast, by Resin, 2022–2031
Table 51: U.K. Crack Proof Paint Market Volume (Kilo Tons) Forecast, by Technology, 2022–2031
Table 52: U.K. Crack Proof Paint Market Value (US$ Bn) Forecast, by Technology, 2022–2031
Table 53: U.K. Crack Proof Paint Market Volume (Kilo Tons) Forecast, by End-use, 2022–2031
Table 54: U.K. Crack Proof Paint Market Value (US$ Bn) Forecast, by End-use, 2022–2031
Table 55: Italy Crack Proof Paint Market Volume (Kilo Tons) Forecast, by Resin, 2022–2031
Table 56: Italy Crack Proof Paint Market Value (US$ Bn) Forecast, by Resin, 2022–2031
Table 57: Italy Crack Proof Paint Market Volume (Kilo Tons) Forecast, by Technology, 2022–2031
Table 58: Italy Crack Proof Paint Market Value (US$ Bn) Forecast, by Technology, 2022–2031
Table 59: Italy Crack Proof Paint Market Volume (Kilo Tons) Forecast, by End-use, 2022–2031
Table 60: Italy Crack Proof Paint Market Value (US$ Bn) Forecast, by End-use, 2022–2031
Table 61: Spain Crack Proof Paint Market Volume (Kilo Tons) Forecast, by Resin, 2022–2031
Table 62: Spain Crack Proof Paint Market Value (US$ Bn) Forecast, by Resin, 2022–2031
Table 63: Spain Crack Proof Paint Market Volume (Kilo Tons) Forecast, by Technology, 2022–2031
Table 64: Spain Crack Proof Paint Market Value (US$ Bn) Forecast, by Technology, 2022–2031
Table 65: Spain Crack Proof Paint Market Volume (Kilo Tons) Forecast, by End-use, 2022–2031
Table 66: Spain Crack Proof Paint Market Value (US$ Bn) Forecast, by End-use, 2022–2031
Table 67: Russia & CIS Crack Proof Paint Market Volume (Kilo Tons) Forecast, by Resin, 2022–2031
Table 68: Russia & CIS Crack Proof Paint Market Value (US$ Bn) Forecast, by Resin, 2022–2031
Table 69: Russia & CIS Crack Proof Paint Market Volume (Kilo Tons) Forecast, by Technology, 2022–2031
Table 70: Russia & CIS Crack Proof Paint Market Value (US$ Bn) Forecast, by Technology, 2022–2031
Table 71: Russia & CIS Crack Proof Paint Market Volume (Kilo Tons) Forecast, by End-use, 2022–2031
Table 72: Russia & CIS Crack Proof Paint Market Value (US$ Bn) Forecast, by End-use, 2022–2031
Table 73: Rest of Europe Crack Proof Paint Market Volume (Kilo Tons) Forecast, by Resin, 2022–2031
Table 74: Rest of Europe Crack Proof Paint Market Value (US$ Bn) Forecast, by Resin, 2022–2031
Table 75: Rest of Europe Crack Proof Paint Market Volume (Kilo Tons) Forecast, by Technology, 2022–2031
Table 76: Rest of Europe Crack Proof Paint Market Value (US$ Bn) Forecast, by Technology, 2022–2031
Table 77: Rest of Europe Crack Proof Paint Market Volume (Kilo Tons) Forecast, by End-use, 2022–2031
Table 78: Rest of Europe Crack Proof Paint Market Value (US$ Bn) Forecast, by End-use, 2022–2031
Table 79: Asia Pacific Crack Proof Paint Market Volume (Kilo Tons) Forecast, by Resin, 2022–2031
Table 80: Asia Pacific Crack Proof Paint Market Value (US$ Bn) Forecast, by Resin, 2022–2031
Table 81: Asia Pacific Crack Proof Paint Market Volume (Kilo Tons) Forecast, by Technology, 2022–2031
Table 82: Asia Pacific Crack Proof Paint Market Value (US$ Bn) Forecast, by Technology, 2022–2031
Table 83: Asia Pacific Crack Proof Paint Market Volume (Kilo Tons) Forecast, by End-use, 2022–2031
Table 84: Asia Pacific Crack Proof Paint Market Value (US$ Bn) Forecast, by End-use, 2022–2031
Table 85: Asia Pacific Crack Proof Paint Market Volume (Kilo Tons) Forecast, by Country and Sub-region, 2022–2031
Table 86: Asia Pacific Crack Proof Paint Market Value (US$ Bn) Forecast, by Country and Sub-region, 2022–2031
Table 87: China Crack Proof Paint Market Volume (Kilo Tons) Forecast, by Resin, 2022–2031
Table 88: China Crack Proof Paint Market Value (US$ Bn) Forecast, by Resin 2022–2031
Table 89: China Crack Proof Paint Market Volume (Kilo Tons) Forecast, by Technology, 2022–2031
Table 90: China Crack Proof Paint Market Value (US$ Bn) Forecast, by Technology, 2022–2031
Table 91: China Crack Proof Paint Market Volume (Kilo Tons) Forecast, by End-use, 2022–2031
Table 92: China Crack Proof Paint Market Value (US$ Bn) Forecast, by End-use, 2022–2031
Table 93: Japan Crack Proof Paint Market Volume (Kilo Tons) Forecast, by Resin, 2022–2031
Table 94: Japan Crack Proof Paint Market Value (US$ Bn) Forecast, by Resin, 2022–2031
Table 95: Japan Crack Proof Paint Market Volume (Kilo Tons) Forecast, by Technology, 2022–2031
Table 96: Japan Crack Proof Paint Market Value (US$ Bn) Forecast, by Technology, 2022–2031
Table 97: Japan Crack Proof Paint Market Volume (Kilo Tons) Forecast, by End-use, 2022–2031
Table 98: Japan Crack Proof Paint Market Value (US$ Bn) Forecast, by End-use, 2022–2031
Table 99: India Crack Proof Paint Market Volume (Kilo Tons) Forecast, by Resin, 2022–2031
Table 100: India Crack Proof Paint Market Value (US$ Bn) Forecast, by Resin, 2022–2031
Table 101: India Crack Proof Paint Market Volume (Kilo Tons) Forecast, by Technology, 2022–2031
Table 102: India Crack Proof Paint Market Value (US$ Bn) Forecast, by Technology, 2022–2031
Table 103: India Crack Proof Paint Market Volume (Kilo Tons) Forecast, by End-use, 2022–2031
Table 104: India Crack Proof Paint Market Value (US$ Bn) Forecast, by End-use, 2022–2031
Table 105: India Crack Proof Paint Market Volume (Kilo Tons) Forecast, by End-use, 2022–2031
Table 106: India Crack Proof Paint Market Value (US$ Bn) Forecast, by End-use 2022–2031
Table 107: ASEAN Crack Proof Paint Market Volume (Kilo Tons) Forecast, by Resin, 2022–2031
Table 108: ASEAN Crack Proof Paint Market Value (US$ Bn) Forecast, by Resin, 2022–2031
Table 109: ASEAN Crack Proof Paint Market Volume (Kilo Tons) Forecast, by Technology, 2022–2031
Table 110: ASEAN Crack Proof Paint Market Value (US$ Bn) Forecast, by Technology, 2022–2031
Table 111: ASEAN Crack Proof Paint Market Volume (Kilo Tons) Forecast, by End-use, 2022–2031
Table 112: ASEAN Crack Proof Paint Market Value (US$ Bn) Forecast, by End-use, 2022–2031
Table 113: Rest of Asia Pacific Crack Proof Paint Market Volume (Kilo Tons) Forecast, by Resin, 2022–2031
Table 114: Rest of Asia Pacific Crack Proof Paint Market Value (US$ Bn) Forecast, by Resin, 2022–2031
Table 115: Rest of Asia Pacific Crack Proof Paint Market Volume (Kilo Tons) Forecast, by Technology, 2022–2031
Table 116: Rest of Asia Pacific Crack Proof Paint Market Value (US$ Bn) Forecast, by Technology, 2022–2031
Table 117: Rest of Asia Pacific Crack Proof Paint Market Volume (Kilo Tons) Forecast, by End-use, 2022–2031
Table 118: Rest of Asia Pacific Crack Proof Paint Market Value (US$ Bn) Forecast, by End-use, 2022–2031
Table 119: Latin America Crack Proof Paint Market Volume (Kilo Tons) Forecast, by Resin, 2022–2031
Table 120: Latin America Crack Proof Paint Market Value (US$ Bn) Forecast, by Resin, 2022–2031
Table 121: Latin America Crack Proof Paint Market Volume (Kilo Tons) Forecast, by Technology, 2022–2031
Table 122: Latin America Crack Proof Paint Market Value (US$ Bn) Forecast, by Technology, 2022–2031
Table 123: Latin America Crack Proof Paint Market Volume (Kilo Tons) Forecast, by End-use, 2022–2031
Table 124: Latin America Crack Proof Paint Market Value (US$ Bn) Forecast, by End-use, 2022–2031
Table 125: Latin America Crack Proof Paint Market Volume (Kilo Tons) Forecast, by Country and Sub-region, 2022–2031
Table 126: Latin America Crack Proof Paint Market Value (US$ Bn) Forecast, by Country and Sub-region, 2022–2031
Table 127: Brazil Crack Proof Paint Market Volume (Kilo Tons) Forecast, by Resin, 2022–2031
Table 128: Brazil Crack Proof Paint Market Value (US$ Bn) Forecast, by Resin, 2022–2031
Table 129: Brazil Crack Proof Paint Market Volume (Kilo Tons) Forecast, by Technology, 2022–2031
Table 130: Brazil Crack Proof Paint Market Value (US$ Bn) Forecast, by Technology, 2022–2031
Table 131: Brazil Crack Proof Paint Market Volume (Kilo Tons) Forecast, by End-use, 2022–2031
Table 132: Brazil Crack Proof Paint Market Value (US$ Bn) Forecast, by End-use, 2022–2031
Table 133: Mexico Crack Proof Paint Market Volume (Kilo Tons) Forecast, by Resin, 2022–2031
Table 134: Mexico Crack Proof Paint Market Value (US$ Bn) Forecast, by Resin, 2022–2031
Table 135: Mexico Crack Proof Paint Market Volume (Kilo Tons) Forecast, by Technology, 2022–2031
Table 136: Mexico Crack Proof Paint Market Value (US$ Bn) Forecast, by Technology, 2022–2031
Table 137: Mexico Crack Proof Paint Market Volume (Kilo Tons) Forecast, by End-use, 2022–2031
Table 138: Mexico Crack Proof Paint Market Value (US$ Bn) Forecast, by End-use, 2022–2031
Table 139: Rest of Latin America Crack Proof Paint Market Volume (Kilo Tons) Forecast, by Resin, 2022–2031
Table 140: Rest of Latin America Crack Proof Paint Market Value (US$ Bn) Forecast, by Resin, 2022–2031
Table 141: Rest of Latin America Crack Proof Paint Market Volume (Kilo Tons) Forecast, by Technology, 2022–2031
Table 142: Rest of Latin America Crack Proof Paint Market Value (US$ Bn) Forecast, by Technology, 2022–2031
Table 143: Rest of Latin America Crack Proof Paint Market Volume (Kilo Tons) Forecast, by End-use, 2022–2031
Table 144: Rest of Latin America Crack Proof Paint Market Value (US$ Bn) Forecast, by End-use, 2022–2031
Table 145: Middle East & Africa Crack Proof Paint Market Volume (Kilo Tons) Forecast, by Resin, 2022–2031
Table 146: Middle East & Africa Crack Proof Paint Market Value (US$ Bn) Forecast, by Resin, 2022–2031
Table 147: Middle East & Africa Crack Proof Paint Market Volume (Kilo Tons) Forecast, by Technology, 2022–2031
Table 148: Middle East & Africa Crack Proof Paint Market Value (US$ Bn) Forecast, by Technology, 2022–2031
Table 149: Middle East & Africa Crack Proof Paint Market Volume (Kilo Tons) Forecast, by End-use, 2022–2031
Table 150: Middle East & Africa Crack Proof Paint Market Value (US$ Bn) Forecast, by End-use, 2022–2031
Table 151: Middle East & Africa Crack Proof Paint Market Volume (Kilo Tons) Forecast, by Country and Sub-region, 2022–2031
Table 152: Middle East & Africa Crack Proof Paint Market Value (US$ Bn) Forecast, by Country and Sub-region, 2022–2031
Table 153: GCC Crack Proof Paint Market Volume (Kilo Tons) Forecast, by Resin, 2022–2031
Table 154: GCC Crack Proof Paint Market Value (US$ Bn) Forecast, by Resin, 2022–2031
Table 155: GCC Crack Proof Paint Market Volume (Kilo Tons) Forecast, by Technology, 2022–2031
Table 156: GCC Crack Proof Paint Market Value (US$ Bn) Forecast, by Technology, 2022–2031
Table 157: GCC Crack Proof Paint Market Volume (Kilo Tons) Forecast, by End-use, 2022–2031
Table 158: GCC Crack Proof Paint Market Value (US$ Bn) Forecast, by End-use, 2022–2031
Table 159: South Africa Crack Proof Paint Market Volume (Kilo Tons) Forecast, by Resin, 2022–2031
Table 160: South Africa Crack Proof Paint Market Value (US$ Bn) Forecast, by Resin, 2022–2031
Table 161: South Africa Crack Proof Paint Market Volume (Kilo Tons) Forecast, by Technology, 2022–2031
Table 162: South Africa Crack Proof Paint Market Value (US$ Bn) Forecast, by Technology, 2022–2031
Table 163: South Africa Crack Proof Paint Market Volume (Kilo Tons) Forecast, by End-use, 2022–2031
Table 164: South Africa Crack Proof Paint Market Value (US$ Bn) Forecast, by End-use, 2022–2031
Table 165: Rest of Middle East & Africa Crack Proof Paint Market Volume (Kilo Tons) Forecast, by Resin, 2022–2031
Table 166: Rest of Middle East & Africa Crack Proof Paint Market Value (US$ Bn) Forecast, by Resin, 2022–2031
Table 167: Rest of Middle East & Africa Crack Proof Paint Market Volume (Kilo Tons) Forecast, by Technology, 2022–2031
Table 168: Rest of Middle East & Africa Crack Proof Paint Market Value (US$ Bn) Forecast, by Technology, 2022–2031
Table 169: Rest of Middle East & Africa Crack Proof Paint Market Volume (Kilo Tons) Forecast, by End-use, 2022–2031
Table 170: Rest of Middle East & Africa Crack Proof Paint Market Value (US$ Bn) Forecast, by End-use, 2022–2031
List of Figures
Figure 1: Global Crack Proof Paint Market Volume Share Analysis, by Resin, 2021, 2027, and 2031
Figure 2: Global Crack Proof Paint Market Attractiveness, by Resin
Figure 3: Global Crack Proof Paint Market Volume Share Analysis, by Technology, 2021, 2027, and 2031
Figure 4: Global Crack Proof Paint Market Attractiveness, by Technology
Figure 5: Global Crack Proof Paint Market Volume Share Analysis, by End-use, 2021, 2027, and 2031
Figure 6: Global Crack Proof Paint Market Attractiveness, by End-use
Figure 7: Global Crack Proof Paint Market Volume Share Analysis, by Region, 2021, 2027, and 2031
Figure 8: Global Crack Proof Paint Market Attractiveness, by Region
Figure 9: North America Crack Proof Paint Market Volume Share Analysis, by Resin, 2021, 2027, and 2031
Figure 10: North America Crack Proof Paint Market Attractiveness, by Resin
Figure 11: North America Crack Proof Paint Market Attractiveness, by Resin
Figure 12: North America Crack Proof Paint Market Volume Share Analysis, by Technology, 2021, 2027, and 2031
Figure 13: North America Crack Proof Paint Market Attractiveness, by Technology
Figure 14: North America Crack Proof Paint Market Volume Share Analysis, by End-use, 2021, 2027, and 2031
Figure 15: North America Crack Proof Paint Market Attractiveness, by End-use
Figure 16: North America Crack Proof Paint Market Attractiveness, by Country and Sub-region
Figure 17: Europe Crack Proof Paint Market Volume Share Analysis, by Resin, 2021, 2027, and 2031
Figure 18: Europe Crack Proof Paint Market Attractiveness, by Resin
Figure 19: Europe Crack Proof Paint Market Volume Share Analysis, by Technology, 2021, 2027, and 2031
Figure 20: Europe Crack Proof Paint Market Attractiveness, by Technology
Figure 21: Europe Crack Proof Paint Market Volume Share Analysis, by End-use, 2021, 2027, and 2031
Figure 22: Europe Crack Proof Paint Market Attractiveness, by End-use
Figure 23: Europe Crack Proof Paint Market Volume Share Analysis, by Country and Sub-region, 2021, 2027, and 2031
Figure 24: Europe Crack Proof Paint Market Attractiveness, by Country and Sub-region
Figure 25: Asia Pacific Crack Proof Paint Market Volume Share Analysis, by Resin, 2021, 2027, and 2031
Figure 26: Asia Pacific Crack Proof Paint Market Attractiveness, by Resin
Figure 27: Asia Pacific Crack Proof Paint Market Volume Share Analysis, by Technology, 2021, 2027, and 2031
Figure 28: Asia Pacific Crack Proof Paint Market Attractiveness, by Technology
Figure 29: Asia Pacific Crack Proof Paint Market Volume Share Analysis, by End-use, 2021, 2027, and 2031
Figure 30: Asia Pacific Crack Proof Paint Market Attractiveness, by End-use
Figure 31: Asia Pacific Crack Proof Paint Market Volume Share Analysis, by Country and Sub-region, 2021, 2027, and 2031
Figure 32: Asia Pacific Crack Proof Paint Market Attractiveness, by Country and Sub-region
Figure 33: Latin America Crack Proof Paint Market Volume Share Analysis, by Resin, 2021, 2027, and 2031
Figure 34: Latin America Crack Proof Paint Market Attractiveness, by Resin
Figure 35: Latin America Crack Proof Paint Market Volume Share Analysis, by Technology, 2021, 2027, and 2031
Figure 36: Latin America Crack Proof Paint Market Attractiveness, by Technology
Figure 37: Latin America Crack Proof Paint Market Volume Share Analysis, by End-use, 2021, 2027, and 2031
Figure 38: Latin America Crack Proof Paint Market Attractiveness, by End-use
Figure 39: Latin America Crack Proof Paint Market Volume Share Analysis, by Country and Sub-region, 2021, 2027, and 2031
Figure 40: Latin America Crack Proof Paint Market Attractiveness, by Country and Sub-region
Figure 41: Middle East & Africa Crack Proof Paint Market Volume Share Analysis, by Resin, 2021, 2027, and 2031
Figure 42: Middle East & Africa Crack Proof Paint Market Attractiveness, by Resin
Figure 43: Middle East & Africa Crack Proof Paint Market Volume Share Analysis, by Technology, 2021, 2027, and 2031
Figure 44: Middle East & Africa Crack Proof Paint Market Attractiveness, by Technology
Figure 45: Middle East & Africa Crack Proof Paint Market Volume Share Analysis, by End-use, 2021, 2027, and 2031
Figure 46: Middle East & Africa Crack Proof Paint Market Attractiveness, by End-use
Figure 47: Middle East & Africa Crack Proof Paint Market Volume Share Analysis, by Country and Sub-region, 2021, 2027, and 2031
Figure 48: Middle East & Africa Crack Proof Paint Market Attractiveness, by Country and Sub-region
Copyright © Transparency Market Research, Inc. All Rights reserved
Trust Online

Crack Proof Paint Market