
Reports
Reports
Global Constipation Treatment Market: Snapshot
The demand in the global market for constipation treatment is projected to increment at a healthy CAGR of 7.1% during the forecast period of 2017 to 2025. This prosperity of the constipation treatment market is primarily a reflection of escalating geriatric population across the globe, as people aged over 50 years are highly prone to irregular bowel movement. Consistent research and development to develop novel drugs that are more efficient, improving healthcare infrastructure in various emerging economies, and growing awareness among the end-users are some of the other factors favoring the global constipation treatment market. On the other hand, continued reliance of the patients on over-the-counter drugs and vast unmet demands in rural areas of developing countries is hindering the proper prosperity of the global constipation treatment market. Evaluated to have a worth of US$12.58 bn in 2016, the global constipation treatment market is estimated to reach a valuation of US$22.93 bn by the end of the forecast period, which is 2025.
Laxatives Remain Highly Profitable Therapeutic Segment
On the basis of therapeutic option, the global market for constipation treatment is segmented into laxatives, peripherally acting mu opioid receptor antagonists, chloride channel activators, GC-C agonists, and 5-HT4 receptor agonists. In 2016, the laxatives segment, which is further categorized into bulk forming agents, stimulant laxatives, and osmotic laxatives, accounted for the maximum demand-share. Over the course of the forecast period, the laxatives segment is anticipated to be most promising and dominate the market share. Affordability for the masses owing to low cost and wide availability are two key factors leading to the prosperity of this laxatives segment. That being said, GC-C agonists segment is projected for the best CAGR of 8.7% from 2017 to 2025.
Based on the type of disease, the global constipation treatment market is bifurcated into irritable bowel syndrome with constipation, chronic idiopathic constipation, and opioid induced constipation. The opioid induced constipation segment is projected to expand at CAGR of 7.5% during the forecast period from 2017 to 2025. Based on distribution channel, global market is classified into hospital pharmacies, retail pharmacies, and online pharmacies. Retail pharmacies segment is projected to hold major share of global constipation treatment market in the near future.
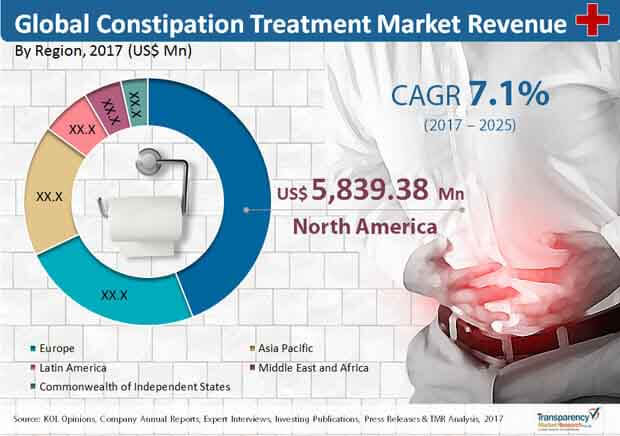
Asia Pacific Projected for Most Impressive Growth Rate
Geographically, the global constipation treatment market has been classified into six major regions, viz. North America, Asia Pacific, Europe, Latin America, The Middle East & Africa, and Commonwealth of Independent States. In 2017, North America served the maximum demand in the constipation treatment market, owing to high prevalence of chronic constipation, high per capita healthcare expenditure, and availability of specialty constipation medicines. The North America constipation market is estimated to be worth US$9.98 bn by the end of 2025. Europe currently is second most lucrative region for the vendors operating in this market, however, Asia Pacific is anticipated to turn into a region-of-focus, with its considerably established market in emerging economies. Japan, India, and China are identified as three emerging country-wide markets for constipation treatment.
Some of the key players currently holding a position of strength in the global constipation market are: Bayer AG, Ironwood Pharmaceuticals, Inc., Takeda Pharmaceuticals Company Limited, Sanofi, AstraZeneca, Abbott Laboratories, Sucampo Pharmaceuticals, Inc., Synergy Pharmaceuticals, Inc., Valeant Pharmaceuticals International, Inc., Valeant Pharmaceuticals International, Inc., Janssen Pharmaceutical Company, Daewoong Pharmaceuticals Co. Ltd., Prestige Brands Holdings, Inc., Shionogi & Co., Ltd., Renexxion, LLC., Albireo Pharma, Inc., and Cosmo Pharmaceuticals NV.
New Medical Management Approaches Enrich Constipation Treatment Market
Constipation has been associated with high prevalence among worldwide populations, with chronic constipation usually leading to a dramatic fall in the quality of life in affected individuals. The high costs of OTC laxatives, due to prolonged reliance, and frequent doctor visits are factors that add to the psychological distress. Thus, there is a massive unmet need for proper medical management of chronic, propelling lifestyle modifications and medications. A severe case of distress comes from constipation-predominant irritable bowel syndrome (IBS). Aside from the common recommendations for lifestyle modifications, pharmacologic management has gained widespread traction in adolescents and young adults. Growing research in medical management of constipation is a key trend bolstering the growth potential of the constipation treatment market. Advances in diagnostic technologies and the chronic nature of the conditions force individuals to undergo extensive diagnostic evaluation. The growing number of patients diagnosed with rectal sensorimotor dysfunction has spurred R&D in the constipation treatment market. Some of the common diagnostic evaluations propelling the demand for medical management of constipation are endoscopy, anorectal manometry, and colonic transit study. Equipment used in these procedures have notably undergone marked technological advancements, aiding in the prognosis of chronic constipation. A number of dietary and drug approaches have emerged for managing chronic constipation, thereby boosting the prospects of the constipation market.
The COVID-19 pandemic and the still emerging outbreaks in new waves have been cause for governments and industry stakeholders. On one hand, policy makers are burdened with responsibility to upgrade the medical infrastructure to meet the drastically changing needs of the pandemic. On the other hand, maintaining a healthy flow of finances and money seems to be an unsurmountable challenge. The work-at-home has become a norm rather than exception and has remained so for the past several months in 2020 and in 2021 also. This has changed the whole dynamics of health and wellness. These disruptions are also likely to play a crucial role redefining the contours of the constipation treatment market in the near future.
1. Preface
1.1. Market Definition and Scope
1.2. Market Segmentation
1.3. Key Research Objectives
1.4. Research Highlights
2. Assumptions and Research Methodology
3. Executive Summary: Global Constipation Treatment Market
4. Market Overview
4.1. Introduction
4.1.1. Product Definition
4.1.2. Industry Evolution / Developments
4.2. Market Overview
4.3. Key Market Indicators
4.4. Market Dynamics
4.4.1. Drivers
4.4.2. Restraints
4.4.3. Opportunities
4.5. Constipation Treatment Market Analysis and Forecast, 2017 – 2025
4.5.1. Market Revenue Projections (US$ Mn)
4.6. Porter’s five forces analysis
4.7. Global Prevalence of Chronic Constipation
4.8. Global Prevalence if Irritable Bowel Syndrome
4.9. Pipeline Analysis
4.10. Value Chain Analysis
4.11. Market Outlook
5. Global Constipation Treatment Market Analysis and Forecasts, By Therapeutic Option
5.1. Introduction & Definition
5.2. Key Findings
5.3. Key Trends
5.4. Market Size (US$ Mn) Forecast, By Therapeutic Option
5.4.1. Laxatives
5.4.1.1. Bulk forming agents
5.4.1.2. Osmotic laxatives
5.4.1.3. Stimulant laxatives
5.4.1.4. Others
5.4.2. Chloride channel activators
5.4.3. Peripherally Acting Mu-Opioid Receptor Antagonists
5.4.4. GC-C Agonists
5.4.5. 5-HT4 Receptor Agonists
5.5. New Chronic Constipation Therapies Market Revenue (US$) Forecast, 2017-2025
5.6. Market Attractiveness, By Therapeutic Option
6. Global Constipation Treatment Market Analysis and Forecasts, By Disease Type
6.1. Introduction & Definition
6.2. Key Findings
6.3. Key Trends
6.4. Market Size (US$ Mn) Forecast, By Disease Type
6.4.1. Chronic idiopathic constipation (CIC)
6.4.2. Irritable bowel syndrome with constipation (IBS-C)
6.4.3. Opioid-induced constipation (OIC)
6.5. Market Attractiveness, By Disease Type
7. Global Constipation Treatment Market Analysis and Forecasts, By Distribution Channel
7.1. Introduction & Definition
7.2. Key Findings
7.3. Key Trends
7.4. Market Size (US$ Mn) Forecast, By Distribution Chanel
7.4.1. Hospital Pharmacies
7.4.2. Retail Pharmacies
7.4.3. Online Pharmacies
7.5. Market Attractiveness, By Distribution Channel
8. Global Constipation Treatment Market Analysis and Forecasts, By Region
8.1. Introduction & Definition
8.2. Key Findings
8.3. Key Trends
8.4. Market Size (US$ Mn) Forecast, By Region
8.4.1. North America
8.4.2. Europe
8.4.3. Asia Pacific
8.4.4. Latin America
8.4.5. Middle East and Africa
8.4.6. Commonwealth of Independent States
8.5. Market Attractiveness, By Region
9. North America Constipation Treatment Market Analysis and Forecast
9.1. Introduction
9.2. Key Findings
9.3. Key Trends
9.4. Market Size (US$ Mn) Forecast, By Therapeutic Option
9.4.1. Laxatives
9.4.1.1. Bulk forming agents
9.4.1.2. Osmotic laxatives
9.4.1.3. Stimulant laxatives
9.4.1.4. Others
9.4.2. Chloride channel activators
9.4.3. Peripherally Acting Mu-Opioid Receptor Antagonists
9.4.4. GC-C Agonists
9.5. Market Size (US$ Mn) Forecast, By Disease Type
9.5.1. Chronic idiopathic constipation (CIC)
9.5.2. Irritable bowel syndrome with constipation (IBS-C)
9.5.3. Opioid-induced constipation (OIC)
9.6. Market Size (US$ Mn) Forecast, By Distribution Chanel
9.6.1. Hospital Pharmacies
9.6.2. Retail Pharmacies
9.6.3. Online Pharmacies
9.7. Market Size by Value (US$ Mn) Forecast, By Country
9.7.1. The U.S.
9.7.2. Canada
9.8. Market Attractiveness Analysis
9.8.1. By Therapeutic Option
9.8.2. By Disease Type
9.8.3. By Distribution Channel
9.8.4. By Country
10. Europe Constipation Treatment Market Analysis and Forecast
10.1. Introduction
10.2. Key Findings
10.3. Key Trends
10.4. Market Size (US$ Mn) Forecast, By Therapeutic Option
10.4.1. Laxatives
10.4.1.1. Bulk forming agents
10.4.1.2. Osmotic laxatives
10.4.1.3. Stimulant laxatives
10.4.1.4. Others
10.4.2. Chloride channel activators
10.4.3. Peripherally Acting Mu-Opioid Receptor Antagonists
10.4.4. GC-C Agonists
10.4.5. 5-HT4 Receptor Agonists
10.5. Market Size (US$ Mn) Forecast, By Disease Type
10.5.1. Chronic idiopathic constipation (CIC)
10.5.2. Irritable bowel syndrome with constipation (IBS-C)
10.5.3. Opioid-induced constipation (OIC)
10.6. Market Size (US$ Mn) Forecast, By Distribution Chanel
10.6.1. Hospital Pharmacies
10.6.2. Retail Pharmacies
10.6.3. Online Pharmacies
10.7. Market Size by Value (US$ Mn) Forecast, By Country
10.7.1. Germany
10.7.2. France
10.7.3. U.K.
10.7.4. Spain
10.7.5. Italy
10.7.6. Rest of Europe
10.8. Market Attractiveness Analysis
10.8.1. By Therapeutic Option
10.8.2. By Disease Type
10.8.3. By Distribution Channel
10.8.4. By Country
11. Asia Pacific Constipation Treatment Market Analysis and Forecast
11.1. Introduction
11.2. Key Findings
11.3. Regulatory Scenario
11.4. Key Trends
11.5. Market Size (US$ Mn) Forecast, By Therapeutic Option
11.5.1. Laxatives
11.5.1.1. Bulk forming agents
11.5.1.2. Osmotic laxatives
11.5.1.3. Stimulant laxatives
11.5.1.4. Others
11.5.2. Chloride channel activators
11.5.3. Peripherally Acting Mu-Opioid Receptor Antagonists
11.5.4. GC-C Agonists
11.5.5. 5-HT4 Receptor Agonists
11.6. Market Size (US$ Mn) Forecast, By Disease Type
11.6.1. Chronic idiopathic constipation (CIC)
11.6.2. Irritable bowel syndrome with constipation (IBS-C)
11.6.3. Opioid-induced constipation (OIC)
11.7. Market Size (US$ Mn) Forecast, By Distribution Chanel
11.7.1. Hospital Pharmacies
11.7.2. Retail Pharmacies
11.7.3. Online Pharmacies
11.8. Market Size by Value (US$ Mn) Forecast, By Country
11.8.1. Philippines
11.8.2. Thailand
11.8.3. Indonesia
11.8.4. South Korea
11.8.5. Singapore
11.8.6. Malaysia
11.8.7. Rest of Asia Pacific
11.9. Market Attractiveness Analysis
11.9.1. By Therapeutic Option
11.9.2. By Disease Type
11.9.3. By Distribution Channel
11.9.4. By Country
12. Latin America Constipation Treatment Market Analysis and Forecast
12.1. Introduction
12.2. Key Findings
12.3. Regulatory Scenario
12.4. Key Trends
12.5. Market Size (US$ Mn) Forecast, By Therapeutic Option
12.5.1. Laxatives
12.5.1.1. Bulk forming agents
12.5.1.2. Osmotic laxatives
12.5.1.3. Stimulant laxatives
12.5.1.4. Others
12.5.2. Chloride channel activators
12.5.3. Peripherally Acting Mu-Opioid Receptor Antagonists
12.5.4. GC-C Agonists
12.5.5. 5-HT4 Receptor Agonists
12.6. Market Size (US$ Mn) Forecast, By Disease Type
12.6.1. Chronic idiopathic constipation (CIC)
12.6.2. Irritable bowel syndrome with constipation (IBS-C)
12.6.3. Opioid-induced constipation (OIC)
12.7. Market Size (US$ Mn) Forecast, By Distribution Chanel
12.7.1. Hospital Pharmacies
12.7.2. Retail Pharmacies
12.7.3. Online Pharmacies
12.8. Market Size by Value (US$ Mn) Forecast, By Country
12.8.1. Brazil
12.8.2. Mexico
12.8.3. Argentina
12.8.4. Ecuador
12.8.5. Peru
12.8.6. Rest of Latin America
12.9. Market Attractiveness Analysis
12.9.1. By Therapeutic Option
12.9.2. By Disease Type
12.9.3. By Distribution Channel
12.9.4. By Country
13. Middle East and Africa Constipation Treatment Market Analysis and Forecast
13.1. Introduction
13.2. Key Findings
13.3. Regulatory Scenario
13.4. Key Trends
13.5. Market Size (US$ Mn) Forecast, By Therapeutic Option
13.5.1. Laxatives
13.5.1.1. Bulk forming agents
13.5.1.2. Osmotic laxatives
13.5.1.3. Stimulant laxatives
13.5.1.4. Others
13.5.2. Chloride channel activators
13.5.3. Peripherally Acting Mu-Opioid Receptor Antagonists
13.5.4. GC-C Agonists
13.5.5. 5-HT4 Receptor Agonists
13.6. Market Size (US$ Mn) Forecast, By Disease Type
13.6.1. Chronic idiopathic constipation (CIC)
13.6.2. Irritable bowel syndrome with constipation (IBS-C)
13.6.3. Opioid-induced constipation (OIC)
13.7. Market Size (US$ Mn) Forecast, By Distribution Chanel
13.7.1. Hospital Pharmacies
13.7.2. Retail Pharmacies
13.7.3. Online Pharmacies
13.8. Market Size by Value (US$ Mn) Forecast, By Country
13.8.1. Saudi Arabia
13.8.2. South Africa
13.8.3. Rest of Middle East and Africa
13.9. Market Attractiveness Analysis
13.9.1. By Therapeutic Option
13.9.2. By Disease Type
13.9.3. By Distribution Channel
13.9.4. By Country
14. Commonwealth of Independent States Constipation Treatment Market Analysis and Forecast
14.1. Introduction
14.2. Key Findings
14.3. Market Size (US$ Mn) Forecast, By Therapeutic Option
14.3.1. Laxatives
14.3.1.1. Bulk forming agents
14.3.1.2. Osmotic laxatives
14.3.1.3. Stimulant laxatives
14.3.1.4. Others
14.3.2. Chloride channel activators
14.3.3. Peripherally Acting Mu-Opioid Receptor Antagonists
14.3.4. GC-C Agonists
14.3.5. 5-HT4 Receptor Agonists
14.4. Market Size (US$ Mn) Forecast, By Disease Type
14.4.1. Chronic idiopathic constipation (CIC)
14.4.2. Irritable bowel syndrome with constipation (IBS-C)
14.4.3. Opioid-induced constipation (OIC)
14.5. Market Size (US$ Mn) Forecast, By Distribution Chanel
14.5.1. Hospital Pharmacies
14.5.2. Retail Pharmacies
14.5.3. Online Pharmacies
14.6. Market Size by Value (US$ Mn) Forecast, By Country
14.6.1. Russian Federation
14.6.2. Ukraine
14.6.3. Kazakhstan
14.7. Market Attractiveness Analysis
14.7.1. By Therapeutic Option
14.7.2. By Disease Type
14.7.3. By Distribution Channel
14.7.4. By Country
15. Competition Landscape
15.1. Market Player – Competition Matrix (By Tier and Size of companies)
15.2. Company Profiles (Details – Overview, Financials, Recent Developments, Strategy)
15.2.1. Takeda Pharmaceutical Company Ltd
15.2.1.1. Company Overview (HQ, Business Segments, Employee Strength)
15.2.1.2. Product Portfolio
15.2.1.3. SWOT Analysis
15.2.1.4. Financial Overview
15.2.1.5. Strategic Overview
15.2.2. Synergy Pharmaceuticals, Inc.
15.2.2.1. Company Overview (HQ, Business Segments, Employee Strength)
15.2.2.2. Product Portfolio
15.2.2.3. SWOT Analysis
15.2.2.4. Financial Overview
15.2.2.5. Strategic Overview
15.2.3. Sucampo Pharmaceuticals, Inc.
15.2.3.1. Company Overview (HQ, Business Segments, Employee Strength)
15.2.3.2. Product Portfolio
15.2.3.3. SWOT Analysis
15.2.3.4. Financial Overview
15.2.3.5. Strategic Overview
15.2.4. Ironwood Pharmaceuticals, Inc.
15.2.4.1. Company Overview (HQ, Business Segments, Employee Strength)
15.2.4.2. Product Portfolio
15.2.4.3. SWOT Analysis
15.2.4.4. Financial Overview
15.2.4.5. Strategic Overview
15.2.5. Valeant Pharmaceuticals International, Inc.
15.2.5.1. Company Overview (HQ, Business Segments, Employee Strength)
15.2.5.2. Product Portfolio
15.2.5.3. SWOT Analysis
15.2.5.4. Financial Overview
15.2.5.5. Strategic Overview
15.2.6. Abbott Laboratories
15.2.6.1. Company Overview (HQ, Business Segments, Employee Strength)
15.2.6.2. Product Portfolio
15.2.6.3. SWOT Analysis
15.2.6.4. Financial Overview
15.2.6.5. Strategic Overview
15.2.7. AstraZeneca
15.2.7.1. Company Overview (HQ, Business Segments, Employee Strength)
15.2.7.2. Product Portfolio
15.2.7.3. SWOT Analysis
15.2.7.4. Financial Overview
15.2.7.5. Strategic Overview
15.2.8. Cosmo Pharmaceuticals NV
15.2.8.1. Company Overview (HQ, Business Segments, Employee Strength)
15.2.8.2. Product Portfolio
15.2.8.3. SWOT Analysis
15.2.8.4. Financial Overview
15.2.8.5. Strategic Overview
15.2.9. Sanofi
15.2.9.1. Company Overview (HQ, Business Segments, Employee Strength)
15.2.9.2. Product Portfolio
15.2.9.3. SWOT Analysis
15.2.9.4. Financial Overview
15.2.9.5. Strategic Overview
15.2.10. Daewoong Pharmaceuticals Co. Ltd.
15.2.10.1. Company Overview (HQ, Business Segments, Employee Strength)
15.2.10.2. Product Portfolio
15.2.10.3. SWOT Analysis
15.2.10.4. Financial Overview
15.2.10.5. Strategic Overview
15.2.11. Bayer AG
15.2.11.1. Company Overview (HQ, Business Segments, Employee Strength)
15.2.11.2. Product Portfolio
15.2.11.3. SWOT Analysis
15.2.11.4. Financial Overview
15.2.11.5. Strategic Overview
15.2.12. Prestige Brands Holdings, Inc.
15.2.12.1. Company Overview (HQ, Business Segments, Employee Strength)
15.2.12.2. Product Portfolio
15.2.12.3. SWOT Analysis
15.2.12.4. Financial Overview
15.2.12.5. Strategic Overview
15.2.13. Janssen Pharmaceutical Company
15.2.13.1. Company Overview (HQ, Business Segments, Employee Strength)
15.2.13.2. Product Portfolio
15.2.13.3. SWOT Analysis
15.2.13.4. Financial Overview
15.2.13.5. Strategic Overview
15.2.14. Shionogi & Co., Ltd.
15.2.14.1. Company Overview (HQ, Business Segments, Employee Strength)
15.2.14.2. Product Portfolio
15.2.14.3. SWOT Analysis
15.2.14.4. Financial Overview
15.2.14.5. Strategic Overview
15.2.15. Albireo Pharma, Inc.
15.2.15.1. Company Overview (HQ, Business Segments, Employee Strength)
15.2.15.2. Product Portfolio
15.2.15.3. SWOT Analysis
15.2.15.4. Financial Overview
15.2.15.5. Strategic Overview
15.2.16. Renexxion, LLC
15.2.16.1. Company Overview (HQ, Business Segments, Employee Strength)
15.2.16.2. Product Portfolio
15.2.16.3. SWOT Analysis
15.2.16.4. Strategic Overview
16. Key Takeaways
List of Tables
Table 01: Pipeline Analysis, By Phase 3 Drugs
Table 02 : Pipeline Analysis, By Phase 2 (1/2)
Table 03: Pipeline Analysis, By phase 2 (2/2)
Table 04: Global Constipation Treatment Market Size (US$ Mn) Forecast, by Therapeutic Option, 2015–2025
Table 05: Global Constipation Treatment Market Size (US$ Mn) Forecast, by Laxatives, 2015–2025
Table 06: Global Constipation Treatment Market Size (US$ Mn) Forecast, by Disease Type, 2015–2025
Table 07: Global Constipation Treatment Market Size (US$ Mn) Forecast, by Distribution Channel, 2015–2025
Table 08: Global Constipation Treatment Market Size (US$ Mn) Forecast, by Region, 2015–2025
Table 09: North America Constipation Treatment Market Value (US$ Mn) Forecast, by Therapeutic Option,2015–2025
Table 10: North America Constipation Treatment Market Value (US$ Mn) Forecast, by Laxatives, 2015–2025
Table 11: North America Constipation Treatment Market Value (US$ Mn) Forecast, by Disease Type, 2015–2025
Table 12: North America Constipation Treatment Market Value (US$ Mn) Forecast, by Distribution Channel,2015–2025
Table 13: North America Constipation Treatment Market Value (US$ Mn) Forecast, by Country/Sub-region,2015–2025
Table 14: Europe Constipation Treatment Market Value (US$ Mn) Forecast, by Therapeutic Option, 2015–2025
Table 15: Europe Constipation Treatment Market Value (US$ Mn) Forecast, by Laxatives, 2015–2025
Table 16: Europe Constipation Treatment Market Value (US$ Mn) Forecast, by Disease Type, 2015–2025
Table 17: Europe Constipation Treatment Market Value (US$ Mn) Forecast, by Distribution Channel, 2015–2025
Table 18: Europe Constipation Treatment Market Value (US$ Mn) Forecast, by Country/Sub-region, 2015–2025
Table 19: Asia Pacific Constipation Treatment Market Value (US$ Mn) Forecast, by Therapeutic Option, 2015–2025
Table 20: Asia Pacific Constipation Treatment Market Value (US$ Mn) Forecast, by Laxatives, 2015–2025
Table 21: Asia Pacific Constipation Treatment Market Value (US$ Mn) Forecast, by Disease Type, 2015–2025
Table 22: Asia Pacific Constipation Treatment Market Value (US$ Mn) Forecast, by Distribution Channel, 2015–2025
Table 23: Asia Pacific Constipation Treatment Market Value (US$ Mn) Forecast, by Country/Sub-region, 2015–2025
Table 24: Latin America Constipation Treatment Market Value (US$ Mn) Forecast, by Therapeutic Option,2015–2025
Table 25: Latin America Constipation Treatment Market Value (US$ Mn) Forecast, by Laxatives, 2015–2025
Table 26: Latin America Constipation Treatment Market Value (US$ Mn) Forecast, by Disease Type, 2015–2025
Table 27: Latin America Constipation Treatment Market Value (US$ Mn) Forecast, by Distribution Channel,2015–2025
Table 28: Latin America Constipation Treatment Market Value (US$ Mn) Forecast, by Country/Sub-region, 2015–2025
Table 29: Middle East & Africa Constipation Treatment Market Value (US$ Mn) Forecast, by Therapeutic Option, 2015–2025
Table 30: Middle East & Africa Constipation Treatment Market Value (US$ Mn) Forecast, by Laxatives, 2015–2025
Table 31: Middle East & Africa Constipation Treatment Market Value (US$ Mn) Forecast, by Disease Type, 2015–2025
Table 32: Middle East & Africa Constipation Treatment Market Value (US$ Mn) Forecast, by Distribution Channel, 2015–2025
Table 33: Middle East & Africa Constipation Treatment Market Value (US$ Mn) Forecast, by Country, 2015–2025
Table 34: CIS Constipation Treatment Market Value (US$ Mn) Forecast, by Therapeutic Option, 2015–2025
Table 35: CIS Constipation Treatment Market Value (US$ Mn) Forecast, by Laxatives, 2015–2025
Table 36: CIS Constipation Treatment Market Value (US$ Mn) Forecast, by Disease Type, 2015–2025
Table 37: CIS Constipation Treatment Market Value (US$ Mn) Forecast, by Distribution Channel, 2015–2025
Table 38: CIS Constipation Treatment Market Value (US$ Mn) Forecast, by Country/Sub-region, 2015–2025
List of Figures
Figure 01: Global Constipation Treatment Market, by Therapeutic Option, Market Size (US$ Mn), 2016 (A)
Figure 02: Global Constipation Treatment Market Revenue (%), by Disease Type, 2016 (A)
Figure 03: Global Constipation Treatment Market Size (US$ Mn) Forecast, 2015–2025
Figure 04: Global Prevalence of Constipation
Figure 05: Global Prevalence of Irritable Bowel Syndrome
Figure 06: Market Value Share, by Therapeutic Option (2016)
Figure 07: Market Value Share, by Disease Type (2016)
Figure 08: Market Value Share, by Distribution Channel (2016)
Figure 09: Global Constipation Treatment Market Value Share, by Therapeutic Option, 2016 and 2025
Figure 10: Global Constipation Treatment Market Attractiveness, by Therapeutic Option, 2017–2025
Figure 11: Global Constipation Treatment Market Revenue (US$ Mn) and Y-o-Y Growth (%), by Laxatives, 2015–2025
Figure 12: Global Constipation Treatment Market Revenue (US$ Mn) and Y-o-Y Growth (%), by Chloride Channel Activator, 2015–2025
Figure 13: Global Constipation Treatment Market Revenue (US$ Mn) and Y-o-Y Growth (%), by PAMORA 2015–2025
Figure 14: Global Constipation Treatment Market Revenue (US$ Mn) and Y-o-Y Growth (%), by GC-C Agonists, 2015–2025
Figure 15: Global Constipation Treatment Market Revenue (US$ Mn) and Y-o-Y Growth (%), by 5-HT4 Receptor Agonists 2015–2025
Figure 16: Global Constipation Treatment Market Value Share, by Disease Type, 2016 and 2025
Figure 17: Global Constipation Treatment Market Attractiveness, by Disease Type, 2017–2025
Figure 18: Global Constipation Treatment Market Revenue (US$ Mn) and Y-o-Y Growth (%), by CIC, 2015–2025
Figure 19: Global Constipation Treatment Market Revenue (US$ Mn) and Y-o-Y Growth (%), by IBS-C, 2015–2025
Figure 20: Global Constipation Treatment Market Revenue (US$ Mn) and Y-o-Y Growth (%), by OIC, 2015–2025
Figure 21: Global Constipation Treatment Market Value Share, by Distribution Channel, 2016 and 2025
Figure 22: Global Constipation Treatment Market Attractiveness, by Distribution Channel, 2017–2025
Figure 23: Global Constipation Treatment Market Revenue (US$ Mn) and Y-o-Y Growth (%), by Hospital Pharmacies, 2015–2025
Figure 24: Global Constipation Treatment Market Revenue (US$ Mn) and Y-o-Y Growth (%), by Retail Pharmacies, 2015–2025
Figure 25: Global Constipation Treatment Market Revenue (US$ Mn) and Y-o-Y Growth (%), by Online Pharmacies, 2015–2025
Figure 26: Global Constipation Treatment Market Value Share, by Region, 2017 and 2025
Figure 27: Global Constipation Treatment Market Attractiveness, by Region, 2017–2025
Figure 28: North America Constipation Treatment Market Size (US$ Mn) and Y-o-Y Growth (%) Forecast, 2017–2025
Figure 29: North America Constipation Treatment Market Value Share Analysis, by Therapeutic Option, 2016 and 2025
Figure 30: North America Constipation Treatment Market Value Share Analysis, by Disease Type, 2016 and 2025
Figure 31: North America Constipation Treatment Market Value Share Analysis, by Distribution Channel, 2016 and 2025
Figure 32: North America Constipation Treatment Market Value Share Analysis, by Country, 2016 and 2025
Figure 33: North America Constipation Treatment Market Attractiveness Analysis, by Therapeutic Option
Figure 34: North America Constipation Treatment Market Attractiveness Analysis, by Disease Type
Figure 35: North America Constipation Treatment Market Attractiveness Analysis, by Distribution Channel
Figure 36: North America Constipation Treatment Market Attractiveness Analysis, by Country
Figure 37: Europe Constipation Treatment Market Size (US$ Mn) and Y-o-Y Growth (%) Forecast, 2017–2025
Figure 38: Europe Constipation Treatment Market Value Share Analysis, by Therapeutic Option, 2016 and 2025
Figure 39: Europe Constipation Treatment Market Value Share Analysis, by Disease Type, 2016 and 2025
Figure 40: Europe Constipation Treatment Market Value Share Analysis, by Distribution Channel, 2016 and 2025
Figure 41: Europe Constipation Treatment Market Value Share Analysis, by Country/Sub-region, 2016 and 2025
Figure 42: Europe Constipation Treatment Market Attractiveness Analysis, by Therapeutic Option
Figure 43: Europe Constipation Treatment Market Attractiveness Analysis, by Disease Type
Figure 44: Europe Constipation Treatment Market Attractiveness Analysis, by Distribution Channel
Figure 45: Europe Constipation Treatment Market Attractiveness Analysis, by Country/Sub-region
Figure 46: Asia Pacific Constipation Treatment Market Size (US$ Mn) and Y-o-Y Growth (%) Forecast, 2017–2025
Figure 47: Asia Pacific Constipation Treatment Market Value Share Analysis, by Therapeutic Option, 2016 and 2025
Figure 48: Asia Pacific Constipation Treatment Market Value Share Analysis, by Disease Type, 2016 and 2025
Figure 49: Asia Pacific Constipation Treatment Market Value Share Analysis, by Distribution Channel, 2016 and 2025
Figure 50: Asia Pacific Constipation Treatment Market Value Share Analysis, by Country/Sub-region, 2016 and 2025
Figure 51: Asia Pacific Constipation Treatment Market Attractiveness Analysis, by Therapeutic Option
Figure 52: Asia Pacific Constipation Treatment Market Attractiveness Analysis, by Disease Type
Figure 53: Asia Pacific Constipation Treatment Market Attractiveness Analysis, by Distribution Channel
Figure 54: Asia Pacific Constipation Treatment Market Attractiveness Analysis, by Country
Figure 55: Latin America Constipation Treatment Market Size (US$ Mn) and Y-o-Y Growth (%) Forecast, 2017–2025
Figure 56: Latin America Constipation Treatment Market Value Share Analysis, by Therapeutic Option, 2016 and 2025
Figure 57: Latin America Constipation Treatment Market Value Share Analysis, by Disease Type, 2016 and 2025
Figure 58: Latin America Constipation Treatment Market Value Share Analysis, by Distribution Channel, 2016 and 2025
Figure 59: Latin America Constipation Treatment Market Value Share Analysis, by Country/Sub-region, 2016 and 2025
Figure 60: Latin America Constipation Treatment Market Attractiveness Analysis, by Therapeutic Option
Figure 61: Latin America Constipation Treatment Market Attractiveness Analysis, by Disease Type
Figure 62: Latin America Constipation Treatment Market Attractiveness Analysis, by Distribution Channel
Figure 63: Latin America Constipation Treatment Market Attractiveness Analysis, by Country/Sub-region
Figure 64: Middle East & Africa Constipation Treatment Market Size (US$ Mn) and Y-o-Y Growth (%) Forecast, 2017–2025
Figure 65: Middle East & Africa Constipation Treatment Market Value Share Analysis, by Therapeutic Option, 2016 and 2025
Figure 66: Middle East & Africa Constipation Treatment Market Value Share Analysis, by Disease Type, 2016 and 2025
Figure 67: Middle East & Africa Constipation Treatment Market Value Share Analysis, by Distribution Channel, 2016 and 2025
Figure 68: Middle East & Africa Constipation Treatment Market Value Share Analysis, by Country/Sub-region, 2016 and 2025
Figure 69: Middle East & Africa Constipation Treatment Market Attractiveness Analysis, by Therapeutic Option
Figure 70: Middle East & Africa Constipation Treatment Market Attractiveness Analysis, by Disease Type
Figure 71: Middle East & Africa Constipation Treatment Market Attractiveness Analysis, by Distribution Channel
Figure 72: Middle East & Africa Constipation Treatment Market Attractiveness Analysis, by Country/Sub-region
Figure 73: CIS Constipation Treatment Market Size (US$ Mn) and Y-o-Y Growth (%) Forecast, 2017–2025
Figure 74: CIS Constipation Treatment Market Value Share Analysis, by Therapeutic Option, 2016 and 2025
Figure 75: CIS Constipation Treatment Market Value Share Analysis, by Disease Type, 2016 and 2025
Figure 76: CIS Constipation Treatment Market Value Share Analysis, by Distribution Channel, 2016 and 2025
Figure 77: CIS Constipation Treatment Market Value Share Analysis, by Country/Sub-region, 2016 and 2025
Figure 78: CIS Constipation Treatment Market Attractiveness Analysis, by Therapeutic Option
Figure 79: CIS Constipation Treatment Market Attractiveness Analysis, by Disease Type
Figure 80: CIS Constipation Treatment Market Attractiveness Analysis, by Distribution Channel
Figure 81: CIC Constipation Treatment Market Attractiveness Analysis, by Country/Sub-region
Copyright © Transparency Market Research, Inc. All Rights reserved
Trust Online

Constipation Treatment Market