
Reports
Reports
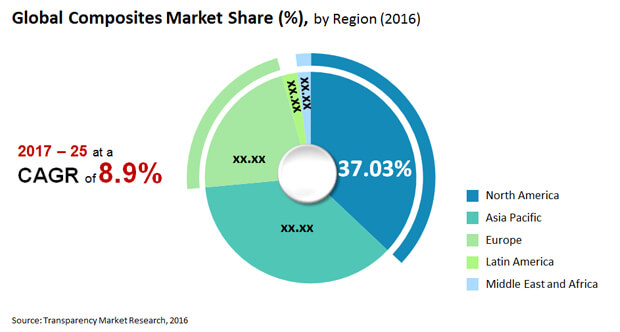
The future of the composites market appears promising, with prospects in aerospace, automotive and transportation, construction, wind energy, marine, and electrical and electronics, among others. The global composites market is expected to reach US$ 101.8773 billion, expanding at a CAGR of 8.9% from 2017 to 2025 (forecast period). Increasing demand for lightweight materials in the aerospace and automotive industries are the primary factors driving the composites market.
Carbon fiber reinforced plastics (CFRPs) are among the most popular products in the worldwide composites market due to features such as excellent tensile strength, fatigue resistance, and improved modulus. The CFRP has a wide range of applications in aircraft and component manufacturing due to its improved performance under harsh circumstances. The industry is embracing these composite materials to meet the demand for lighter aircraft with lower fuel consumption. CFRPs are the main revenue generators for the participants operating in the global composites market due to their strong demand in the aircraft manufacturing sector. In terms of revenue, the CFPR segment is projected to generate US$ 10276.2 million by the end of 2025, providing growth opportunities for the participants.
Composite materials have several applications in the automotive and transportation segment due to numerous benefits such as weight-to-strength advantage and reusability. Composites are used in the manufacture of cars, motorbikes, and cycles. The exhilarating sense of speed in numerous sports vehicles is accomplished by the use of long-lasting and lightweight composite materials such as carbon fiber. Composites are used to make the chassis of several two-wheelers and cycles. Moreover, the growing electrification of vehicles to replace traditional fuels has greatly expanded the use of composites in the automotive industry. Due to the widespread usage of composite materials, the segment is projected to outperform all other segments in the global composites market. The segment's dominance is also a result of the use of novel composite materials in automobile manufacture, which can increase a vehicle's fuel efficiency.
Several studies have shown that lowering the weight of the vehicle by 10% can increase the economy by 8%. Businesses that replace traditional cast iron and steel components with lightweight materials like glass fiber polymer can immediately enhance vehicle effectiveness by 50%. As a consequence, many manufacturers are using composites materials in their vehicles, which is fueling the expansion of the segment in the global composites market.
The manufacturing resources become prohibitively expensive owing to the long cycle time necessary to create composite materials. Due to this, the price of carbon and glass fibers that are essential in the manufacturing of composite materials also increases. The high cost of manufacturing materials is likely to stymie the expansion of the global composites market from 2017 to 2025. However, in collaboration with composite material manufacturers, numerous automotive OEMs are working on creating new methods and technologies that can produce composite materials faster. This is expected to reduce the costs associated with the manufacture of composite materials and further support the composites market growth during the forecast period.
To remain competitive in the global composites market, leading companies have employed a number of business strategies, including capacity growth, company expansion, partnerships, mergers and acquisitions, and application development. Key industry players are likely to maintain their market position by releasing innovative products and increasing their product portfolio.
Key players operating in the global composites market are The Quadrant Group of Companies, Hexcel Corporation, Owens Corning, TPI Composites, Inc, Fokker Aerostructures, Faurecia, Performance Composites Inc., Toray Industries, APPLIED POLERAMIC INC., KINECO, HITCO Carbon Composites, Inc., VELLO NORDIC AS, Hexagon Composites, Enduro Composites, Inc., Teijin Limited, Creative Composites Ltd., BGF Industries, Inc., Kangde Xin Composite Material Group Co., Ltd., PLASAN CARBON COMPOSITES, FACC AG, Premium Aerotec, COTESA GmbH, Wethje Carbon Composites, Akiet B.V., Fiberdur GmbH & Co. KG, and FILL GESELLSCHAFT M.B.H.
Composites Market is expected to reach US$ 54561.7 million by 2025
Composites Market is estimated to rise at a CAGR of 8.9% during forecast period
Increasing demand for lightweight materials in various industries such as aerospace, defense, and automobile sectors are the key factors driving the growth of Composites Market
Key players operating in the global composites market are The Quadrant Group of Companies, Hexcel Corporation, Owens Corning, TPI Composites, Inc, Fokker Aerostructures, Faurecia, Performance Composites Inc., Toray Industries, APPLIED POLERAMIC INC., KINECO, HITCO Carbon Composites, Inc., VELLO NORDIC AS, Hexagon Composites, Enduro Composites, Inc., Teijin Limited, Creative Composites Ltd., BGF Industries, Inc., Kangde Xin Composite Material Group Co., Ltd., PLASAN CARBON COMPOSITES, FACC AG, Pr
Automotive & Transportation, Construction, Aerospace & Defense, Electrical & Electronics, Marine & Oil & Gas are the application segments in the Composites Market
1. Preface
1.1. Report Scope and Market Segmentation
1.2. Research Highlights
2. Assumptions and Research Methodology
2.1. Assumptions and Acronyms Used
2.2. Research Methodology
3. Executive Summary
3.1. Market Size, Indicative (US$ Mn)
3.2. Top 3 Trends
4. Market Overview
4.1. Composites Market Overview
4.2. Key Industry Developments
4.3. Market Indicators
4.4. Drivers and Restraints Analysis
4.4.1. Drivers
4.4.2. Restraints
4.4.3. Opportunities
4.5. Global Composites Market Analysis and Forecast
4.6. Composites Market - Global Supply Demand Scenario
4.7. Porter’s Analysis
4.7.1. Threat of Substitutes
4.7.2. Bargaining Power of Buyers
4.7.3. Bargaining Power of Suppliers
4.7.4. Threat of New Entrants
4.7.5. Degree of Competition
4.8. Value Chain Analysis
4.9. Future of Composites in Drill Pipes
5. Composites Market Analysis, by Product
5.1. Key Findings
5.2. Introduction
5.3. Composites Market Value Share Analysis, by Product
5.4. Composites Market Forecast, by Product
5.4.1. CFRP, 2016 – 2025
5.4.2. GFRP, 2016 – 2025
5.4.3. Others, 2016 – 2025
5.5. Comparison Matrix
5.6. Market Attractiveness Analysis, by Product
6. Composites Market Analysis, by Technology
6.1. Key Findings
6.2. Introduction
6.3. Composites Market Value Share Analysis, by Technology
6.4. Composites Market Forecast, by Technology
6.4.1. Pultrusion Process, 2016 – 2025
6.4.2. Layup Process, 2016 – 2025
6.4.3. Filament Winding, 2016 – 2025
6.4.4. Compression Molding, 2016 – 2025
6.4.5. Injection Molding, 2016 – 2025
6.4.6. Resin Transfer Molding, 2016 – 2025
6.4.7. Others, 2016 – 2025
6.5. Market Attractiveness Analysis, by Technology
7. Composites Market Analysis, by Application
7.1. Key Findings
7.2. Introduction
7.3. Composites Market Value Share Analysis, by Application
7.4. Composites Market Forecast, by Application
7.4.1. Automotive & Transportation, 2016 – 2025
7.4.1.1. Interior
7.4.1.2. Exterior
7.4.1.3. Power Train Components
7.4.1.4. Others
7.4.2. Construction, 2016 – 2025
7.4.3. Aerospace & Defense, 2016 – 2025
7.4.4. Electrical & Electronics, 2016 – 2025
7.4.5. Marine & Oil & Gas, 2016 – 2025
7.4.5.1. Pipes
7.4.5.2. Others
7.4.6. Wind Energy, 2016 – 2025
7.4.7. Others, 2016 – 2025
7.5. Comparison Matrix
7.6. Market Attractiveness Analysis, by Application
8. Composites Market Analysis, by Region
8.1. Composites Market Value Share Analysis, by Region
8.2. Composites Market Forecast, by Region
8.2.1. North America
8.2.2. Europe
8.2.3. Asia Pacific
8.2.4. Latin America
8.2.5. Middle East & Africa
8.3. Market Attractiveness Analysis, by Region
9. North America Composites Market Analysis
9.1. Key Findings
9.2. North America Composites Market Overview
9.3. North America Composites Market Value Share Analysis, by Product
9.4. North America Composites Market Forecast, by Product
9.4.1. CFRP, 2016 – 2025
9.4.2. GFRP, 2016 – 2025
9.4.3. Others, 2016 – 2025
9.5. North America Composites Market Value Share Analysis, by Technology
9.6. North America Composites Market Forecast, by Technology
9.6.1. Pultrusion Process, 2016 – 2025
9.6.2. Layup Process, 2016 – 2025
9.6.3. Filament Winding, 2016 – 2025
9.6.4. Compression Molding, 2016 – 2025
9.6.5. Injection Molding, 2016 – 2025
9.6.6. Resin Transfer Molding, 2016 – 2025
9.6.7. Others, 2016 – 2025
9.7. North America Composites Market Value Share Analysis, by Application
9.8. North America Composites Market Forecast, by Application
9.8.1. Automotive & Transportation, 2016 – 2025
9.8.1.1. Interior
9.8.1.2. Exterior
9.8.1.3. Power Train Components
9.8.1.4. Others
9.8.2. Construction, 2016 – 2025
9.8.3. Aerospace & Defense, 2016 – 2025
9.8.4. Electrical & Electronics, 2016 – 2025
9.8.5. Marine & Oil & Gas, 2016 – 2025
9.8.5.1. Pipes
9.8.5.2. Others
9.8.6. Wind Energy, 2016 – 2025
9.8.7. Others, 2016 – 2025
9.9. North America Composites Market Value Share Analysis, by Country
9.10. North America Composites Market Forecast, by Country
9.10.1. U.S., 2016 – 2025
9.10.2. Canada, 2016 – 2025
9.11. North America Composites Market Attractiveness Analysis
9.11.1. By Product
9.11.2. By Application
10. Europe Composites Market Analysis
10.1. Key Findings
10.2. Europe Composites Market Overview
10.3. Europe Composites Market Value Share Analysis, by Product
10.4. Europe Composites Market Forecast, by Product
10.4.1. CFRP, 2016 – 2025
10.4.2. GFRP, 2016 – 2025
10.4.3. Others, 2016 – 2025
10.5. Europe Composites Market Value Share Analysis, by Technology
10.6. Europe Composites Market Forecast, by Technology
10.6.1. Pultrusion Process, 2016 – 2025
10.6.2. Layup Process, 2016 – 2025
10.6.3. Filament Winding, 2016 – 2025
10.6.4. Compression Molding, 2016 – 2025
10.6.5. Injection Molding, 2016 – 2025
10.6.6. Resin Transfer Molding, 2016 – 2025
10.6.7. Others, 2016 – 2025
10.7. Europe Composites Market Value Share Analysis, by Application
10.8. Europe Composites Market Forecast, by Application
10.8.1. Automotive & Transportation, 2016 – 2025
10.8.1.1. Interior
10.8.1.2. Exterior
10.8.1.3. Power Train Components
10.8.1.4. Others
10.8.2. Construction, 2016 – 2025
10.8.3. Aerospace & Defense, 2016 – 2025
10.8.4. Electrical & Electronics, 2016 – 2025
10.8.5. Marine & Oil & Gas, 2016 – 2025
10.8.5.1. Pipes
10.8.5.2. Others
10.8.6. Wind Energy, 2016 – 2025
10.8.7. Others, 2016 – 2025
10.9. Europe Composites Market Value Share Analysis, by Country
10.10. Europe Composites Market Forecast, by Country
10.10.1. France, 2016 – 2025
10.10.2. Germany, 2016 – 2025
10.10.3. Italy, 2016 – 2025
10.10.4. Spain, 2016 – 2025
10.10.5. U.K., 2016 – 2025
10.10.6. Rest of Europe, 2016 – 2025
10.11. Europe Composites Market Attractiveness Analysis
10.11.1. By Product
10.11.2. By Application
11. Asia Pacific Composites Market Analysis
11.1. Key Findings
11.2. Asia Pacific Composites Market Overview
11.3. Asia Pacific Composites Market Value Share Analysis, by Product
11.4. Asia Pacific Composites Market Forecast, by Product
11.4.1. CFRP, 2016 – 2025
11.4.2. GFRP, 2016 – 2025
11.4.3. Others, 2016 – 2025
11.5. Asia Pacific Composites Market Value Share Analysis, by Technology
11.6. Asia Pacific Composites Market Forecast, by Technology
11.6.1. Pultrusion Process, 2016 – 2025
11.6.2. Layup Process, 2016 – 2025
11.6.3. Filament Winding, 2016 – 2025
11.6.4. Compression Molding, 2016 – 2025
11.6.5. Injection Molding, 2016 – 2025
11.6.6. Resin Transfer Molding, 2016 – 2025
11.6.7. Others, 2016 – 2025
11.7. Asia Pacific Composites Market Value Share Analysis, by Application
11.8. Asia Pacific Composites Market Forecast, by Application
11.8.1. Automotive & Transportation, 2016 – 2025
11.8.1.1. Interior
11.8.1.2. Exterior
11.8.1.3. Power Train Components
11.8.1.4. Others
11.8.2. Construction, 2016 – 2025
11.8.3. Aerospace & Defense, 2016 – 2025
11.8.4. Electrical & Electronics, 2016 – 2025
11.8.5. Marine & Oil & Gas, 2016 – 2025
11.8.5.1. Pipes
11.8.5.2. Others
11.8.6. Wind Energy, 2016 – 2025
11.8.7. Others, 2016 – 2025
11.9. Asia Pacific Composites Market Value Share Analysis, by Country
11.10. Asia Pacific Composites Market Forecast, by Country
11.10.1. China, 2016 – 2025
11.10.2. India, 2016 – 2025
11.10.3. Japan, 2016 – 2025
11.10.4. ASEAN, 2016 – 2025
11.10.5. Rest of Asia Pacific, 2016 – 2025
11.11. Asia Pacific Composites Market Attractiveness Analysis
11.11.1. By Product
11.11.2. By Application
12. Latin America Composites Market Analysis
12.1. Key Findings
12.2. Latin America Composites Market Overview
12.3. Latin America Composites Market Value Share Analysis, by Product
12.4. Latin America Composites Market Forecast, by Product
12.4.1. CFRP, 2016 – 2025
12.4.2. GFRP, 2016 – 2025
12.4.3. Others, 2016 – 2025
12.5. Latin America Composites Market Value Share Analysis, by Technology
12.6. Latin America Composites Market Forecast, by Technology
12.6.1. Pultrusion Process, 2016 – 2025
12.6.2. Layup Process, 2016 – 2025
12.6.3. Filament Winding, 2016 – 2025
12.6.4. Compression Molding, 2016 – 2025
12.6.5. Injection Molding, 2016 – 2025
12.6.6. Resin Transfer Molding, 2016 – 2025
12.6.7. Others, 2016 – 2025
12.7. Latin America Composites Market Value Share Analysis, by Application
12.8. Latin America Composites Market Forecast, by Application
12.8.1. Automotive & Transportation, 2016 – 2025
12.8.1.1. Interior
12.8.1.2. Exterior
12.8.1.3. Power Train Components
12.8.1.4. Others
12.8.2. Construction, 2016 – 2025
12.8.3. Aerospace & Defense, 2016 – 2025
12.8.4. Electrical & Electronics, 2016 – 2025
12.8.5. Marine & Oil & Gas, 2016 – 2025
12.8.5.1. Pipes
12.8.5.2. Others
12.8.6. Wind Energy, 2016 – 2025
12.8.7. Others, 2016 – 2025
12.9. Latin America Composites Market Value Share Analysis, by Country
12.10. Latin America Composites Market Forecast, by Country
12.10.1. Brazil, 2016 – 2025
12.10.2. Mexico, 2016 – 2025
12.10.3. Rest of Latin America, 2016 – 2025
12.11. Latin America Composites Market Attractiveness Analysis
12.11.1. By Product
12.11.2. By Application
13. Middle East & Africa Composites Market Analysis
13.1. Key Findings
13.2. Middle East & Africa Composites Market Overview
13.3. Middle East & Africa Composites Market Value Share Analysis, by Product
13.4. Middle East & Africa Composites Market Forecast, by Product
13.4.1. CFRP, 2016 – 2025
13.4.2. GFRP, 2016 – 2025
13.4.3. Others, 2016 – 2025
13.5. Middle East & Africa Composites Market Value Share Analysis, by Technology
13.6. Middle East & Africa Composites Market Forecast, by Technology
13.6.1. Pultrusion Process, 2016 – 2025
13.6.2. Layup Process, 2016 – 2025
13.6.3. Filament Winding, 2016 – 2025
13.6.4. Compression Molding, 2016 – 2025
13.6.5. Injection Molding, 2016 – 2025
13.6.6. Resin Transfer Molding, 2016 – 2025
13.6.7. Others, 2016 – 2025
13.7. Middle East & Africa Composites Market Value Share Analysis, by Application
13.8. Middle East & Africa Composites Market Forecast, by Application
13.8.1. Automotive & Transportation, 2016 – 2025
13.8.1.1. Interior
13.8.1.2. Exterior
13.8.1.3. Power Train Components
13.8.1.4. Others
13.8.2. Construction, 2016 – 2025
13.8.3. Aerospace & Defense, 2016 – 2025
13.8.4. Electrical & Electronics, 2016 – 2025
13.8.5. Marine & Oil & Gas, 2016 – 2025
13.8.5.1. Pipes
13.8.5.2. Others
13.8.6. Wind Energy, 2016 – 2025
13.8.7. Others, 2016 – 2025
13.9. Middle East & Africa Composites Market Value Share Analysis, by Country
13.10. Middle East & Africa Composites Market Forecast, by Country
13.10.1. GCC, 2016 – 2025
13.10.2. South Africa, 2016 – 2025
13.10.3. Rest of Middle East & Africa, 2016 – 2025
13.11. Middle East & Africa Composites Market Attractiveness Analysis
13.11.1. By Product
13.11.2. By Application
14. Competition Landscape
14.1. Competition Matrix
14.2. Composites Market Share Analysis by Company (2016)
14.3. Company Profiles
14.3.1. Hexcel Corporation
14.3.1.1. Company Description
14.3.1.2. Business Overview
14.3.1.3. SWOT Analysis
14.3.1.4. Financial Details
14.3.1.5. Strategic Overview
14.3.2. TPI Composites, Inc
14.3.2.1. Company Description
14.3.2.2. Business Overview
14.3.2.3. SWOT Analysis
14.3.2.4. Financial Details
14.3.2.5. Strategic Overview
14.3.3. Owens Corning
14.3.3.1. Company Description
14.3.3.2. Business Overview
14.3.3.3. SWOT Analysis
14.3.3.4. Financial Details
14.3.3.5. Strategic Overview
14.3.4. Teijin Limited
14.3.4.1. Company Description
14.3.4.2. Business Overview
14.3.4.3. SWOT Analysis
14.3.4.4. Financial Details
14.3.4.5. Strategic Overview
14.3.5. Faurecia
14.3.5.1. Company Description
14.3.5.2. Business Overview
14.3.5.3. SWOT Analysis
14.3.5.4. Financial Details
14.3.6. Performance Composites Inc.
14.3.6.1. Company Description
14.3.6.2. Business Overview
14.3.7. Excel Industries Limited
14.3.7.1. Company Description
14.3.7.2. Business Overview
14.3.7.3. Strategic Overview
14.3.8. Enduro Composites, Inc.
14.3.8.1. Company Description
14.3.8.2. Business Overview
14.3.9. Wethje Carbon Composites
14.3.9.1. Company Description
14.3.9.2. Business Overview
14.3.10. VELLO NORDIC AS
14.3.10.1. Company Description
14.3.10.2. Business Overview
14.3.11. Fiberdur GmbH & Co. KG
14.3.11.1. Company Description
14.3.11.2. Business Overview
14.3.12. Akiet B.V.
14.3.12.1. Company Description
14.3.12.2. Business Overview
14.3.13. FILL GESELLSCHAFT M.B.H.
14.3.13.1. Company Description
14.3.13.2. Business Overview
14.3.14. Toray Industries
14.3.14.1. Company Description
14.3.14.2. Business Overview
14.3.14.3. SWOT Analysis
14.3.14.4. Financial Details
14.3.14.5. Strategic Overview
14.3.15. APPLIED POLERAMIC INC.
14.3.15.1. Company Description
14.3.15.2. Business Overview
14.3.15.3. Strategic Overview
14.3.16. Hexagon Composites
14.3.16.1. Company Description
14.3.16.2. Business Overview
14.3.16.3. SWOT Analysis
14.3.16.4. Financial Details
14.3.16.5. Strategic Overview
14.3.17. KINECO
14.3.17.1. Company Description
14.3.17.2. Business Overview
14.3.17.3. Strategic Overview
14.3.18. Creative Composites Ltd.
14.3.18.1. Company Description
14.3.18.2. Business Overview
14.3.18.3. Strategic Overview
14.3.19. HITCO Carbon Composites, Inc.
14.3.19.1. Company Description
14.3.19.2. Business Overview
14.3.19.3. Strategic Overview
14.3.20. The Quadrant Group of Companies
14.3.20.1. Company Description
14.3.20.2. Business Overview
14.3.20.3. Strategic Overview
14.3.21. Kangde Xin Composite Material Group Co., Ltd
14.3.21.1. Company Description
14.3.21.2. Business Overview
14.3.21.3. Strategic Overview
14.3.22. BGF Industries, Inc.
14.3.22.1. Company Description
14.3.22.2. Business Overview
14.3.22.3. Strategic Overview
14.3.23. FACC AG
14.3.23.1. Company Description
14.3.23.2. Business Overview
14.3.23.3. SWOT Analysis
14.3.23.4. Financial Details
14.3.23.5. Strategic Overview
14.3.24. Premium Aerotec
14.3.24.1. Company Description
14.3.24.2. Business Overview
14.3.24.3. Strategic Overview
14.3.25. Fokker Aerostructures
14.3.25.1. Company Description
14.3.25.2. Business Overview
14.3.25.3. Strategic Overview
14.3.26. COTESA GmbH
14.3.26.1. Company Description
14.3.26.2. Business Overview
14.3.26.3. Strategic Overview
14.3.27. PLASAN CARBON COMPOSITES
14.3.27.1. Company Description
14.3.27.2. Business Overview
14.3.27.3. Strategic Overview
15. Key Takeaways
List of Tables
Table 1: Global Composites Market Size (US$ Mn) and Volume (Tons) Forecast, by Product, 2016–2025
Table 2: Global Composites Market Size (US$ Mn) and Volume (Tons) Forecast, by Product, 2016–2025
Table 3: Global Composites Market Size (US$ Mn) and Volume (Tons) Forecast, by Technology, 2016 - 2025
Table 4: Global Composites Market Size (US$ Mn) and Volume (Tons) Forecast, by Technology, 2016–2025
Table 5: Global Composites Market Size (US$ Mn) and Volume (Kilo Tons) Forecast, by Application, 2016–2025
Table 6: Globe Composites Market Size (US$ Mn) and Volume (Kilo Tons) Forecast, for Automotive & Transportation Application, 2016–2025
Table 7: Globe Composites Market Size (US$ Mn) and Volume (Kilo Tons) Forecast, for Marine and Oil & Gas Application, 2016–2025
Table 8: Global Composites Market Size (US$ Mn) and Volume (Kilo Tons) Forecast, by Region, 2016–2025
Table 9: North America Composites Market Size (US$ Mn) and Volume (Kilo Tons) Forecast, by Product, 2016–2025
Table 10: North America Composites Market Size (US$ Mn) and Volume (Kilo Tons) Forecast, by PMC Segment, 2016–2025
Table 11: North America Composites Market Size (US$ Mn) and Volume (Kilo Tons) Forecast, by Application, 2016–2025
Table 12: North America Composites Market Size (US$ Mn) and Volume (Kilo Tons) Forecast, by Marine and Oil & Gas Segment, 2016–2025
Table 13: North America Composites Market Size (US$ Mn) and Volume (Kilo Tons) Forecast, by Automotive & Transportation Segment, 2016–2025
Table 14: North America Composites Market Size (US$ Mn) and Volume (Kilo Tons) Forecast, by Country, 2015–2024
Table 15: Europe Composites Market Size (US$ Mn) and Volume (Kilo Tons) Forecast, by Product, 2016–2025
Table 16: Europe Composites Market Size (US$ Mn) and Volume (Kilo Tons) Forecast, by Product, PMC, 2016–2025
Table 17: Europe Composites Market Size (US$ Mn) and Volume (Kilo Tons) Forecast, by Application, 2016–2025
Table 18: Europe Composites Market Size (US$ Mn) and Volume (Kilo Tons) Forecast, for Marine and Oil & Gas Application, 2016–2025
Table 19: Europe Composites Market Size (US$ Mn) and Volume (Kilo Tons) Forecast, for Automotive & Transportation Application, 2016–2025
Table 20: Europe Composites Market Size (US$ Mn) and Volume (Kilo Tons) Forecast, by Country, 2015–2024
Table 21: Asia Pacific Composites Market Size (US$ Mn) and Volume (Kilo Tons) Forecast, by Product, 2016–2025
Table 22: Asia Pacific Composites Market Size (US$ Mn) and Volume (Kilo Tons) Forecast, by Product, PMC, 2016–2025
Table 23: Asia Pacific Composites Market Size (US$ Mn) and Volume (Kilo Tons) Forecast, by Application, 2016–2025
Table 24: Asia Pacific Composites Market Size (US$ Mn) and Volume (Kilo Tons) Forecast, for Marine and Oil & Gas Application, 2016–2025
Table 25: Asia Pacific Composites Market Size (US$ Mn) and Volume (Kilo Tons) Forecast, for Automotive & Transportation Application, 2016–2025
Table 26: Asia Pacific Composites Market Size (US$ Mn) and Volume (Kilo Tons) Forecast, by Country, 2015–2024
Table 27: Latin America Composites Market Size (US$ Mn) and Volume (Kilo Tons) Forecast, by Product Type, 2016–2025
Table 28: Latin America Composites Market Size (US$ Mn) and Volume (Kilo Tons) Forecast, by Product, PMC, 2016–2025
Table 29: Latin America Composites Market Size (US$ Mn) and Volume (Kilo Tons) Forecast, by Application, 2016–2025
Table 30: Latin America Composites Market Size (US$ Mn) and Volume (Kilo Tons) Forecast, for Marine and Oil & Gas Application, 2016–2025
Table 31: Latin America Composites Market Size (US$ Mn) and Volume (Kilo Tons) Forecast, for Automotive & Transportation Application, 2016–2025
Table 32: Latin America Composites Market Size (US$ Mn) and Volume (Kilo Tons) Forecast, by Country, 2015–2024
Table 33: Middle East & Africa Composites Market Size (US$ Mn) and Volume (Kilo Tons) Forecast, by Product, 2016–2025
Table 34: Middle East & Africa Composites Market Size (US$ Mn) and Volume (Kilo Tons) Forecast, by Product, PMC, 2016–2025
Table 35: Middle East & Africa Composites Market Size (US$ Mn) and Volume (Kilo Tons) Forecast, by Application, 2016–2025
Table 36: Middle East & Africa Composites Market Size (US$ Mn) and Volume (Kilo Tons) Forecast, for Marine and Oil & Gas Application, 2016–2025
Table 37: Middle East & Africa Composites Market Size (US$ Mn) and Volume (Kilo Tons) Forecast, for Automotive & Transportation Application, 2016–2025
Table 38: Middle East & Africa Composites Market Size (US$ Mn) and Volume (Kilo Tons) Forecast, by Country, 2015–2024
List of Figures
Figure 1: Global Composites Market Size (US$ Mn) and Volume (Kilo Tons) Forecast, 2016–2025
Figure 2: Global Composites Average Selling Prices, by Product Type (US$/ton), 2016
Figure 3: Global Composites Market Value Share Analysis, by Product, 2016 and 2025
Figure 4: Global Composites Market Value Share Analysis, by Product, 2016 and 2025
Figure 5: Composites Market Attractiveness Analysis, by Product
Figure 6: Composites Market Attractiveness Analysis, by Product
Figure 7: Global Composites Market Value Share Analysis, by Technology, 2016 and 2025
Figure 8: Global Composites Market Attractiveness Analysis, by Technology
Figure 9: Global Composites Market Value Share Analysis, by Application, 2016 and 2025
Figure 10: Composites Market, for Automotive & Transportation
Figure 11: Composites Market, for Construction
Figure 12: Composites Market, for Aerospace & Defense
Figure 13: Composites Market, for Electrical & Electronics
Figure 14: Composites Market, for Marine and Oil & Gas
Figure 15: Composites Market, for Wind Energy
Figure 16: Composites Market, for Others
Figure 17: Composites Market Attractiveness Analysis,
Figure 18: Global Composites Market Value Share Analysis, by Region, 2016 and 2025
Figure 19: Composites Market Attractiveness Analysis,
Figure 20: North America Composites Market Size (US$ Mn) and Volume (Kilo Tons) Forecast, 2016–2025
Figure 21: North America Composites Market Attractiveness Analysis, by Country
Figure 22: North America Composites Market Value Share Analysis, by Product, 2016 and 2025
Figure 23: North America Composites Market Value Share Analysis, by PMC Segment, 2016 and 2025
Figure 24: North America Composites Market Value Share Analysis, by Application, 2016 and 2025
Figure 25: North America Composites Market Value Share Analysis, by Country, 2016 and 2025
Figure 26: Europe Composites Market Size (US$ Mn) and Volume (Kilo Tons) Forecast, 2016–2025
Figure 27: Europe Composites Market Attractiveness Analysis, by Country, 2016
Figure 28: Europe Composites Market Value Share Analysis, by Product Type, 2016 and 2025
Figure 29: Europe Composites Market Value Share Analysis, by Product Type, 2016 and 2025
Figure 30: Europe Composites Market Value Share Analysis, by Application, 2016 and 2025
Figure 31: Europe Composites Market Value Share Analysis, by Country, 2016 and 2025
Figure 32: Asia Pacific Composites Market Size (US$ Mn) and Volume (Kilo Tons) Forecast, 2016–2025
Figure 33: Asia Pacific Composites Market Attractiveness Analysis, by Country
Figure 34: Asia Pacific Composites Market Value Share Analysis, by Product Type, 2016 and 2025
Figure 35: Asia Pacific Composites Market Value Share Analysis, by Product Type, 2016 and 2025
Figure 36: Asia Pacific Composites Market Value Share Analysis, by Application, 2016 and 2025
Figure 37: Asia Pacific Composites Market Value Share Analysis, by Country, 2016 and 2025
Figure 38: Latin America Composites Market Size (US$ Mn) and Volume (Kilo Tons) Forecast, 2016–2025
Figure 39: Latin America Composites Market Attractiveness Analysis, by Country
Figure 40: Latin America Composites Market Value Share Analysis, by Product Type, 2016 and 2025
Figure 41: Latin America Composites Market Value Share Analysis, by Product Type, 2016 and 2025
Figure 42: Latin America Composites Market Value Share Analysis, by Application, 2016 and 2025
Figure 43: Latin America Composites Market Value Share Analysis, by Country, 2016 and 2025
Figure 44: Middle East & Africa Composites Market Size (US$ Mn) and Volume (Kilo Tons) Forecast, 2016–2025
Figure 45: Middle East & Africa Composites Market Attractiveness Analysis, by Country
Figure 46: Middle East & Africa Composites Market Value Share Analysis, by Product Type, 2016 and 2025
Figure 47: Middle East & Africa Composites Market Value Share Analysis, by Product Type, 2016 and 2025
Figure 48: Middle East & Africa Composites Market Value Share Analysis, by Application, 2016 and 2025
Figure 49: Middle East & Africa Composites Market Value Share Analysis, by Country, 2016 and 2025
Copyright © Transparency Market Research, Inc. All Rights reserved
Trust Online

Composites Market