
Reports
Reports
With increasing number of animals being adopted as pets, globally, rising awareness regarding veterinary issues and improved quality of treatment & therapy for animals have contributed significantly to the expansion of the companion animal diagnostics market. Within the larger companion animal diagnostics market, point-of-care testing is a rapidly growing sector, the popularity of which can be attributed to the lab-like facilities that are offered at these centers, designed to enhance the quality of care offered to pets. This segment, which was valued at ~US$ 515 Mn in 2018, is expected to double by the end of the forecast period ending 2027.
However, retaining its place at the top of the table with the largest share of ~35% in 2018 is the veterinary reference laboratories segment. While it is expected to yield 2% of its market share by the end of the forecast period, it is set to expand at a robust pace from 2019 to 2027. The growth and popularity of this segment can be attributed to the increase in the number of laboratories for the diagnosis and effective testing of veterinary diseases, especially in developed countries, which has had a positive impact on the growth of the companion animal diagnostics market.
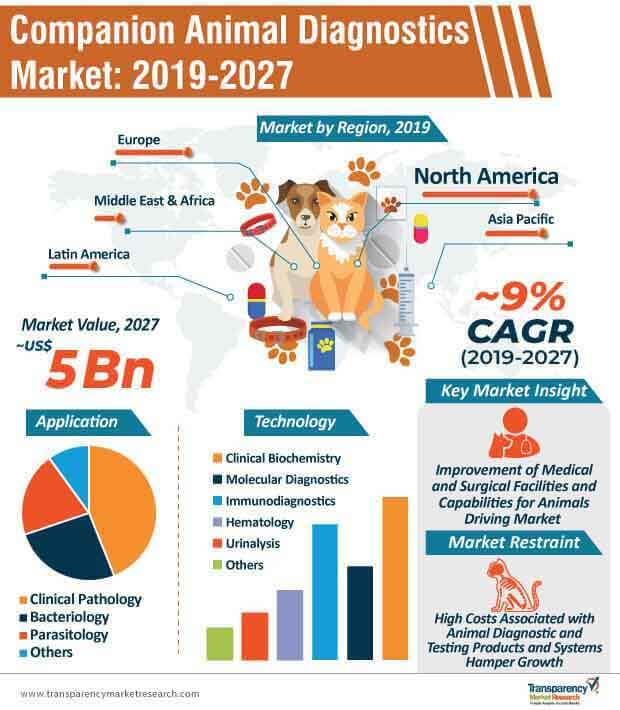
Veterinary clinical biochemistry, as a segment, accounted for around one-third of the global market for companion animal diagnostics in 2018. There has been increase in the usage of clinical biochemistry tests as the first and basic tool for the diagnosis of several illnesses. Products such as chemistry analyzers, glucose monitoring devices, and blood & gas analyzers are used for the diagnosis of a variety of diseases, the increasing incidence of which, has been a key factor driving the growth of this segment. The clinical biochemistry segment was valued at ~US$ 675 Mn in 2018, is expected to grow at a steady pace during the forecast period to double by the end of 2027.
However, the fastest-growing technology in the companion animal diagnostics market is urine analysis, which had a market value of ~US$ 200 Mn in 2018, and is expected to grow at a robust value CAGR of ~10% over the forecast period. This procedure is not necessarily favored as a basic test, but is extensively used in point-of-care centers, which contributes to the growth of the companion animal diagnostics market.
In 2018, North America accounted for two-fifth of the share of the global companion animal diagnostics market, making it the most significant region in the landscape. Revenue from North America is expected double in value by the end of 2027, as it continues to hold its place at the head of the table during the forecast period. This can be attributed to the fact that, North America has been an early adopter of new technologies, which is opening up lucrative opportunities for players in the region to diversify their product range to improve the quality of products used in companion animal diagnostics and care.
However, due to the remarkable rise in the adoption of pets in APAC, and the consequent increase in the demand for companion animal diagnostic products in the region, the market in the region is anticipated to expand the fastest at a CAGR of ~10% over the forecast period.
Analysts’ Overview
With great emphasis being placed by stakeholders on the prevention of illnesses in companion animals, and the increasing awareness of the importance of pet healthcare, there has been a significant growth in the bottom line of the companion animal diagnostics market in recent years. According to analysts at Transparency Market Research, this market is expected to grow steadily at a good pace during the forecast period, as players focusing R&D for new product development and innovation in areas of unmet needs, such as biologics and specialty pet care, are likely to realize maximum gains in the foreseeable future.
APAC is expected to present lucrative prospects for players in the companion animal diagnostics market, as the adoption of pets and spending on them continues to rise in the region. Manufacturers looking expand into this region are likely to witness profitable gains and strengthen their foothold in the global companion animal diagnostics landscape.
Global Companion Animal Diagnostics Market and Report Description
Companion Animal Diagnostics Market: Overview
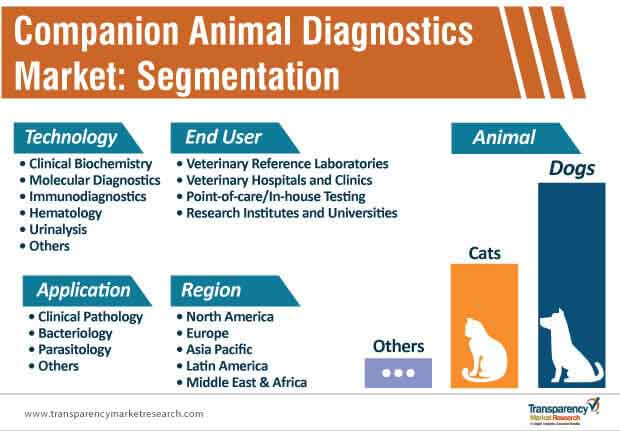
Global Companion Animal Diagnostics Market: Key Segments
Global Companion Animal Diagnostics Market: Major Players
The global companion animal diagnostics market was worth US$ 2.3 Bn and is projected to reach a value of US$ 5 Bn by the end of 2027
Companion animal diagnostics market is anticipated to grow at a CAGR of 9% during the forecast period
North America accounted for a major share of the global companion animal diagnostics market
Companion animal diagnostics market is driven by increase in the prevalence of various chronic diseases associated with companion animals has led to an increase in the number of diagnosis tests. These factors boost the clinical pathology segment in the market
Key players in the global companion animal diagnostics market include Heska Corporation, IDEXX Laboratories, Inc., Thermo Fisher Scientific, Inc., QIAGEN N.V., Zoetis, Inc., Neogen Corporation, bioMérieux SA, Randox Laboratories Ltd., and Virbac
1. Preface
1.1. Report Scope and Market Segmentation
1.2. Research Highlights
2. Assumptions and Research Methodology
2.1. Assumptions
2.2. Research Methodology
3. Executive Summary
3.1. Global Companion Animal Diagnostics Market Snapshot
4. Market Overview
4.1. Product Overview
4.2. Key Industry Events
4.3. Market Dynamics
4.4. Drivers and Restraints Snapshot Analysis
4.4.1. Drivers
4.5. Restraints
4.6. Opportunities
4.7. Global Companion Animal Diagnostics Market Revenue Projection
4.8. Global Companion Animal Diagnostics Market Outlook
5. Market Outlook
5.1. Pet Ownership Data, by Countries
5.2. Top 20 Dog and Cat Population Countries
6. Global Companion Animal Diagnostics Market Analysis, by Technology
6.1. Introduction
6.2. Global Companion Animal Diagnostics Market Value Share and Attractiveness Analysis, by Technology
6.3. Global Companion Animal Diagnostics Market Forecast, by Technology
6.3.1. Clinical Biochemistry
6.3.1.1. Clinical Chemistry Analysis
6.3.1.2. Glucose Monitoring
6.3.1.3. Blood Gas & Electrolyte Analysis
6.3.2. Molecular Diagnostics
6.3.2.1. Polymer Chain Reaction Tests
6.3.2.2. Microarrays
6.3.2.3. Others
6.3.3. Immunodiagnostics
6.3.4. Hematology
6.3.5. Urinalysis
6.3.6. Other
6.4. Global Companion Animal Diagnostics Market Analysis, by Technology
7. Global Companion Animal Diagnostics Market Analysis, by Application
7.1. Introduction
7.2. Global Companion Animal Diagnostics Market Value Share and Attractiveness Analysis, by Application
7.3. Global Companion Animal Diagnostics Market Forecast, by Application
7.3.1. Clinical Pathology
7.3.2. Bacteriology
7.3.3. Parasitology
7.3.4. Other
7.4. Global Companion Animal Diagnostics Market Analysis, by Application
8. Global Companion Animal Diagnostics Market Analysis, by Animal
8.1. Introduction
8.2. Global Companion Animal Diagnostics Market Value Share and Attractiveness Analysis, by Animal
8.3. Global Companion Animal Diagnostics Market Forecast, by Animal
8.3.1. Dog
8.3.2. Cat
8.3.3. Other
8.4. Global Companion Animal Diagnostics Market Analysis, by Animal
9. Global Companion Animal Diagnostics Market Analysis, by End User
9.1. Introduction
9.2. Global Companion Animal Diagnostics Market Value Share and Attractiveness Analysis, by End User
9.3. Global Companion Animal Diagnostics Market Forecast, by End User
9.3.1. Veterinary Reference Laboratories
9.3.2. Veterinary Hospitals and Clinics
9.3.3. Point-of-care/In-house Testing
9.3.4. Research Institutes and Universities
9.4. Global Companion Animal Diagnostics Market Analysis, by End User
10. Global Companion Animal Diagnostics Market Analysis, by Region
10.1. Global Companion Animal Diagnostics Market Scenario, by Country
10.2. Global Companion Animal Diagnostics Market Value Share and Attractiveness Analysis, by Region
10.3. Global Companion Animal Diagnostics Market Forecast, by Region
10.3.1. North America
10.3.2. Europe
10.3.3. Asia Pacific
10.3.4. Latin America
10.3.5. Middle East & Africa
11. North America Companion Animal Diagnostics Market Analysis
11.1. Key Findings
11.2. North America Companion Animal Diagnostics Market Overview
11.3. North America Companion Animal Diagnostics Market Value Share and Attractiveness Analysis, by Country
11.4. North America Companion Animal Diagnostics Market Forecast, by Country
11.4.1. U.S.
11.4.2. Canada
11.5. North America Companion Animal Diagnostics Market Value Share and Attractiveness Analysis, by Technology
11.6. North America Companion Animal Diagnostics Market Forecast, by Technology
11.6.1. Clinical Biochemistry
11.6.1.1. Clinical Chemistry Analysis
11.6.1.2. Glucose Monitoring
11.6.1.3. Blood Gas & Electrolyte Analysis
11.6.2. Molecular Diagnostics
11.6.2.1. Polymer Chain Reaction Tests
11.6.2.2. Microarrays
11.6.2.3. Others
11.6.3. Immunodiagnostics
11.6.4. Hematology
11.6.5. Urinalysis
11.6.6. Other
11.7. North America Companion Animal Diagnostics Market Value Share and Attractiveness Analysis, by Application
11.8. North America Companion Animal Diagnostics Market Forecast, by Application
11.8.1. Clinical Pathology
11.8.2. Bacteriology
11.8.3. Parasitology
11.8.4. Other
11.9. North America Companion Animal Diagnostics Market Value Share and Attractiveness Analysis, by Animal
11.10. North America Companion Animal Diagnostics Market Forecast, by Animal
11.10.1. Dog
11.10.2. Cat
11.10.3. Other
11.11. North America Companion Animal Diagnostics Market Value Share and Attractiveness Analysis, by End User
11.12. North America Companion Animal Diagnostics Market Forecast, by End User
11.12.1. Veterinary Reference Laboratories
11.12.2. Veterinary Hospitals and Clinics
11.12.3. Point-of-care/In-house Testing
11.12.4. Research Institutes and Universities
12. Europe Companion Animal Diagnostics Market Analysis
12.1. Key Findings
12.2. Europe Companion Animal Diagnostics Market Overview
12.3. Europe Companion Animal Diagnostics Market Value Share and Attractiveness Analysis, by Country/Sub-region
12.4. Europe Companion Animal Diagnostics Market Forecast, by Country/Sub-region
12.4.1. Germany
12.4.2. U.K.
12.4.3. France
12.4.4. Italy
12.4.5. Spain
12.4.6. Rest of Europe
12.5. Europe Companion Animal Diagnostics Market Value Share and Attractiveness Analysis, by Technology
12.6. Europe Companion Animal Diagnostics Market Forecast, by Technology
12.6.1. Clinical Biochemistry
12.6.1.1. Clinical Chemistry Analysis
12.6.1.2. Glucose Monitoring
12.6.1.3. Blood Gas & Electrolyte Analysis
12.6.2. Molecular Diagnostics
12.6.2.1. Polymer Chain Reaction Tests
12.6.2.2. Microarrays
12.6.2.3. Others
12.6.3. Immunodiagnostics
12.6.4. Hematology
12.6.5. Urinalysis
12.6.6. Other
12.7. Europe Companion Animal Diagnostics Market Value Share and Attractiveness Analysis, by Application
12.8. Europe Companion Animal Diagnostics Market Forecast, by Application
12.8.1. Clinical Pathology
12.8.2. Bacteriology
12.8.3. Parasitology
12.8.4. Other
12.9. Europe Companion Animal Diagnostics Market Value Share and Attractiveness Analysis, by Animal
12.10. Europe Companion Animal Diagnostics Market Forecast, by Animal
12.10.1. Dog
12.10.2. Cat
12.10.3. Other
12.11. Europe Companion Animal Diagnostics Market Value Share and Attractiveness Analysis, by End User
12.12. Europe Companion Animal Diagnostics Market Forecast, by End User
12.12.1. Veterinary Reference Laboratories
12.12.2. Veterinary Hospitals and Clinics
12.12.3. Point-of-care/In-house Testing
12.12.4. Research Institutes and Universities
13. Asia Pacific Companion Animal Diagnostics Market Analysis
13.1. Key Findings
13.2. Asia Pacific Companion Animal Diagnostics Market Overview
13.3. Asia Pacific Companion Animal Diagnostics Market Value Share and Attractiveness Analysis, by Country/Sub-region
13.4. Asia Pacific Companion Animal Diagnostics Market Forecast, by Country/Sub-region
13.4.1. Japan
13.4.2. China
13.4.3. India
13.4.4. Australia & New Zealand
13.4.5. Rest of Asia Pacific
13.5. Asia Pacific Companion Animal Diagnostics Market Value Share and Attractiveness Analysis, by Technology
13.6. Asia Pacific Companion Animal Diagnostics Market Forecast, by Technology
13.6.1. Clinical Biochemistry
13.6.1.1. Clinical Chemistry Analysis
13.6.1.2. Glucose Monitoring
13.6.1.3. Blood Gas & Electrolyte Analysis
13.6.2. Molecular Diagnostics
13.6.2.1. Polymer Chain Reaction Tests
13.6.2.2. Microarrays
13.6.2.3. Others
13.6.3. Immunodiagnostics
13.6.4. Hematology
13.6.5. Urinalysis
13.6.6. Other
13.7. Asia Pacific Companion Animal Diagnostics Market Value Share and Attractiveness Analysis, by Application
13.8. Asia Pacific Companion Animal Diagnostics Market Forecast, by Application
13.8.1. Clinical Pathology
13.8.2. Bacteriology
13.8.3. Parasitology
13.8.4. Other
13.9. Asia Pacific Companion Animal Diagnostics Market Value Share and Attractiveness Analysis, by Animal
13.10. Asia Pacific Companion Animal Diagnostics Market Forecast, by Animal
13.10.1. Dog
13.10.2. Cat
13.10.3. Other
13.11. Asia Pacific Companion Animal Diagnostics Market Value Share and Attractiveness Analysis, by End User
13.12. Asia Pacific Companion Animal Diagnostics Market Forecast, by End User
13.12.1. Veterinary Reference Laboratories
13.12.2. Veterinary Hospitals and Clinics
13.12.3. Point-of-care/In-house Testing
13.12.4. Research Institutes and Universities
14. Latin America Companion Animal Diagnostics Market Analysis
14.1. Key Findings
14.2. Latin America Companion Animal Diagnostics Market Overview
14.3. Latin America Companion Animal Diagnostics Market Value Share and Attractiveness Analysis, by Country/Sub-region
14.4. Latin America Companion Animal Diagnostics Market Forecast, by Country/Sub-region
14.4.1. Brazil
14.4.2. Mexico
14.4.3. Rest of Latin America
14.5. Latin America Companion Animal Diagnostics Market Value Share and Attractiveness Analysis, by Technology
14.6. Latin America Companion Animal Diagnostics Market Forecast, by Technology
14.6.1. Clinical Biochemistry
14.6.1.1. Clinical Chemistry Analysis
14.6.1.2. Glucose Monitoring
14.6.1.3. Blood Gas & Electrolyte Analysis
14.6.2. Molecular Diagnostics
14.6.2.1. Polymer Chain Reaction Tests
14.6.2.2. Microarrays
14.6.2.3. Others
14.6.3. Immunodiagnostics
14.6.4. Hematology
14.6.5. Urinalysis
14.6.6. Other
14.7. Latin America Companion Animal Diagnostics Market Value Share and Attractiveness Analysis, by Application
14.8. Latin America Companion Animal Diagnostics Market Forecast, by Application
14.8.1. Clinical Pathology
14.8.2. Bacteriology
14.8.3. Parasitology
14.8.4. Other
14.9. Latin America Companion Animal Diagnostics Market Value Share and Attractiveness Analysis, by Animal
14.10. Latin America Companion Animal Diagnostics Market Forecast, by Animal
14.10.1. Dog
14.10.2. Cat
14.10.3. Other
14.11. Latin America Companion Animal Diagnostics Market Value Share and Attractiveness Analysis, by End User
14.12. Latin America Companion Animal Diagnostics Market Forecast, by End User
14.12.1. Veterinary Reference Laboratories
14.12.2. Veterinary Hospitals and Clinics
14.12.3. Point-of-care/In-house Testing
14.12.4. Research Institutes and Universities
15. Middle East & Africa Companion Animal Diagnostics Market Analysis
15.1. Key Findings
15.2. Middle East & Africa Companion Animal Diagnostics Market Overview
15.3. Middle East & Africa Companion Animal Diagnostics Market Value Share and Attractiveness Analysis, by Country/Sub-region
15.4. Middle East & Africa Companion Animal Diagnostics Market Forecast, by Country/Sub-region
15.4.1. GCC Countries
15.4.2. South Africa
15.4.3. Rest of Middle East & Africa
15.5. Middle East & Africa Companion Animal Diagnostics Market Value Share and Attractiveness Analysis, by Technology
15.6. Middle East & Africa Companion Animal Diagnostics Market Forecast, by Technology
15.6.1. Clinical Biochemistry
15.6.1.1. Clinical Chemistry Analysis
15.6.1.2. Glucose Monitoring
15.6.1.3. Blood Gas & Electrolyte Analysis
15.6.2. Molecular Diagnostics
15.6.2.1. Polymer Chain Reaction Tests
15.6.2.2. Microarrays
15.6.2.3. Others
15.6.3. Immunodiagnostics
15.6.4. Hematology
15.6.5. Urinalysis
15.6.6. Other
15.7. Middle East & Africa Companion Animal Diagnostics Market Value Share and Attractiveness Analysis, by Application
15.8. Middle East & Africa Companion Animal Diagnostics Market Forecast, by Application
15.8.1. Clinical Pathology
15.8.2. Bacteriology
15.8.3. Parasitology
15.8.4. Other
15.9. Middle East & Africa Companion Animal Diagnostics Market Value Share and Attractiveness Analysis, by Animal
15.10. Middle East & Africa Companion Animal Diagnostics Market Forecast, by Animal
15.10.1. Dog
15.10.2. Cat
15.10.3. Other
15.11. Middle East & Africa Companion Animal Diagnostics Market Value Share and Attractiveness Analysis, by End User
15.12. Middle East & Africa Companion Animal Diagnostics Market Forecast, by End User
15.12.1. Veterinary Reference Laboratories
15.12.2. Veterinary Hospitals and Clinics
15.12.3. Point-of-care/In-house Testing
15.12.4. Research Institutes and Universities
16. Competition Analysis
16.1. Global Companion Animal Diagnostics Market Share Analysis, by Company
16.2. Competition Matrix
16.3. Company Profile
16.3.1. Heska Corporation
16.3.1.1. Company Overview (HQ, Business Segments, Employee Strength)
16.3.1.2. Financial Overview
16.3.1.3. Product Portfolio
16.3.1.4. SWOT Analysis
16.3.1.5. Strategic Overview
16.3.2. IDEXX laboratories, Inc.
16.3.2.1. Company Overview (HQ, Business Segments, Employee Strength)
16.3.2.2. Financial Overview
16.3.2.3. Product Portfolio
16.3.2.4. SWOT Analysis
16.3.2.5. Strategic Overview
16.3.3. Thermo Fisher Scientific, Inc.
16.3.3.1. Company Overview (HQ, Business Segments, Employee Strength)
16.3.3.2. Financial Overview
16.3.3.3. Product Portfolio
16.3.3.4. SWOT Analysis
16.3.3.5. Strategic Overview
16.3.4. QIAGEN N.V.
16.3.4.1. Company Overview (HQ, Business Segments, Employee Strength)
16.3.4.2. Financial Overview
16.3.4.3. Product Portfolio
16.3.4.4. SWOT Analysis
16.3.4.5. Strategic Overview
16.3.5. Zoetis, Inc.
16.3.5.1. Company Overview (HQ, Business Segments, Employee Strength)
16.3.5.2. Financial Overview
16.3.5.3. Product Portfolio
16.3.5.4. SWOT Analysis
16.3.5.5. Strategic Overview
16.3.6. Neogen Corporation
16.3.6.1. Company Overview (HQ, Business Segments, Employee Strength)
16.3.6.2. Financial Overview
16.3.6.3. Product Portfolio
16.3.6.4. SWOT Analysis
16.3.6.5. Strategic Overview
16.3.7. bioMerieux SA
16.3.7.1. Company Overview (HQ, Business Segments, Employee Strength)
16.3.7.2. Financial Overview
16.3.7.3. Product Portfolio
16.3.7.4. SWOT Analysis
16.3.7.5. Strategic Overview
16.3.8. Randox Laboratories Ltd.
16.3.8.1. Company Overview (HQ, Business Segments, Employee Strength)
16.3.8.2. Product Portfolio
16.3.8.3. SWOT Analysis
16.3.8.4. Strategic Overview
16.3.9. Virbac
16.3.9.1. Company Overview (HQ, Business Segments, Employee Strength)
16.3.9.2. Product Portfolio
16.3.9.3. SWOT Analysis
16.3.9.4. Strategic Overview
List of Tables
Table 01: Global Companion Animal Diagnostics Market Value (US$ Mn) Forecast, by Technology, 2017–2027
Table 02: Global Companion Animal Diagnostics Market Value (US$ Mn) Forecast, by Clinical Biochemistry, 2017–2027
Table 03: Global Companion Animal Diagnostics Market Value (US$ Mn) Forecast, by Molecular Diagnostics, 2017–2027
Table 04: Global Companion Animal Diagnostics Market Value (US$ Mn) Forecast, by Application, 2017–2027
Table 05: Global Companion Animal Diagnostics Market Value (US$ Mn) Forecast, by Animal, 2017–2027
Table 06: Global Companion Animal Diagnostics Market Value (US$ Mn) Forecast, by End User, 2017–2027
Table 07: Global Companion Animal Diagnostics Market Value (US$ Mn) Forecast, by Region, 2017–2027
Table 08: North America Companion Animal Diagnostics Market Value (US$ Mn) Forecast, by Country, 2017–2027
Table 09: North America Companion Animal Diagnostics Market Value (US$ Mn) Forecast, by Technology, 2017–2027
Table 10: North America Companion Animal Diagnostics Market Value (US$ Mn) Forecast, by Clinical Biochemistry, 2017–2027
Table 11: North America Companion Animal Diagnostics Market Value (US$ Mn) Forecast, by Molecular Diagnostics, 2017–2027
Table 12: North America Companion Animal Diagnostics Market Value (US$ Mn) Forecast, by Application, 2017–2027
Table 13: North America Companion Animal Diagnostics Market Value (US$ Mn) Forecast, by Animal, 2017–2027
Table 14: North America Companion Animal Diagnostics Market Value (US$ Mn) Forecast, by End User, 2017–2027
Table 15: Europe Companion Animal Diagnostics Market Value (US$ Mn) Forecast, by Country/Sub-region, 2017–2027
Table 16: Europe Companion Animal Diagnostics Market Value (US$ Mn) Forecast, by Technology, 2017–2027
Table 17: Europe Companion Animal Diagnostics Market Value (US$ Mn) Forecast, by Clinical Biochemistry, 2017–2027
Table 18: Europe Companion Animal Diagnostics Market Value (US$ Mn) Forecast, by Molecular Diagnostics, 2017–2027
Table 19: Europe Companion Animal Diagnostics Market Value (US$ Mn) Forecast, by Application, 2017–2027
Table 20: Europe Companion Animal Diagnostics Market Value (US$ Mn) Forecast, by Animal, 2017–2027
Table 21: Europe Companion Animal Diagnostics Market Value (US$ Mn) Forecast, by End User, 2017–2027
Table 22: Asia Pacific Companion Animal Diagnostics Market Value (US$ Mn) Forecast, by Country/Sub-region, 2017–2027
Table 23: Asia Pacific Companion Animal Diagnostics Market Value (US$ Mn) Forecast, by Technology, 2017–2027
Table 24: Asia Pacific Companion Animal Diagnostics Market Value (US$ Mn) Forecast, by Clinical Biochemistry, 2017–2027
Table 25: Asia Pacific Companion Animal Diagnostics Market Value (US$ Mn) Forecast, by Molecular Diagnostics, 2017–2027
Table 26: Asia Pacific Companion Animal Diagnostics Market Value (US$ Mn) Forecast, by Application, 2017–2027
Table 27: Asia Pacific Companion Animal Diagnostics Market Value (US$ Mn) Forecast, by Animal, 2017–2027
Table 28: Asia Pacific Companion Animal Diagnostics Market Value (US$ Mn) Forecast, by End User, 2017–2027
Table 29: Latin America Companion Animal Diagnostics Market Value (US$ Mn) Forecast, by Country/Sub-region, 2017–2027
Table 30: Latin America Companion Animal Diagnostics Market Value (US$ Mn) Forecast, by Technology, 2017–2027
Table 31: Latin America Companion Animal Diagnostics Market Value (US$ Mn) Forecast, by Clinical Biochemistry, 2017–2027
Table 32: Latin America Companion Animal Diagnostics Market Value (US$ Mn) Forecast, by Molecular Diagnostics, 2017–2027
Table 33: Latin America Companion Animal Diagnostics Market Value (US$ Mn) Forecast, by Application, 2017–2027
Table 34: Latin America Companion Animal Diagnostics Market Value (US$ Mn) Forecast, by Animal, 2017–2027
Table 35: Latin America Companion Animal Diagnostics Market Value (US$ Mn) Forecast, by End User, 2017–2027
Table 36: Middle East & Africa Companion Animal Diagnostics Market Value (US$ Mn) Forecast, by Country/Sub-region, 2017–2027
Table 37: Middle East & Africa Companion Animal Diagnostics Market Value (US$ Mn) Forecast, by Technology, 2017–2027
Table 38: Middle East & Africa Companion Animal Diagnostics Market Value (US$ Mn) Forecast, by Clinical Biochemistry, 2017–2027
Table 39: Middle East & Africa Companion Animal Diagnostics Market Value (US$ Mn) Forecast, by Molecular Diagnostics, 2017–2027
Table 40: Middle East & Africa Companion Animal Diagnostics Market Value (US$ Mn) Forecast, by Application, 2017–2027
Table 41: Middle East & Africa Companion Animal Diagnostics Market Value (US$ Mn) Forecast, by Animal, 2017–2027
Table 42: Middle East & Africa Companion Animal Diagnostics Market Value (US$ Mn) Forecast, by End User, 2017–2027
List of Figures
Figure 01: Global Companion Animal Diagnostics Market Value (US$ Mn) and Distribution (%), by Region, 2018 and 2027
Figure 02: Global Companion Animal Diagnostics Market Value (US$ Mn) and Forecast, 2019–2027
Figure 03: Global Companion Animal Diagnostics Market Value Share (%), by Technology, 2018
Figure 04: Global Companion Animal Diagnostics Market Value Share (%), by Application, 2018
Figure 05: Global Companion Animal Diagnostics Market Value Share (%), by Animal, 2018
Figure 06: Global Companion Animal Diagnostics Market Value Share (%), by Region, 2018
Figure 07: Global Companion Animal Diagnostics Market Value Share (%), by End User, 2018
Figure 08: Global Companion Animal Diagnostics Market Value Share Analysis, by Technology, 2018 and 2027
Figure 09: Global Companion Animal Diagnostics Market Attractiveness, by Technology, 2019–2027
Figure 10: Global Companion Animal Diagnostics Market Value (US$ Mn) and Y-o-Y Growth (%), by Clinical Biochemistry, 2017–2027
Figure 11: Global Companion Animal Diagnostics Market Value (US$ Mn) and Y-o-Y Growth (%), by Molecular Diagnostics, 2017–2027
Figure 12: Global Companion Animal Diagnostics Market Value (US$ Mn) and Y-o-Y Growth (%), by Immunodiagnostics, 2017–2027
Figure 13: Global Companion Animal Diagnostics Market Value (US$ Mn) and Y-o-Y Growth (%), by Hematology, 2017–2027
Figure 14: Global Companion Animal Diagnostics Market Value (US$ Mn) and Y-o-Y Growth (%), by Urinalysis, 2017–2027
Figure 01: Global Companion Animal Diagnostics Market Value (US$ Mn) and Distribution (%), by Region, 2018 and 2027
Figure 02: Global Companion Animal Diagnostics Market Size (US$ Mn) and Forecast, 2019–2027
Figure 03: Global Companion Animal Diagnostics Market Value Share (%), by Technology, 2018
Figure 04: Global Companion Animal Diagnostics Market Value Share (%), by Application, 2018
Figure 05: Global Companion Animal Diagnostics Market Value Share (%), by Animal, 2018
Figure 06: Global Companion Animal Diagnostics Market Value Share (%), by Region, 2018
Figure 07: Global Companion Animal Diagnostics Market Value Share (%), by End User, 2018
Figure 08: Global Companion Animal Diagnostics Market Value Share Analysis, by Technology, 2018 and 2027
Figure 09: Global Companion Animal Diagnostics Market Attractiveness, by Technology, 2019–2027
Figure 10: Global Companion Animal Diagnostics Market Value (US$ Mn) and Y-o-Y Growth (%), by Clinical Biochemistry, 2017–2027
Figure 11: Global Companion Animal Diagnostics Market Value (US$ Mn) and Y-o-Y Growth (%), by Molecular Diagnostics, 2017–2027
Figure 12: Global Companion Animal Diagnostics Market Value (US$ Mn) and Y-o-Y Growth (%), by Immunodiagnostics, 2017–2027
Figure 13: Global Companion Animal Diagnostics Market Value (US$ Mn) and Y-o-Y Growth (%), by Hematology, 2017–2027
Figure 14: Global Companion Animal Diagnostics Market Value (US$ Mn) and Y-o-Y Growth (%), by Urinalysis, 2017–2027
Figure 15: Global Companion Animal Diagnostics Market Value (US$ Mn) and Y-o-Y Growth (%), by Other, 2017–2027
Figure 16: Global Companion Animal Diagnostics Market Value Share Analysis, by Application, 2018 and 2027
Figure 17: Global Companion Animal Diagnostics Market Attractiveness, by Application, 2019–2027
Figure 18: Global Companion Animal Diagnostics Market Value (US$ Mn) and Y-o-Y Growth (%), by Clinical Pathology, 2017–2027
Figure 19: Global Companion Animal Diagnostics Market Value (US$ Mn) and Y-o-Y Growth (%), by Bacteriology, 2017–2027
Figure 20: Global Companion Animal Diagnostics Market Value (US$ Mn) and Y-o-Y Growth (%), by Parasitology, 2017–2027
Figure 21: Global Companion Animal Diagnostics Market Value (US$ Mn) and Y-o-Y Growth (%), by Other, 2017–2027
Figure 22: Global Companion Animal Diagnostics Market Value Share, by Animal, 2018 and 2027
Figure 23: Global Companion Animal Diagnostics Market Attractiveness, by Animal, 2019–2027
Figure 24: Global Companion Animal Diagnostics Market Value (US$ Mn) and Y-o-Y Growth (%), by Dog, 2017–2027
Figure 25: Global Companion Animal Diagnostics Market Value (US$ Mn) and Y-o-Y Growth (%), by Cat, 2017–2027
Figure 25: Global Companion Animal Diagnostics Market Value (US$ Mn) and Y-o-Y Growth (%), by Other, 2017–2027
Figure 27: Global Companion Animal Diagnostics Market Value Share Analysis, by End User, 2018 and 2027
Figure 28: Global Companion Animal Diagnostics Market Attractiveness, by End User, 2019–2027
Figure 29: Global Companion Animal Diagnostics Market Value (US$ Mn) and Y-o-Y Growth (%), by Veterinary Reference Laboratories, 2017–2027
Figure 30: Global Companion Animal Diagnostics Market Value (US$ Mn) and Y-o-Y Growth (%), by Veterinary Hospitals and Clinics, 2017–2027
Figure 31: Global Companion Animal Diagnostics Market Value (US$ Mn) and Y-o-Y Growth (%), by Point-of-care/In-house Testing, 2017–2027
Figure 32: Global Companion Animal Diagnostics Market Value (US$ Mn) and Y-o-Y Growth (%), by Research Institutes and Universities, 2017–2027
Figure 33: Global Companion Animal Diagnostics Market Value Share, by Region, 2018 and 2027
Figure 34: Global Companion Animal Diagnostics Market Attractiveness, by Region, 2019–2027
Figure 35: North America Companion Animal Diagnostics Market Value (US$ Mn) Forecast and Y-o-Y Growth (%) Projection, 2017–2027
Figure 36: North America Companion Animal Diagnostics Market Value Share Analysis, by Country, 2018 and 2027
Figure 37: North America Companion Animal Diagnostics Market Attractiveness, by Country, 2019–2027
Figure 38: North America Companion Animal Diagnostics Market Value Share Analysis, by Technology, 2018 and 2027
Figure 39: North America Companion Animal Diagnostics Market Attractiveness, by Technology, 2019–2027
Figure 40: North America Companion Animal Diagnostics Market Value Share Analysis, by Application, 2018 and 2027
Figure 41: North America Companion Animal Diagnostics Market Attractiveness, by Application, 2019–2027
Figure 42: North America Companion Animal Diagnostics Market Value Share, by Animal, 2018 and 2027
Figure 43: North America Companion Animal Diagnostics Market Attractiveness, by Animal, 2019–2027
Figure 44: North America Companion Animal Diagnostics Market Value Share Analysis, by End User, 2018 and 2027
Figure 45: North America Companion Animal Diagnostics Market Attractiveness, by End User, 2019–2027
Figure 46: Europe Companion Animal Diagnostics Market Value (US$ Mn) Forecast and Y-o-Y Growth (%) Projection, 2017–2027
Figure 47: Europe Companion Animal Diagnostics Market Value Share Analysis, by Country/Sub-region, 2018 and 2027
Figure 48: Europe Companion Animal Diagnostics Market Attractiveness, by Country/Sub-region, 2019–2027
Figure 49: Europe Companion Animal Diagnostics Market Value Share Analysis, by Technology, 2018 and 2027
Figure 50: Europe Companion Animal Diagnostics Market Attractiveness, by Technology, 2019–2027
Figure 51: Europe Companion Animal Diagnostics Market Value Share Analysis, by Application, 2018 and 2027
Figure 52: Europe Companion Animal Diagnostics Market Attractiveness, by Application, 2019–2027
Figure 53: Europe Companion Animal Diagnostics Market Value Share, by Animal, 2018 and 2027
Figure 54: Europe Companion Animal Diagnostics Market Attractiveness, by Animal, 2019–2027
Figure 55: Europe Companion Animal Diagnostics Market Value Share Analysis, by End User, 2018 and 2027
Figure 56: Europe Companion Animal Diagnostics Market Attractiveness, by End User, 2019–2027
Figure 57: Asia Pacific Companion Animal Diagnostics Market Value (US$ Mn) Forecast and Y-o-Y Growth (%) Projection, 2017–2027
Figure 58: Asia Pacific Companion Animal Diagnostics Market Value Share Analysis, by Country/Sub-region, 2018 and 2027
Figure 59: Asia Pacific Companion Animal Diagnostics Market Attractiveness, by Country/Sub-region, 2019–2027
Figure 60: Asia Pacific Companion Animal Diagnostics Market Value Share Analysis, by Technology, 2018 and 2027
Figure 61: Asia Pacific Companion Animal Diagnostics Market Attractiveness, by Technology, 2019–2027
Figure 62: Asia Pacific Companion Animal Diagnostics Market Value Share Analysis, by Application, 2018 and 2027
Figure 63: Asia Pacific Companion Animal Diagnostics Market Attractiveness, by Application, 2019–2027
Figure 64: Asia Pacific Companion Animal Diagnostics Market Value Share, by Animal, 2018 and 2027
Figure 65: Asia Pacific Companion Animal Diagnostics Market Attractiveness, by Animal, 2019–2027
Figure 66: Asia Pacific Companion Animal Diagnostics Market Value Share Analysis, by End User, 2018 and 2027
Figure 67: Asia Pacific Companion Animal Diagnostics Market Attractiveness, by End User, 2019–2027
Figure 68: Latin America Companion Animal Diagnostics Market Value (US$ Mn) Forecast and Y-o-Y Growth (%) Projection, 2017–2027
Figure 69: Latin America Companion Animal Diagnostics Market Value Share Analysis, by Country/Sub-region, 2018 and 2027
Figure 70: Latin America Companion Animal Diagnostics Market Attractiveness, by Country/Sub-region, 2019–2027
Figure 71: Latin America Companion Animal Diagnostics Market Value Share Analysis, by Technology, 2018 and 2027
Figure 72: Latin America Companion Animal Diagnostics Market Attractiveness, by Technology, 2019–2027
Figure 73: Latin America Companion Animal Diagnostics Market Value Share Analysis, by Application, 2018 and 2027
Figure 74: Latin America Companion Animal Diagnostics Market Attractiveness, by Application, 2019–2027
Figure 75: Latin America Companion Animal Diagnostics Market Value Share, by Animal, 2018 and 2027
Figure 76: Latin America Companion Animal Diagnostics Market Attractiveness, by Animal, 2019–2027
Figure 77: Latin America Companion Animal Diagnostics Market Value Share Analysis, by End User, 2018 and 2027
Figure 78: Latin America Companion Animal Diagnostics Market Attractiveness, by End User, 2019–2027
Figure 79: Middle East & Africa Companion Animal Diagnostics Market Value (US$ Mn) Forecast and Y-o-Y Growth (%) Projection, 2017–2027
Figure 80: Middle East & Africa Companion Animal Diagnostics Market Value Share Analysis, by Country/Sub-region, 2018 and 2027
Figure 81: Middle East & Africa Companion Animal Diagnostics Market Attractiveness, by Country/Sub-region, 2019–2027
Figure 82: Middle East & Africa Companion Animal Diagnostics Market Value Share Analysis, by Technology, 2018 and 2027
Figure 83: Middle East & Africa Companion Animal Diagnostics Market Attractiveness, by Technology, 2019–2027
Figure 84: Middle East & Africa Companion Animal Diagnostics Market Value Share Analysis, by Application, 2018 and 2027
Figure 85: Middle East & Africa Companion Animal Diagnostics Market Attractiveness, by Application, 2019–2027
Figure 86: Middle East & Africa Companion Animal Diagnostics Market Value Share, by Animal, 2018 and 2027
Figure 87: Middle East & Africa Companion Animal Diagnostics Market Attractiveness, by Animal, 2019–2027
Figure 88: Middle East & Africa Companion Animal Diagnostics Market Value Share Analysis, by End User, 2018 and 2027
Figure 89: Middle East & Africa Companion Animal Diagnostics Market Attractiveness, by End User, 2019–2027
Figure 90: Global Companion Animal Diagnostics Market Share, by Company, 2018
Copyright © Transparency Market Research, Inc. All Rights reserved
Trust Online

Companion Animal Diagnostics Market