
Reports
Reports
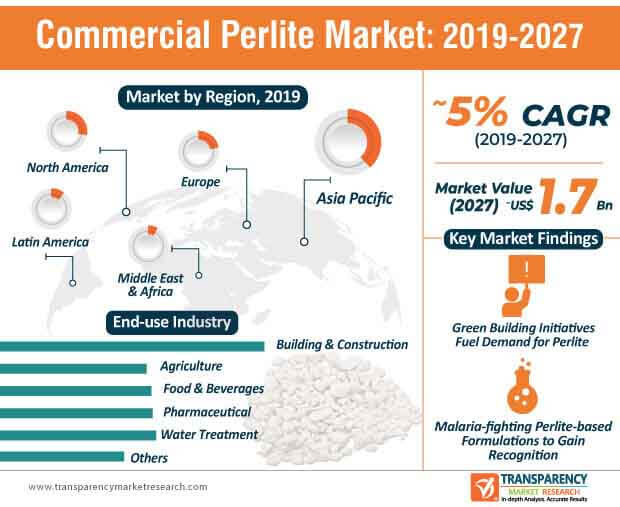
Sustainability has become the key focus point of manufacturers in the commercial perlite market. Green building initiatives is a key driver that is contributing to the growth of the market for commercial perlite. Moreover, building & construction end-use industry segment is expected to lead the commercial perlite market. The global market is expected to reach ~US$ 1.7 Bn by the end of 2027. Hence, manufacturers are leveraging opportunities in the green building industry to accommodate the ever-increasing human habitation within limited resources.
Green building initiatives are being highly publicized in the U.S., since the buildings consume one-third of the total energy, two-thirds of the electricity, and one-eighth of the water, thus creating a tress on the resources. These initiatives are creating a demand for commercial perlite to assess the effects a building has on its site. Stakeholders in the building & construction industry are utilizing valuable information to deploy sustainable solutions throughout the life cycle of a building.
To gauge the scope of customization in our reports Ask for a Sample
Apart from building & construction, companies in the commercial perlite market are tapping opportunities in novel formulations. For instance, leading producer of industrial minerals Imersys announced the launch of Imergard WP, a malaria-fighting perlite-based innovation that can be spray applied on walls and kills mosquitos that make contact with it. As such, companies are increasing research to develop formulations that prevent immunization of insects toward the formulation.
The global commercial perlite market is projected to reach an output of ~6,100 kilo tons by 2027. An alarming rate of individuals dying due to malaria has created a demand for innovative commercial perlite-based formulations. Thus, malaria-fighting commercial perlite-based formulations are increasingly replacing traditional chemical insecticides, since insects and mosquitos become immune to these insecticides. Companies are taking efforts to increase production capacities in order to manufacture new and efficacious performing solutions to solve major public health problems in sub Saharan Africa.
Get an idea about the offerings of our report from Report Brochure
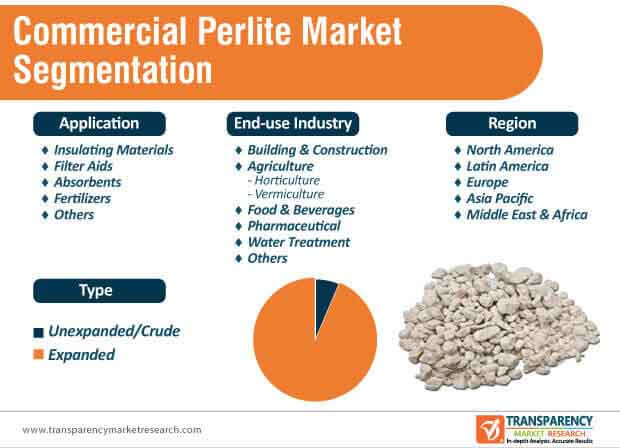
Various drivers have bolstered the utilization of commercial perlite in water quality management. Moreover, water treatment end-use industry segment is predicted for exponential growth in the commercial perlite market and the global commercial perlite market is expected to grow at a modest CAGR of ~5% during the forecast period. Thus, the concept of storm water filtration is acquiring popularity in the market for commercial perlite. Likewise, special attributes of expanded perlite are benefitting stakeholders in order to carry out storm water filtration. This is evident since expanded type segment accounts for the larger share of the commercial perlite market as compared to unexpanded/crude segment.
High surface area, neutral pH, and porous surface texture of expanded perlite have made it a preferred choice among stakeholders opting for storm water filtration. Likewise, the Washington State Dept. of Transportation have developed roadside media filter drains that incorporate horticulture-grade perlite, and agricultural gypsum held in place by crushed rocks to filter suspended solids and other pollutants from roadway runoff.
The commercial perlite market is fragmented, wherein regional and local manufacturers account for ~74% of the total market share. However, the availability of substitutes for commercial perlite poses as a challenge for both leading and emerging players. For instance, vermiculite is being highly publicized for increased water retention capacities as compared to perlite in the application of gardening in domestic and commercial settings. Hence, manufacturers are strategically marketing perlite for plants that require less water such as cacti and succulents.
Commercial perlite is growing popular for increased soil aeration in the gardening application. Thus, companies in the commercial perlite market are recommending equal ratio combination of vermiculite and perlite for gardening application. On the other hand, companies are broadening their scope for revenue opportunities through insulation applications. Expanded perlite is gaining popularity as an inexpensive and permanent method for insulating masonry walls. Manufacturers are increasing the availability of perlite for cryogenic insulation in order to store hydrogen and helium in double-walled vessels with perlite-filled annular spaces.
Looking for Regional Analysis or Competitive Landscape in Commercial Perlite Market, ask for a customized report
Analysts’ Viewpoint
Perlite’s versatility and usefulness have a crucial role to play in green building initiatives to accommodate human habitation within limited resources. Companies in the commercial perlite market are increasing R&D to develop environmental-friendly perlite-based alternatives to plastic microbeads. The utilization of perlite is expected for exponential growth in the F&B and pharmaceutical industries.
Perlite is increasingly being used for gardening activities in domestic and commercial settings. However, substitute products such as vermiculite, expanded clay, and pumice pose as a threat to the sales of perlite. Hence, companies should target the utilization of perlite in gardening applications that cater to plants with less water needs such as succulents and cactus.
Commercial Perlite Market: Overview
Key Drivers of Commercial Perlite Market
Asia Pacific to Dominate Commercial Perlite Market
Leading Players Operating in Global Market
1. Executive Summary
1.1. Market Snapshot: Global Commercial Perlite Market
1.2. Key Trends
1.3. Global Commercial Perlite Market Volume Share Analysis, by Type, 2018
1.4. Global Commercial Perlite Market Volume Share Analysis, by Application, 2018
1.5. Global Commercial Perlite Market Volume Share Analysis, by End-use Industry, 2018
2. Market Overview
2.1. Product Overview
2.2. Market Indicators
2.3. Drivers and Restraints Snapshot Analysis
2.3.1. Drivers
2.3.2. Restraints
2.3.3. Opportunities
2.4. Porter’s Five Forces Analysis
2.4.1. Threat of Substitutes
2.4.2. Bargaining Power of Buyers
2.4.3. Bargaining Power of Suppliers
2.4.4. Threat of New Entrants
2.4.5. Degree of Competition
2.5. Value Chain Analysis
2.6. List of Key Manufacturers
2.7. List of Potential Customers
3. Production Output Analysis
4. Pricing Analysis
4.1. Global Commercial Perlite Market, Pricing Analysis (US$/Ton), by Type, 2018
5. Import–Export Analysis
6. Global Commercial Perlite Market Analysis and Forecast, by Type
6.1. Introduction
6.2. Global Commercial Perlite Market Volume Share Analysis, by Type, 2018 and 2027
6.3. Global Commercial Perlite Market Volume (Kilo Tons) and Value (US$ Mn) Forecast, by Type, 2018–2027
6.3.1. Unexpanded/Crude
6.3.2. Expanded
6.4. Global Commercial Perlite Market Attractiveness Analysis, by Type
7. Global Commercial Perlite Market Analysis and Forecast, by Application
7.1. Introduction
7.2. Global Commercial Perlite Market Volume Share Analysis, by Application, 2018 and 2027
7.3. Global Commercial Perlite Market Volume (Kilo Tons) and Value (US$ Mn) Forecast, by Application, 2018–2027
7.3.1. Insulating Material
7.3.2. Filter Aid
7.3.3. Absorbent
7.3.4. Fertilizer
7.3.5. Others
7.4. Global Commercial Perlite Market Attractiveness Analysis, by Application
8. Global Commercial Perlite Market Analysis and Forecast, by End-use Industry
8.1. Introduction
8.2. Global Commercial Perlite Market Volume Share Analysis, by End-use Industry, 2018 and 2027
8.3. Global Commercial Perlite Market Volume (Kilo Tons) and Value (US$ Mn) Forecast, by End-use Industry, 2018–2027
8.3.1. Building & Construction
8.3.2. Agriculture
8.3.2.1. Horticulture
8.3.2.2. Vermiculture
8.3.3. Food & Beverages
8.3.4. Pharmaceutical
8.3.5. Water Treatment
8.3.6. Others
8.4. Global Commercial Perlite Market Attractiveness Analysis, by End-use Industry
9. Global Commercial Perlite Market Analysis and Forecast, by Region
9.1. Global Commercial Perlite Market Volume Share Analysis, by Region, 2018 and 2027
9.2. Global Commercial Perlite Market Volume (Kilo Tons) and Value (US$ Mn) Forecast, by Region, 2018–2027
9.2.1. North America
9.2.2. Latin America
9.2.3. Europe
9.2.4. Asia Pacific
9.2.5. Middle East & Africa
9.3. Global Commercial Perlite Market Attractiveness Analysis, by Region
10. North America Commercial Perlite Market Analysis and Forecast
10.1. Key Findings
10.2. North America Commercial Perlite Market Overview
10.3. North America Commercial Perlite Market Volume Share Analysis and Forecast, by Type, 2018 and 2027
10.4. North America Commercial Perlite Market Volume (Kilo Tons) and Value (US$ Mn) Forecast, by Type, 2018–2027
10.4.1. Unexpanded/Crude
10.4.2. Expanded
10.5. North America Commercial Perlite Market Volume Share Analysis and Forecast, by Application, 2018 and 2027
10.6. North America Commercial Perlite Market Volume (Kilo Tons) and Value (US$ Mn) Forecast, by Application, 2018–2027
10.6.1. Insulating Material
10.6.2. Filter Aid
10.6.3. Absorbent
10.6.4. Fertilizer
10.6.5. Others
10.7. North America Commercial Perlite Market Volume Share Analysis and Forecast, by End-use Industry, 2018 and 2027
10.8. North America Commercial Perlite Market Volume (Kilo Tons) and Value (US$ Mn) Forecast, by End-use Industry, 2018–2027
10.8.1. Building & Construction
10.8.2. Agriculture
10.8.2.1. Horticulture
10.8.2.2. Vermiculture
10.8.3. Food & Beverages
10.8.4. Pharmaceutical
10.8.5. Water Treatment
10.8.6. Others
10.9. North America Commercial Perlite Market Volume Share Analysis and Forecast, by Country, 2018 and 2027
10.10. North America Commercial Perlite Market Volume (Kilo Tons) and Value (US$ Mn) Forecast, by Country, 2018–2027
10.10.1. U.S. Commercial Perlite Market Volume (Kilo Tons) and Value (US$ Mn) Forecast, by Type, 2018–2027
10.10.2. U.S. Commercial Perlite Market Volume (Kilo Tons) and Value (US$ Mn) Forecast, by Application, 2018–2027
10.10.3. U.S. Commercial Perlite Market Volume (Kilo Tons) and Value (US$ Mn) Forecast, by End-use Industry, 2018–2027
10.10.4. Canada Commercial Perlite Market Volume (Kilo Tons) and Value (US$ Mn) Forecast, by Type, 2018–2027
10.10.5. Canada Commercial Perlite Market Volume (Kilo Tons) and Value (US$ Mn) Forecast, by Application, 2018–2027
10.10.6. Canada Commercial Perlite Market Volume (Kilo Tons) and Value (US$ Mn) Forecast, by End-use Industry, 2018–2027
11. Europe Commercial Perlite Market Analysis and Forecast
11.1. Key Findings
11.2. Europe Commercial Perlite Market Overview
11.3. Europe Commercial Perlite Market Volume Share Analysis and Forecast, by Type, 2018 and 2027
11.4. Europe Commercial Perlite Market Volume (Kilo Tons) and Value (US$ Mn) Forecast, by Type, 2018–2027
11.4.1. Unexpanded/Crude
11.4.2. Expanded
11.5. Europe Commercial Perlite Market Volume Share Analysis and Forecast, by Application, 2018 and 2027
11.6. Europe Commercial Perlite Market Volume (Kilo Tons) and Value (US$ Mn) Forecast, by Application, 2018–2027
11.6.1. Insulating Material
11.6.2. Filter Aid
11.6.3. Absorbent
11.6.4. Fertilizer
11.6.5. Others
11.7. Europe Commercial Perlite Market Volume Share Analysis and Forecast, by End-use Industry, 2018 and 2027
11.8. Europe Commercial Perlite Market Volume (Kilo Tons) and Value (US$ Mn) Forecast, by End-use Industry, 2018–2027
11.8.1. Building & Construction
11.8.2. Agriculture
11.8.2.1. Horticulture
11.8.2.2. Vermiculture
11.8.3. Food & Beverages
11.8.4. Pharmaceutical
11.8.5. Water Treatment
11.8.6. Others
11.9. Europe Commercial Perlite Market Volume Share Analysis and Forecast, by Country and Sub-region, 2018 and 2027
11.10. Europe Commercial Perlite Market Volume (Kilo Tons) and Value (US$ Mn) Forecast, by Country and Sub-region, 2018–2027
11.10.1. Germany Commercial Perlite Market Volume (Kilo Tons) and Value (US$ Mn) Forecast, by Type, 2018–2027
11.10.2. Germany Commercial Perlite Market Volume (Kilo Tons) and Value (US$ Mn) Forecast, by Application, 2018–2027
11.10.3. Germany Commercial Perlite Market Volume (Kilo Tons) and Value (US$ Mn) Forecast, by End-use Industry, 2018–2027
11.10.4. Italy Commercial Perlite Market Volume (Kilo Tons) and Value (US$ Mn) Forecast, by Type, 2018–2027
11.10.5. Italy Commercial Perlite Market Volume (Kilo Tons) and Value (US$ Mn) Forecast, by Application, 2018–2027
11.10.6. Italy Commercial Perlite Market Volume (Kilo Tons) and Value (US$ Mn) Forecast, by End-use Industry, 2018–2027
11.10.7. U.K. Commercial Perlite Market Volume (Kilo Tons) and Value (US$ Mn) Forecast, by Type, 2018–2027
11.10.8. U.K. Commercial Perlite Market Volume (Kilo Tons) and Value (US$ Mn) Forecast, by Application, 2018–2027
11.10.9. U.K. Commercial Perlite Market Volume (Kilo Tons) and Value (US$ Mn) Forecast, by End-use Industry, 2018–2027
11.10.10. France Commercial Perlite Market Volume (Kilo Tons) and Value (US$ Mn) Forecast, by Type, 2018–2027
11.10.11. France Commercial Perlite Market Volume (Kilo Tons) and Value (US$ Mn) Forecast, by Application, 2018–2027
11.10.12. France Commercial Perlite Market Volume (Kilo Tons) and Value (US$ Mn) Forecast, by End-use Industry, 2018–2027
11.10.13. Spain Commercial Perlite Market Volume (Kilo Tons) and Value (US$ Mn) Forecast, by Type, 2018–2027
11.10.14. Spain Commercial Perlite Market Volume (Kilo Tons) and Value (US$ Mn) Forecast, by Application, 2018–2027
11.10.15. Spain Commercial Perlite Market Volume (Kilo Tons) and Value (US$ Mn) Forecast, by End-use Industry, 2018–2027
11.10.16. Greece Commercial Perlite Market Volume (Kilo Tons) and Value (US$ Mn) Forecast, by Type, 2018–2027
11.10.17. Greece Commercial Perlite Market Volume (Kilo Tons) and Value (US$ Mn) Forecast, by Application, 2018–2027
11.10.18. Greece Commercial Perlite Market Volume (Kilo Tons) and Value (US$ Mn) Forecast, by End-use Industry, 2018–2027
11.10.19. Turkey Commercial Perlite Market Volume (Kilo Tons) and Value (US$ Mn) Forecast, by Type, 2018–2027
11.10.20. Turkey Commercial Perlite Market Volume (Kilo Tons) and Value (US$ Mn) Forecast, by Application, 2018–2027
11.10.21. Turkey Commercial Perlite Market Volume (Kilo Tons) and Value (US$ Mn) Forecast, by End-use Industry, 2018–2027
11.10.22. Russia & CIS Commercial Perlite Market Volume (Kilo Tons) and Value (US$ Mn) Forecast, by Type, 2018–2027
11.10.23. Russia & CIS Commercial Perlite Market Volume (Kilo Tons) and Value (US$ Mn) Forecast, by Application, 2018–2027
11.10.24. Russia & CIS Commercial Perlite Market Volume (Kilo Tons) and Value (US$ Mn) Forecast, by End-use Industry, 2018–2027
11.10.25. Rest of Europe Commercial Perlite Market Volume (Kilo Tons) and Value (US$ Mn) Forecast, by Type, 2018–2027
11.10.26. Rest of Europe Commercial Perlite Market Volume (Kilo Tons) and Value (US$ Mn) Forecast, by Application, 2018–2027
11.10.27. Rest of Europe Commercial Perlite Market Volume (Kilo Tons) and Value (US$ Mn) Forecast, by End-use Industry, 2018–2027
12. Asia Pacific Commercial Perlite Market Analysis and Forecast
12.1. Key Findings
12.2. Asia Pacific Commercial Perlite Market Overview
12.3. Asia Pacific Commercial Perlite Market Volume Share Analysis and Forecast, by Type, 2018 and 2027
12.4. Asia Pacific Commercial Perlite Market Volume (Kilo Tons) and Value (US$ Mn) Forecast, by Type, 2018–2027
12.4.1. Unexpanded/Crude
12.4.2. Expanded
12.5. Asia Pacific Commercial Perlite Market Volume Share Analysis and Forecast, by Application, 2018 and 2027
12.6. Asia Pacific Commercial Perlite Market Volume (Kilo Tons) and Value (US$ Mn) Forecast, by Application, 2018–2027
12.6.1. Insulating Material
12.6.2. Filter Aid
12.6.3. Absorbent
12.6.4. Fertilizer
12.6.5. Others
12.7. Asia Pacific Commercial Perlite Market Volume Share Analysis and Forecast, by End-use Industry, 2018 and 2027
12.8. Asia Pacific Commercial Perlite Market Volume (Kilo Tons) and Value (US$ Mn) Forecast, by End-use Industry, 2018–2027
12.8.1. Building & Construction
12.8.2. Agriculture
12.8.2.1. Horticulture
12.8.2.2. Vermiculture
12.8.3. Food & Beverages
12.8.4. Pharmaceutical
12.8.5. Water Treatment
12.8.6. Others
12.9. Asia Pacific Commercial Perlite Market Volume Share Analysis and Forecast, by Country and Sub-region, 2018 and 2027
12.10. Asia Pacific Commercial Perlite Market Volume (Kilo Tons) and Value (US$ Mn) Forecast, by Country and Sub-region, 2018–2027
12.10.1. China Commercial Perlite Market Volume (Kilo Tons) and Value (US$ Mn) Forecast, by Type, 2018–2027
12.10.2. China Commercial Perlite Market Volume (Kilo Tons) and Value (US$ Mn) Forecast, by Application, 2018–2027
12.10.3. China Commercial Perlite Market Volume (Kilo Tons) and Value (US$ Mn) Forecast, by End-use Industry, 2018–2027
12.10.4. India Commercial Perlite Market Volume (Kilo Tons) and Value (US$ Mn) Forecast, by Type, 2018–2027
12.10.5. India Commercial Perlite Market Volume (Kilo Tons) and Value (US$ Mn) Forecast, by Application, 2018–2027
12.10.6. India Commercial Perlite Market Volume (Kilo Tons) and Value (US$ Mn) Forecast, by End-use Industry, 2018–2027
12.10.7. Japan Commercial Perlite Market Volume (Kilo Tons) and Value (US$ Mn) Forecast, by Type, 2018–2027
12.10.8. Japan Commercial Perlite Market Volume (Kilo Tons) and Value (US$ Mn) Forecast, by Application, 2018–2027
12.10.9. Japan Commercial Perlite Market Volume (Kilo Tons) and Value (US$ Mn) Forecast, by End-use Industry, 2018–2027
12.10.10. ASEAN Commercial Perlite Market Volume (Kilo Tons) and Value (US$ Mn) Forecast, by Type, 2018–2027
12.10.11. ASEAN Commercial Perlite Market Volume (Kilo Tons) and Value (US$ Mn) Forecast, by Application, 2018–2027
12.10.12. ASEAN Commercial Perlite Market Volume (Kilo Tons) and Value (US$ Mn) Forecast, by End-use Industry, 2018–2027
12.10.13. Rest of Asia Pacific Commercial Perlite Market Volume (Kilo Tons) and Value (US$ Mn) Forecast, by Type, 2018–2027
12.10.14. Rest of Asia Pacific Commercial Perlite Market Volume (Kilo Tons) and Value (US$ Mn) Forecast, by Application, 2018–2027
12.10.15. Rest of Asia Pacific Commercial Perlite Market Volume (Kilo Tons) and Value (US$ Mn) Forecast, by End-use Industry, 2018–2027
13. Latin America Commercial Perlite Market Analysis and Forecast
13.1. Key Findings
13.2. Latin America Commercial Perlite Market Overview
13.3. Latin America Commercial Perlite Market Volume Share Analysis and Forecast, by Type, 2018 and 2027
13.4. Latin America Commercial Perlite Market Volume (Kilo Tons) and Value (US$ Mn) Forecast, by Type, 2018–2027
13.4.1. Unexpanded/Crude
13.4.2. Expanded
13.5. Latin America Commercial Perlite Market Volume Share Analysis and Forecast, by Application, 2018 and 2027
13.6. Latin America Commercial Perlite Market Volume (Kilo Tons) and Value (US$ Mn) Forecast, by Application, 2018–2027
13.6.1. Insulating Material
13.6.2. Filter Aid
13.6.3. Absorbent
13.6.4. Fertilizer
13.6.5. Others
13.7. Latin America Commercial Perlite Market Volume Share Analysis and Forecast, by End-use Industry, 2018 and 2027
13.8. Latin America Commercial Perlite Market Volume (Kilo Tons) and Value (US$ Mn) Forecast, by End-use Industry, 2018–2027
13.8.1. Building & Construction
13.8.2. Agriculture
13.8.2.1. Horticulture
13.8.2.2. Vermiculture
13.8.3. Food & Beverages
13.8.4. Pharmaceutical
13.8.5. Water Treatment
13.8.6. Others
13.9. Latin America Commercial Perlite Market Volume Share Analysis and Forecast, by Country and Sub-region, 2018 and 2027
13.10. Latin America Commercial Perlite Market Volume (Kilo Tons) and Value (US$ Mn) Forecast, by Country and Sub-region, 2018–2027
13.10.1. Brazil Commercial Perlite Market Volume (Kilo Tons) and Value (US$ Mn) Forecast, by Type, 2018–2027
13.10.2. Brazil Commercial Perlite Market Volume (Kilo Tons) and Value (US$ Mn) Forecast, by Application, 2018–2027
13.10.3. Brazil Commercial Perlite Market Volume (Kilo Tons) and Value (US$ Mn) Forecast, by End-use Industry, 2018–2027
13.10.4. Mexico Commercial Perlite Market Volume (Kilo Tons) and Value (US$ Mn) Forecast, by Type, 2018–2027
13.10.5. Mexico Commercial Perlite Market Volume (Kilo Tons) and Value (US$ Mn) Forecast, by Application, 2018–2027
13.10.6. Mexico Commercial Perlite Market Volume (Kilo Tons) and Value (US$ Mn) Forecast, by End-use Industry, 2018–2027
13.10.7. Rest of Latin America Commercial Perlite Market Volume (Kilo Tons) and Value (US$ Mn) Forecast, by Type, 2018–2027
13.10.8. Rest of Latin America Commercial Perlite Market Volume (Kilo Tons) and Value (US$ Mn) Forecast, by Application, 2018–2027
13.10.9. Rest of Latin America Commercial Perlite Market Volume (Kilo Tons) and Value (US$ Mn) Forecast, by End-use Industry, 2018–2027
14. Middle East & Africa Commercial Perlite Market Analysis and Forecast
14.1. Key Findings
14.2. Middle East & Africa Commercial Perlite Market Overview
14.3. Middle East & Africa Commercial Perlite Market Volume Share Analysis and Forecast, by Type, 2018 and 2027
14.4. Middle East & Africa Commercial Perlite Market Volume (Kilo Tons) and Value (US$ Mn) Forecast, by Type, 2018–2027
14.4.1. Unexpanded/Crude
14.4.2. Expanded
14.5. Middle East & Africa Commercial Perlite Market Volume Share Analysis and Forecast, by Application, 2018 and 2027
14.6. Middle East & Africa Commercial Perlite Market Volume (Kilo Tons) and Value (US$ Mn) Forecast, by Application, 2018–2027
14.6.1. Insulating Material
14.6.2. Filter Aid
14.6.3. Absorbent
14.6.4. Fertilizer
14.6.5. Others
14.7. Middle East & Africa Commercial Perlite Market Volume Share Analysis and Forecast, by End-use Industry, 2018 and 2027
14.8. Middle East & Africa Commercial Perlite Market Volume (Kilo Tons) and Value (US$ Mn) Forecast, by End-use Industry, 2018–2027
14.8.1. Building & Construction
14.8.2. Agriculture
14.8.2.1. Horticulture
14.8.2.2. Vermiculture
14.8.3. Food & Beverages
14.8.4. Pharmaceutical
14.8.5. Water Treatment
14.8.6. Others
14.9. Middle East & Africa Commercial Perlite Market Volume Share Analysis and Forecast, by Country and Sub-region, 2018 and 2027
14.10. Middle East & Africa Commercial Perlite Market Volume (Kilo Tons) and Value (US$ Mn) Forecast, by Country and Sub-region, 2018–2027
14.10.1. GCC Commercial Perlite Market Volume (Kilo Tons) and Value (US$ Mn) Forecast, by Type, 2018–2027
14.10.2. GCC Commercial Perlite Market Volume (Kilo Tons) and Value (US$ Mn) Forecast, by Application, 2018–2027
14.10.3. GCC Commercial Perlite Market Volume (Kilo Tons) and Value (US$ Mn) Forecast, by End-use Industry, 2018–2027
14.10.4. South Africa Commercial Perlite Market Volume (Kilo Tons) and Value (US$ Mn) Forecast, by Type, 2018–2027
14.10.5. South Africa Commercial Perlite Market Volume (Kilo Tons) and Value (US$ Mn) Forecast, by Application, 2018–2027
14.10.6. South Africa Commercial Perlite Market Volume (Kilo Tons) and Value (US$ Mn) Forecast, by End-use Industry, 2018–2027
14.10.7. Rest of Middle East & Africa Commercial Perlite Market Volume (Kilo Tons) and Value (US$ Mn) Forecast, by Type, 2018–2027
14.10.8. Rest of Middle East & Africa Commercial Perlite Market Volume (Kilo Tons) and Value (US$ Mn) Forecast, by Application, 2018–2027
14.10.9. Rest of Middle East & Africa Commercial Perlite Market Volume (Kilo Tons) and Value (US$ Mn) Forecast, by End-use Industry, 2018–2027
15. Competition Landscape
15.1. Global Commercial Perlite Market Share Analysis, by Company (2018)
15.2. Company Profiles
15.2.1. IMERYS SA
15.2.1.1. Headquarters, Year of Establishment, Revenue, Key Management, Number of Employees
15.2.1.2. Company Description
15.2.1.3. Business Segments
15.2.1.4. Application
15.2.1.5. Revenue (US$ Bn) and Y-o-Y Growth (%), 2015–2018
15.2.1.6. Breakdown of Revenue, by Geography, 2018
15.2.1.7. Breakdown of Net Sales, by Business Segment, 2018
15.2.1.8. Key Developments
15.2.2. The Schundler Company
15.2.2.1. Headquarters, Year of Establishment, Revenue, Key Management, Number of Employees
15.2.2.2. Company Description
15.2.2.3. Business Segments
15.2.2.4. Application
15.2.2.5. Revenue (US$ Bn) and Y-o-Y Growth (%), 2015–2018
15.2.2.6. Breakdown of Revenue, by Geography, 2018
15.2.2.7. Breakdown of Net Sales, by Business Segment, 2018
15.2.2.8. Key Developments
15.2.3. U.S. Silica Holdings, Inc.
15.2.3.1. Headquarters, Year of Establishment, Revenue, Key Management, Number of Employees
15.2.3.2. Company Description
15.2.3.3. Business Segments
15.2.3.4. Application
15.2.3.5. Revenue (US$ Bn) and Y-o-Y Growth (%), 2015–2018
15.2.3.6. Breakdown of Revenue, by Geography, 2018
15.2.3.7. Breakdown of Net Sales, by Business Segment, 2018
15.2.3.8. Key Developments
15.2.4. Chemviron
15.2.4.1. Headquarters, Year of Establishment, Revenue, Key Management, Number of Employees
15.2.4.2. Company Description
15.2.4.3. Business Segments
15.2.4.4. Application
15.2.4.5. Revenue (US$ Bn) and Y-o-Y Growth (%), 2015–2018
15.2.4.6. Breakdown of Revenue, by Geography, 2018
15.2.4.7. Breakdown of Net Sales, by Business Segment, 2018
15.2.4.8. Key Developments
15.2.5. Aegean Perlite S.A.
15.2.5.1. Headquarters, Year of Establishment, Revenue, Key Management, Number of Employees
15.2.5.2. Company Description
15.2.5.3. Business Segments
15.2.5.4. Application
15.2.5.5. Revenue (US$ Bn) and Y-o-Y Growth (%), 2015–2018
15.2.5.6. Breakdown of Revenue, by Geography, 2018
15.2.5.7. Breakdown of Net Sales, by Business Segment, 2018
15.2.5.8. Key Developments
15.2.6. Dicalite Management Group, Inc.
15.2.6.1. Headquarters, Year of Establishment, Revenue, Key Management, Number of Employees
15.2.6.2. Company Description
15.2.6.3. Business Segments
15.2.6.4. Application
15.2.6.5. Revenue (US$ Bn) and Y-o-Y Growth (%), 2015–2018
15.2.6.6. Breakdown of Revenue, by Geography, 2018
15.2.6.7. Breakdown of Net Sales, by Business Segment, 2018
15.2.6.8. Key Developments
15.2.7. Dupre Minerals Limited
15.2.7.1. Headquarters, Year of Establishment, Revenue, Key Management, Number of Employees
15.2.7.2. Company Description
15.2.7.3. Business Segments
15.2.7.4. Application
15.2.7.5. Revenue (US$ Bn) and Y-o-Y Growth (%), 2015–2018
15.2.7.6. Breakdown of Revenue, by Geography, 2018
15.2.7.7. Breakdown of Net Sales, by Business Segment, 2018
15.2.7.8. Key Developments
15.2.8. Nordisk Perlite ApS
15.2.8.1. Headquarters, Year of Establishment, Revenue, Key Management, Number of Employees
15.2.8.2. Company Description
15.2.8.3. Business Segments
15.2.8.4. Application
15.2.8.5. Revenue (US$ Bn) and Y-o-Y Growth (%), 2015–2018
15.2.8.6. Breakdown of Revenue, by Geography, 2018
15.2.8.7. Breakdown of Net Sales, by Business Segment, 2018
15.2.8.8. Key Developments
15.2.9. Whittemore Company, Inc.
15.2.9.1. Headquarters, Year of Establishment, Revenue, Key Management, Number of Employees
15.2.9.2. Company Description
15.2.9.3. Business Segments
15.2.9.4. Application
15.2.9.5. Revenue (US$ Bn) and Y-o-Y Growth (%), 2015–2018
15.2.9.6. Breakdown of Revenue, by Geography, 2018
15.2.9.7. Breakdown of Net Sales, by Business Segment, 2018
15.2.9.8. Key Developments
15.2.10. Genper Expanded Perlite Industry Business Co.
15.2.10.1. Headquarters, Year of Establishment, Revenue, Key Management, Number of Employees
15.2.10.2. Company Description
15.2.10.3. Business Segments
15.2.10.4. Application
15.2.10.5. Revenue (US$ Bn) and Y-o-Y Growth (%), 2015–2018
15.2.10.6. Breakdown of Revenue, by Geography, 2018
15.2.10.7. Breakdown of Net Sales, by Business Segment, 2018
15.2.10.8. Key Developments
15.2.11. Bergama Mining Construction Machinery Perlite Industry & Trade Inc.
15.2.11.1. Headquarters, Year of Establishment, Revenue, Key Management, Number of Employees
15.2.11.2. Company Description
15.2.11.3. Business Segments
15.2.11.4. Application
15.2.11.5. Revenue (US$ Bn) and Y-o-Y Growth (%), 2015–2018
15.2.11.6. Breakdown of Revenue, by Geography, 2018
15.2.11.7. Breakdown of Net Sales, by Business Segment, 2018
15.2.11.8. Key Developments
15.2.12. Perlite Italiana Srl
15.2.12.1. Headquarters, Year of Establishment, Revenue, Key Management, Number of Employees
15.2.12.2. Company Description
15.2.12.3. Business Segments
15.2.12.4. Application
15.2.12.5. Revenue (US$ Bn) and Y-o-Y Growth (%), 2015–2018
15.2.12.6. Breakdown of Revenue, by Geography, 2018
15.2.12.7. Breakdown of Net Sales, by Business Segment, 2018
15.2.12.8. Key Developments
15.2.13. Silbrico Corporation
15.2.13.1. Headquarters, Year of Establishment, Revenue, Key Management, Number of Employees
15.2.13.2. Company Description
15.2.13.3. Business Segments
15.2.13.4. Application
15.2.13.5. Revenue (US$ Bn) and Y-o-Y Growth (%), 2015–2018
15.2.13.6. Breakdown of Revenue, by Geography, 2018
15.2.13.7. Breakdown of Net Sales, by Business Segment, 2018
15.2.13.8. Key Developments
15.2.14. Cornerstone Industrial Minerals Corporation
15.2.14.1. Headquarters, Year of Establishment, Revenue, Key Management, Number of Employees
15.2.14.2. Company Description
15.2.14.3. Business Segments
15.2.14.4. Application
15.2.14.5. Revenue (US$ Bn) and Y-o-Y Growth (%), 2015–2018
15.2.14.6. Breakdown of Revenue, by Geography, 2018
15.2.14.7. Breakdown of Net Sales, by Business Segment, 2018
15.2.14.8. Key Developments
16. Primary Research – Key Insights
17. Assumptions and Research Methodology
17.1. Report Assumptions
17.2. Secondary Sources and Acronyms Used
17.3. Research Methodology
List of Tables
Table 01: Global Commercial Perlite Market Volume (Kilo Tons) Forecast, by Type, 2018–2027
Table 02: Global Commercial Perlite Market Value (US$ Mn) Forecast, by Type, 2018–2027
Table 03: Global Commercial Perlite Market Volume (Kilo Tons) Forecast, by Application, 2018–2027
Table 04: Global Commercial Perlite Market Value (US$ Mn) Forecast, by Application, 2018–2027
Table 05: Global Commercial Perlite Market Volume (Kilo Tons) Forecast, by End-use Industry, 2018–2027
Table 06: Global Commercial Perlite Market Value (US$ Mn) Forecast, by End-use Industry, 2018–2027
Table 07: Global Commercial Perlite Market Volume (Kilo Tons) Forecast, by Region, 2018–2027
Table 08: Global Commercial Perlite Market Value (US$ Mn) Forecast, by Region, 2018–2027
Table 09: North America Commercial Perlite Market Volume (Kilo Tons) Forecast, by Type, 2018–2027
Table 10: North America Commercial Perlite Market Value (US$ Mn) Forecast, by Type, 2018–2027
Table 11: North America Commercial Perlite Market Volume (Kilo Tons) Forecast, by Application, 2018–2027
Table 12: North America Commercial Perlite Market Value (US$ Mn) Forecast, by Application, 2018–2027
Table 13: North America Commercial Perlite Market Volume (Kilo Tons) Forecast, by End-use Industry, 2018–2027
Table 14: North America Commercial Perlite Market Value (US$ Mn) Forecast, by End-use Industry, 2018–2027
Table 15: North America Commercial Perlite Market Volume (Kilo Tons) Forecast, by Country, 2018–2027
Table 16: North America Commercial Perlite Market Value (US$ Mn) Forecast, by Country, 2018–2027
Table 17: U.S. Commercial Perlite Market Volume (Kilo Tons) Forecast, by Type, 2018–2027
Table 18: U.S. Commercial Perlite Market Value (US$ Mn) Forecast, by Type, 2018–2027
Table 19: U.S. Commercial Perlite Market Volume (Kilo Tons) Forecast, by Application, 2018–2027
Table 20: U.S. Commercial Perlite Market Value (US$ Mn) Forecast, by Application, 2018–2027
Table 21: U.S. Commercial Perlite Market Volume (Kilo Tons) Forecast, by End-use Industry, 2018–2027
Table 22: U.S. Commercial Perlite Market Value (US$ Mn) Forecast, by End-use Industry, 2018–2027
Table 23: Canada Commercial Perlite Market Volume (Kilo Tons) Forecast, by Type, 2018–2027
Table 24: Canada Commercial Perlite Market Value (US$ Mn) Forecast, by Type, 2018–2027
Table 25: Canada Commercial Perlite Market Volume (Kilo Tons) Forecast, by Application, 2018–2027
Table 26: Canada Commercial Perlite Market Value (US$ Mn) Forecast, by Application, 2018–2027
Table 27: Canada Commercial Perlite Market Volume (Kilo Tons) Forecast, by End-use Industry, 2018–2027
Table 28: Canada Commercial Perlite Market Value (US$ Mn) Forecast, by End-use Industry, 2018–2027
Table 29: Europe Commercial Perlite Market Volume (Kilo Tons) Forecast, by Type, 2018–2027
Table 30: Europe Commercial Perlite Market Value (US$ Mn) Forecast, by Type, 2018–2027
Table 31: Europe Commercial Perlite Market Volume (Kilo Tons) Forecast, by Application, 2018–2027
Table 32: Europe Commercial Perlite Market Value (US$ Mn) Forecast, by Application, 2018–2027
Table 33: Europe Commercial Perlite Market Volume (Kilo Tons) Forecast, by End-use Industry, 2018–2027
Table 34: Europe Commercial Perlite Market Value (US$ Mn) Forecast, by End-use Industry, 2018–2027
Table 35: Europe Commercial Perlite Market Volume (Kilo Tons) Forecast, by Country and Sub-region, 2018–2027
Table 36: Europe Commercial Perlite Market Value (US$ Mn) Forecast, by Country and Sub-region, 2018–2027
Table 37: Germany Commercial Perlite Market Volume (Kilo Tons) Forecast, by Type, 2018–2027
Table 38: Germany Commercial Perlite Market Value (US$ Mn) Forecast, by Type, 2018–2027
Table 39: Germany Commercial Perlite Market Volume (Kilo Tons) Forecast, by Application, 2018–2027
Table 40: Germany Commercial Perlite Market Value (US$ Mn) Forecast, by Application, 2018–2027
Table 41: Germany Commercial Perlite Market Volume (Kilo Tons) Forecast, by End-use Industry, 2018–2027
Table 42: Germany Commercial Perlite Market Value (US$ Mn) Forecast, by End-use Industry, 2018–2027
Table 43: U.K. Commercial Perlite Market Volume (Kilo Tons) Forecast, by Type, 2018–2027
Table 44: U.K. Commercial Perlite Market Value (US$ Mn) Forecast, by Type, 2018–2027
Table 45: U.K. Commercial Perlite Market Volume (Kilo Tons) Forecast, by Application, 2018–2027
Table 46: U.K. Commercial Perlite Market Value (US$ Mn) Forecast, by Application, 2018–2027
Table 47: U.K. Commercial Perlite Market Volume (Kilo Tons) Forecast, by End-use Industry, 2018–2027
Table 48: U.K. Commercial Perlite Market Value (US$ Mn) Forecast, by End-use Industry, 2018–2027
Table 49: France Commercial Perlite Market Volume (Kilo Tons) Forecast, by Type, 2018–2027
Table 50: France Commercial Perlite Market Value (US$ Mn) Forecast, by Type, 2018–2027
Table 51: France Commercial Perlite Market Volume (Kilo Tons) Forecast, by Application, 2018–2027
Table 52: France Commercial Perlite Market Value (US$ Mn) Forecast, by Application, 2018–2027
Table 53: France Commercial Perlite Market Volume (Kilo Tons) Forecast, by End-use Industry, 2018–2027
Table 54: France Commercial Perlite Market Value (US$ Mn) Forecast, by End-use Industry, 2018–2027
Table 55: Italy Commercial Perlite Market Volume (Kilo Tons) Forecast, by Type, 2018–2027
Table 56: Italy Commercial Perlite Market Value (US$ Mn) Forecast, by Type, 2018–2027
Table 57: Italy Commercial Perlite Market Volume (Kilo Tons) Forecast, by Application, 2018–2027
Table 58: Italy Commercial Perlite Market Value (US$ Mn) Forecast, by Application, 2018–2027
Table 59: Italy Commercial Perlite Market Volume (Kilo Tons) Forecast, by End-use Industry, 2018–2027
Table 60: Italy Commercial Perlite Market Value (US$ Mn) Forecast, by End-use Industry, 2018–2027
Table 61: Spain Commercial Perlite Market Volume (Kilo Tons) Forecast, by Type, 2018–2027
Table 62: Spain Commercial Perlite Market Value (US$ Mn) Forecast, by Type, 2018–2027
Table 63: Spain Commercial Perlite Market Volume (Kilo Tons) Forecast, by Application, 2018–2027
Table 64: Spain Commercial Perlite Market Value (US$ Mn) Forecast, by Application, 2018–2027
Table 65: Spain Commercial Perlite Market Volume (Kilo Tons) Forecast, by End-use Industry, 2018–2027
Table 66: Spain Commercial Perlite Market Value (US$ Mn) Forecast, by End-use Industry, 2018–2027
Table 67: Greece Commercial Perlite Market Volume (Kilo Tons) Forecast, by Type, 2018–2027
Table 68: Greece Commercial Perlite Market Value (US$ Mn) Forecast, by Type, 2018–2027
Table 69: Greece Commercial Perlite Market Volume (Kilo Tons) Forecast, by Application, 2018–2027
Table 70: Greece Commercial Perlite Market Value (US$ Mn) Forecast, by Application, 2018–2027
Table 71: Greece Commercial Perlite Market Volume (Kilo Tons) Forecast, by End-use Industry, 2018–2027
Table 72: Greece Commercial Perlite Market Value (US$ Mn) Forecast, by End-use Industry, 2018–2027
Table 73: Turkey Commercial Perlite Market Volume (Kilo Tons) Forecast, by Type, 2018–2027
Table 74: Turkey Commercial Perlite Market Value (US$ Mn) Forecast, by Type, 2018–2027
Table 75: Turkey Commercial Perlite Market Volume (Kilo Tons) Forecast, by Application, 2018–2027
Table 76: Turkey Commercial Perlite Market Value (US$ Mn) Forecast, by Application, 2018–2027
Table 77: Turkey Commercial Perlite Market Volume (Kilo Tons) Forecast, by End-use Industry, 2018–2027
Table 78: Turkey Commercial Perlite Market Value (US$ Mn) Forecast, by End-use Industry, 2018–2027
Table 79: Russia & CIS Commercial Perlite Market Volume (Kilo Tons) Forecast, by Type, 2018–2027
Table 80: Russia & CIS Commercial Perlite Market Value (US$ Mn) Forecast, by Type, 2018–2027
Table 81: Russia & CIS Commercial Perlite Market Volume (Kilo Tons) Forecast, by Application, 2018–2027
Table 82: Russia & CIS Commercial Perlite Market Value (US$ Mn) Forecast, by Application, 2018–2027
Table 83: Russia & CIS Commercial Perlite Market Volume (Kilo Tons) Forecast, by End-use Industry, 2018–2027
Table 84: Russia & CIS Commercial Perlite Market Value (US$ Mn) Forecast, by End-use Industry, 2018–2027
Table 85: Rest of Europe Commercial Perlite Market Volume (Kilo Tons) Forecast, by Type, 2018–2027
Table 86: Rest of Europe Commercial Perlite Market Value (US$ Mn) Forecast, by Type, 2018–2027
Table 87: Rest of Europe Commercial Perlite Market Volume (Kilo Tons) Forecast, by Application, 2018–2027
Table 88: Rest of Europe Commercial Perlite Market Value (US$ Mn) Forecast, by Application, 2018–2027
Table 89: Rest of Europe Commercial Perlite Market Volume (Kilo Tons) Forecast, by End-use Industry, 2018–2027
Table 90: Rest of Europe Commercial Perlite Market Value (US$ Mn) Forecast, by End-use Industry, 2018–2027
Table 91: Asia Pacific Commercial Perlite Market Volume (Kilo Tons) Forecast, by Type, 2018–2027
Table 92: Asia Pacific Commercial Perlite Market Value (US$ Mn) Forecast, by Type, 2018–2027
Table 93: Asia Pacific Commercial Perlite Market Volume (Kilo Tons) Forecast, by Application, 2018–2027
Table 94: Asia Pacific Commercial Perlite Market Value (US$ Mn) Forecast, by Application, 2018–2027
Table 95: Asia Pacific Commercial Perlite Market Volume (Kilo Tons) Forecast, by End-use Industry, 2018–2027
Table 96: Asia Pacific Commercial Perlite Market Value (US$ Mn) Forecast, by End-use Industry, 2018–2027
Table 97: Asia Pacific Commercial Perlite Market Volume (Kilo Tons) Forecast, by Country and Sub-region, 2018–2027
Table 98: Asia Pacific Commercial Perlite Market Value (US$ Mn) Forecast, by Country and Sub-region, 2018–2027
Table 99: China Commercial Perlite Market Volume (Kilo Tons) Forecast, by Type, 2018–2027
Table 100: China Commercial Perlite Market Value (US$ Mn) Forecast, by Type, 2018–2027
Table 101: China Commercial Perlite Market Volume (Kilo Tons) Forecast, by Application, 2018–2027
Table 102: China Commercial Perlite Market Value (US$ Mn) Forecast, by Application, 2018–2027
Table 103: China Commercial Perlite Market Volume (Kilo Tons) Forecast, by End-use Industry, 2018–2027
Table 104: China Commercial Perlite Market Value (US$ Mn) Forecast, by End-use Industry, 2018–2027
Table 105: India Commercial Perlite Market Volume (Kilo Tons) Forecast, by Type, 2018–2027
Table 106: India Commercial Perlite Market Value (US$ Mn) Forecast, by Type, 2018–2027
Table 107: India Commercial Perlite Market Volume (Kilo Tons) Forecast, by Application, 2018–2027
Table 108: India Commercial Perlite Market Value (US$ Mn) Forecast, by Application, 2018–2027
Table 109: India Commercial Perlite Market Volume (Kilo Tons) Forecast, by End-use Industry, 2018–2027
Table 110: India Commercial Perlite Market Value (US$ Mn) Forecast, by End-use Industry, 2018–2027
Table 111: Japan Commercial Perlite Market Volume (Kilo Tons) Forecast, by Type, 2018–2027
Table 112: Japan Commercial Perlite Market Value (US$ Mn) Forecast, by Type, 2018–2027
Table 113: Japan Commercial Perlite Market Volume (Kilo Tons) Forecast, by Application, 2018–2027
Table 114: Japan Commercial Perlite Market Value (US$ Mn) Forecast, by Application, 2018–2027
Table 115: Japan Commercial Perlite Market Volume (Kilo Tons) Forecast, by End-use Industry, 2018–2027
Table 116: Japan Commercial Perlite Market Value (US$ Mn) Forecast, by End-use Industry, 2018–2027
Table 117: ASEAN Commercial Perlite Market Volume (Kilo Tons) Forecast, by Type, 2018–2027
Table 118: ASEAN Commercial Perlite Market Value (US$ Mn) Forecast, by Type, 2018–2027
Table 119: ASEAN Commercial Perlite Market Volume (Kilo Tons) Forecast, by Application, 2018–2027
Table 120: ASEAN Commercial Perlite Market Value (US$ Mn) Forecast, by Application, 2018–2027
Table 121: ASEAN Commercial Perlite Market Volume (Kilo Tons) Forecast, by End-use Industry, 2018–2027
Table 122: ASEAN Commercial Perlite Market Value (US$ Mn) Forecast, by End-use Industry, 2018–2027
Table 123: Rest of Asia Pacific Commercial Perlite Market Volume (Kilo Tons) Forecast, by Type, 2018–2027
Table 124: Rest of Asia Pacific Commercial Perlite Market Value (US$ Mn) Forecast, by Type, 2018–2027
Table 125: Rest of Asia Pacific Commercial Perlite Market Volume (Kilo Tons) Forecast, by Application, 2018–2027
Table 126: Rest of Asia Pacific Commercial Perlite Market Value (US$ Mn) Forecast, by Application, 2018–2027
Table 127: Rest of Asia Pacific Commercial Perlite Market Volume (Kilo Tons) Forecast, by End-use Industry, 2018–2027
Table 128: Rest of Asia Pacific Commercial Perlite Market Value (US$ Mn) Forecast, by End-use Industry, 2018–2027
Table 129: Latin America Commercial Perlite Market Volume (Kilo Tons) Forecast, by Type, 2018–2027
Table 130: Latin America Commercial Perlite Market Value (US$ Mn) Forecast, by Type, 2018–2027
Table 131: Latin America Commercial Perlite Market Volume (Kilo Tons) Forecast, by Application, 2018–2027
Table 132: Latin America Commercial Perlite Market Value (US$ Mn) Forecast, by Application, 2018–2027
Table 133: Latin America Commercial Perlite Market Volume (Kilo Tons) Forecast, by End-use Industry, 2018–2027
Table 134: Latin America Commercial Perlite Market Value (US$ Mn) Forecast, by End-use Industry, 2018–2027
Table 135: Latin America Commercial Perlite Market Volume (Kilo Tons) Forecast, by Country and Sub-region, 2018–2027
Table 136: Latin America Commercial Perlite Market Value (US$ Mn) Forecast, by Country and Sub-region, 2018–2027
Table 137: Brazil Commercial Perlite Market Volume (Kilo Tons) Forecast, by Type, 2018–2027
Table 138: Brazil Commercial Perlite Market Value (US$ Mn) Forecast, by Type, 2018–2027
Table 139: Brazil Commercial Perlite Market Volume (Kilo Tons) Forecast, by Application, 2018–2027
Table 140: Brazil Commercial Perlite Market Value (US$ Mn) Forecast, by Application, 2018–2027
Table 141: Brazil Commercial Perlite Market Volume (Kilo Tons) Forecast, by End-use Industry, 2018–2027
Table 142: Brazil Commercial Perlite Market Value (US$ Mn) Forecast, by End-use Industry, 2018–2027
Table 143: Mexico Commercial Perlite Market Volume (Kilo Tons) Forecast, by Type, 2018–2027
Table 144: Mexico Commercial Perlite Market Value (US$ Mn) Forecast, by Type, 2018–2027
Table 145: Mexico Commercial Perlite Market Volume (Kilo Tons) Forecast, by Application, 2018–2027
Table 146: Mexico Commercial Perlite Market Value (US$ Mn) Forecast, by Application, 2018–2027
Table 147: Mexico Commercial Perlite Market Volume (Kilo Tons) Forecast, by End-use Industry, 2018–2027
Table 148: Mexico Commercial Perlite Market Value (US$ Mn) Forecast, by End-use Industry, 2018–2027
Table 149: Rest of Latin America Commercial Perlite Market Volume (Kilo Tons) Forecast, by Type, 2018–2027
Table 150: Rest of Latin America Commercial Perlite Market Value (US$ Mn) Forecast, by Type, 2018–2027
Table 151: Rest of Latin America Commercial Perlite Market Volume (Kilo Tons) Forecast, by Application, 2018–2027
Table 152: Rest of Latin America Commercial Perlite Market Value (US$ Mn) Forecast, by Application, 2018–2027
Table 153: Rest of Latin America Commercial Perlite Market Volume (Kilo Tons) Forecast, by End-use Industry, 2018–2027
Table 154: Rest of Latin America Commercial Perlite Market Value (US$ Mn) Forecast, by End-use Industry, 2018–2027
Table 155: Middle East & Africa Commercial Perlite Market Volume (Kilo Tons) Forecast, by Type, 2018–2027
Table 156: Middle East & Africa Commercial Perlite Market Value (US$ Mn) Forecast, by Type, 2018–2027
Table 157: Middle East & Africa Commercial Perlite Market Volume (Kilo Tons) Forecast, by Application, 2018–2027
Table 158: Middle East & Africa Commercial Perlite Market Value (US$ Mn) Forecast, by Application, 2018–2027
Table 159: Middle East & Africa Commercial Perlite Market Volume (Kilo Tons) Forecast, by End-use Industry, 2018–2027
Table 160: Middle East & Africa Commercial Perlite Market Value (US$ Mn) Forecast, by End-use Industry, 2018–2027
Table 161: Middle East & Africa Commercial Perlite Market Volume (Kilo Tons) Forecast, by Country and Sub-region, 2018–2027
Table 162: Middle East & Africa Commercial Perlite Market Value (US$ Mn) Forecast, by Country and Sub-region, 2018–2027
Table 163: GCC Commercial Perlite Market Volume (Kilo Tons) Forecast, by Type, 2018–2027
Table 164: GCC Commercial Perlite Market Value (US$ Mn) Forecast, by Type, 2018–2027
Table 165: GCC Commercial Perlite Market Volume (Kilo Tons) Forecast, by Application, 2018–2027
Table 166: GCC Commercial Perlite Market Value (US$ Mn) Forecast, by Application, 2018–2027
Table 167: GCC Commercial Perlite Market Volume (Kilo Tons) Forecast, by End-use Industry, 2018–2027
Table 168: GCC Commercial Perlite Market Value (US$ Mn) Forecast, by End-use Industry, 2018–2027
Table 169: South Africa Commercial Perlite Market Volume (Kilo Tons) Forecast, by Type, 2018–2027
Table 170: South Africa Commercial Perlite Market Value (US$ Mn) Forecast, by Type, 2018–2027
Table 171: South Africa Commercial Perlite Market Volume (Kilo Tons) Forecast, by Application, 2018–2027
Table 172: South Africa Commercial Perlite Market Value (US$ Mn) Forecast, by Application, 2018–2027
Table 173: South Africa Commercial Perlite Market Volume (Kilo Tons) Forecast, by End-use Industry, 2018–2027
Table 174: South Africa Commercial Perlite Market Value (US$ Mn) Forecast, by End-use Industry, 2018–2027
Table 175: Rest of Middle East & Africa Commercial Perlite Market Volume (Kilo Tons) Forecast, by Type, 2018–2027
Table 176: Rest of Middle East & Africa Commercial Perlite Market Value (US$ Mn) Forecast, by Type, 2018–2027
Table 177: Rest of Middle East & Africa Commercial Perlite Market Volume (Kilo Tons) Forecast, by Application, 2018–2027
Table 178: Rest of Middle East & Africa Commercial Perlite Market Value (US$ Mn) Forecast, by Application, 2018–2027
Table 179: Rest of Middle East & Africa Commercial Perlite Market Volume (Kilo Tons) Forecast, by End-use Industry, 2018–2027
Table 180: Rest of Middle East & Africa Commercial Perlite Market Value (US$ Mn) Forecast, by End-use Industry, 2018–2027
List of Figures
Figure 01: Global Commercial Perlite Market Volume Share Analysis, by Type
Figure 02: Global Commercial Perlite Market Attractiveness Analysis, by Type
Figure 03: Global Commercial Perlite Market Value (US$ Mn) and Volume (Kilo Tons), 2018–2027
Figure 04: Global Commercial Perlite Market Volume Share Analysis, by Application
Figure 05: Global Commercial Perlite Market Attractiveness Analysis, by Application
Figure 06: Global Commercial Perlite Market Volume Share Analysis, by End-use Industry
Figure 07: Global Commercial Perlite Market Attractiveness Analysis, by End-use Industry
Figure 08: Global Commercial Perlite Market Volume Share Analysis, by Region
Figure 09: Global Commercial Perlite Market Attractiveness Analysis, by Region
Figure 10: North America Commercial Perlite Market Volume Share Analysis, by Type, 2018 and 2027
Figure 11: North America Commercial Perlite Market Volume Share Analysis, by Application, 2018 and 2027
Figure 12: North America Commercial Perlite Market Volume Share Analysis, by End-use Industry, 2018 and 2027
Figure 13: North America Commercial Perlite Market Volume Share Analysis, by Country, 2018 and 2027
Figure 14: North America Commercial Perlite Market Attractiveness Analysis, by Country
Figure 15: North America Commercial Perlite Market Attractiveness Analysis, by Type
Figure 16: North America Commercial Perlite Market Attractiveness Analysis, by Application
Figure 17: North America Commercial Perlite Market Attractiveness Analysis, by End-use Industry
Figure 18: Europe Commercial Perlite Market Volume Share Analysis, by Type, 2018 and 2027
Figure 19: Europe Commercial Perlite Market Volume Share Analysis, by Application, 2018 and 2027
Figure 20: Europe Commercial Perlite Market Volume Share Analysis, by End-use Industry, 2018 and 2027
Figure 21: Europe Commercial Perlite Market Volume Share Analysis, by Country and Sub-region
Figure 22: Europe Commercial Perlite Market Attractiveness Analysis, by Country and Sub-region
Figure 23: Europe Commercial Perlite Market Attractiveness Analysis, by Type
Figure 24: Europe Commercial Perlite Market Attractiveness Analysis, by Application
Figure 25: Europe Commercial Perlite Market Attractiveness Analysis, by End-use Industry
Figure 26: Asia Pacific Commercial Perlite Market Volume Share Analysis, by Type, 2018 and 2027
Figure 27: Asia Pacific Commercial Perlite Market Volume Share Analysis, by Application, 2018 and 2027
Figure 28: Asia Pacific Commercial Perlite Market Volume Share Analysis, by End-use Industry, 2018 and 2027
Figure 29: Asia Pacific Commercial Perlite Market Volume Share Analysis, by Country and Sub-region, 2018 and 2027
Figure 30: Asia Pacific Commercial Perlite Market Attractiveness Analysis, by Country and Sub-region
Figure 31: Asia Pacific Commercial Perlite Market Attractiveness Analysis, by Type
Figure 32: Asia Pacific Commercial Perlite Market Attractiveness Analysis, by Application
Figure 33: Asia Pacific Commercial Perlite Market Attractiveness Analysis, by End-use Industry
Figure 34: Latin America Commercial Perlite Market Volume Share Analysis, by Type, 2018 and 2027
Figure 35: Latin America Commercial Perlite Market Volume Share Analysis, by Application, 2018 and 2027
Figure 36: Latin America Commercial Perlite Market Volume Share Analysis, by End-use Industry, 2018 and 2027
Figure 37: Latin America Commercial Perlite Market Volume Share Analysis, by Country, 2018 and 2027
Figure 38: Latin America Commercial Perlite Market Attractiveness Analysis, by Country and Sub-region
Figure 39: Latin America Commercial Perlite Market Attractiveness Analysis, by Type
Figure 40: Latin America Commercial Perlite Market Attractiveness Analysis, by Application
Figure 41: Latin America Commercial Perlite Market Attractiveness Analysis, by End-use Industry
Figure 42: Middle East & Africa Commercial Perlite Market Volume Share Analysis, by Type, 2018 and 2027
Figure 43: Middle East & Africa Commercial Perlite Market Volume Share Analysis, by Application, 2018 and 2027
Figure 44: Middle East & Africa Commercial Perlite Market Volume Share Analysis, by End-use Industry, 2018 and 2027
Figure 45: Middle East & Africa Commercial Perlite Market Volume Share Analysis, by Country and Sub-region, 2018 and 2027
Figure 46: Middle East & Africa Commercial Perlite Market Attractiveness Analysis, by Country and Sub-region
Figure 47: Middle East & Africa Commercial Perlite Market Attractiveness Analysis, by Type
Figure 48: Middle East & Africa Commercial Perlite Market Attractiveness Analysis, by Application
Figure 49: Middle East & Africa Commercial Perlite Market Attractiveness Analysis, by End-use Industry
Figure 50: Global Commercial Perlite Market Share Analysis, by Company, 2018
Copyright © Transparency Market Research, Inc. All Rights reserved
Trust Online

Commercial Perlite Market