
Reports
Reports
Analysts’ Viewpoint on Coffee Packaging Market Scenario
The global coffee packaging market drivers include a rise in the demand for coffee among the generation Z, consumer preference toward sustainable beverage packaging, innovations by manufacturers, and favorable manufacturing policies. Additionally, the launch of new flavors of coffee by brands in the market augments the sales of coffee packaging. Leading players in the coffee packaging market should focus on maintaining the quality of the packaging and should manufacture the packaging in sustainable materials in order to increase their market share.
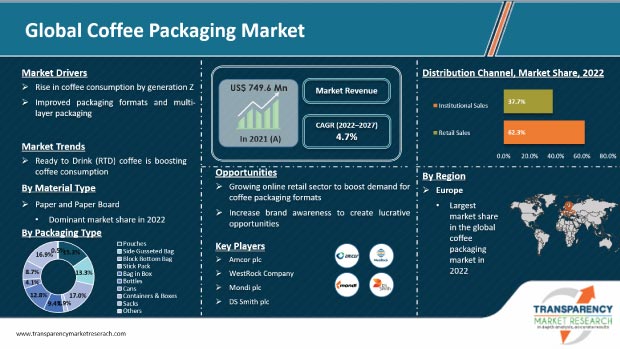
The coffee packaging market sales analysis reveals that the impossible to satisfy thirst for coffee among the generation Z population is a key contributor to an increase in the demand for coffee worldwide. People in the U.S. develop a taste for caffeine at a younger age, and this is rapidly increasing their daily consumption of coffee. Drinking coffee in college has evolved into a social occasion and fashion statement. Coffee packaging changes in response to changing consumer demands owing to a rise in the demand for coffee. The coffee packaging market demand analysis indicates that the last decade witnessed an increase in the global coffee consumption culture due to growth of worldwide coffee chains such as Starbucks, Costa Coffee, and Dunkin Donuts among many other brands. Therefore, each of the reasons mentioned above is actively boosting the long-term growth of the global market for coffee packaging.
Before COVID19, top companies achieved their targets and focused on the research and development of coffee packaging. However, the coronavirus pandemic hampered several industries in different countries, especially the packaging industry. The coffee packaging market was less affected than other industries globally, as coffee is one of the essential beverages. The coffee packaging market growth forecast is marginally negative, because the demand from manufacturers or distributors around the world has not been met.
In 2021, manufacturers in various countries were able to resume production activities after lifting of the blockade and decided on various master plans to boost sales of coffee packaging. Therefore, the coffee packaging market is expected to almost double by 2027.
Ready-to-drink (RTD) coffee is gaining popularity due to its low-calorie content and growing concerns about obesity and other health issues. Over half of all RTD coffee sales still take place in industrialized countries, making it one of the biggest soft drink categories worldwide.
Goods similar to energy drinks, such as Monster Energy, typically come in metal cans; however, metal can sales are declining. A key factor boosting the demand for RTD is its appeal among young consumers, while brands that try to meet the expectations of their customers in terms of products typically utilize cans because they are made to be consumed in one sitting.
Increase in customer preference toward recyclable packaging material is commendable, which manufacturers are using to target the right audience. Majority of coffee packaging material was plastic; however, it has been shifting to paper and other sustainable packaging materials. Plastic packaging material are difficult to recycle and do not decompose easily. Pouches made from barrier-coated paper and aluminum are key trends witnessed in the global coffee packaging market. Paper and metal segments, cumulatively, are expected to hold almost 65% share of the global coffee packaging market by 2027.
Expanding economies, such as China and India, account for around 58% share of the APAC coffee packaging market. According to key insights presented by the Coffee Board of India, as a developing nation, India held a global market share of around 3.3% in the production of coffee in the year 2020-2021, and India also registered a total export of coffee of around 5.1% in the same year. Approximately 700,000 people were directly engaged with the coffee industry in India. India exported 300,000 tons of coffee in the world market, which generated a revenue of around US$ 725 Mn in 2021-2022. The highest consumption of Indian coffee is in Italy and Germany, which accounts for around 24% of the total global consumption. Developing countries in Asia Pacific are expected to account for around 15% of the global coffee packaging market by 2027.
The most commonly used packaging types in coffee packaging are bags and pouches, as these packaging types are lightweight, flexible, and space-saving, especially for coffee packaging.
They are also used to keep the package fresh and prevent it from tearing. Bags and pouches use 75% less material than other types of packages. These packaging types are multi-layered to prevent spillage and damage. For instance, the outer layer is often paper and the inner layer is aluminum. This helps roasters balance brand esthetics and practicality when choosing a package.
The paper and paper board segment is likely to account for a notable share of approximately 45% of the total market share in 2022. This is because of the advantage and benefits it offers, and it is recycled and environment-friendly. The paper segment of the coffee packaging market is increasing at a significant pace, and it is estimated to grow 1.3x during the forecast period.
Paper is used because it minimizes the usage and wastage of resources and is cost-effective in packaging products. There are various types of paper available on the market, such as paper coffee packaging with valves, paper coffee bags with windows, etc. The paper and paper board segment of the coffee packaging market is expected to grow at a CAGR of 4.8% during the forecast period.
Europe is expected to dominate the global market and expand 1.2x its current market value by the end of the forecast period. This region is anticipated to hold around 30% share of the global market by 2027.
The coffee packaging market in APAC is rising at a consistent pace due to the low cost of the coffee packaging offered by manufacturers based in APAC as compared to that in other regions.
Asia Pacific is a lucrative market for coffee packaging and the market is estimated to rise at a notable CAGR of 6.6% during the forecast period, owing to the high demand for coffee from the food & beverage and personal care industries operating in the region.
The coffee packaging market report concludes with the company profiles section, which includes key information about major players in the global coffee packaging market
Leading players analyzed in the report include Amcor plc, Westrock Company Mondi plc, DS Smith plc, ProAmpac LLC, Crown Holdings, Inc., Sonoco Products Company, Graham Packaging Company, Novolex Holdings, Inc., Winpack Ltd., Goglio Spa, Co-Pack Inc., PBFY Flexible Packaging, Constantia Flexibles Group GmbH, Glenroy, Inc., Shenzhen Packmate Packaging Co., Ltd., Swiss Pack, Huhtamäki Oyj, Syntegon, and Roastar.
Each of these players has been profiled in the coffee packaging market report based on parameters such as company overview, financial overview, business strategies, application portfolio, business segments, and recent developments.
|
Attribute |
Detail |
|
Market Size Value in 2021 |
US$ 749.6 Mn |
|
Market Forecast Value in 2027 |
US$ 991.6 Mn |
|
Growth Rate (CAGR) |
4.7% from Year-to-Year |
|
Forecast Period |
2022–2027 |
|
Quantitative Units |
US$ Mn for Value |
|
Market Analysis |
It includes cross segment analysis at global as well as regional level. Moreover, qualitative analysis includes drivers, restraints, opportunities, key trends, and parent industry overview. |
|
Competition Landscape |
|
|
Format |
Electronic (PDF) + Excel |
|
Market Segmentation |
|
|
Regions Covered |
|
|
Countries Covered |
|
|
Companies Profiled |
|
|
Customization Scope |
Available upon request |
|
Pricing |
Available upon request |
The coffee packaging market was valued at US$ 749.6 Mn in 2021 and is expected to exceed US$ 991.6 Mn by 2027.
The coffee packaging market is expected to grow at a CAGR of 4.7 % during the forecast period.
Increase in preference of coffee among generation Z and shift in consumer preference toward ready-to-drink (RTD) coffee.
The coffee packaging market in Asia Pacific is likely to expand at the fastest CAGR during the forecast period.
The paper and paper board segment is likely to generate highest revenue by 2027.
In terms of packaging type, the block bottom bag segment is projected to hold maximum market share of the global coffee packaging market.
Amcor plc, Westrock Company Mondi plc, DS Smith plc, ProAmpac LLC, Crown Holdings, Inc., Sonoco Products Company, Graham Packaging Company, Novolex Holdings, Inc., Winpack Ltd., Goglio Spa, Co-Pack Inc., PBFY Flexible Packaging, Constantia Flexibles Group GmbH, Glenroy, Inc., Shenzhen Packmate Packaging Co., Ltd., Swiss Pack, Huhtamäki Oyj, Syntegon, and Roastar.
1. Executive Summary
2. Market Introduction
2.1. Market Definition
2.2. Market Taxonomy
3. Market Dynamics
3.1. Drivers
3.2. Restraints
3.3. Opportunity
3.4. Trends
3.5. Value Chain Analysis
4. Coffee Packaging Market Overview
4.1. Introduction
4.2. Global Packaging Industry Outlook
4.3. Global Rigid Packaging Market Outlook
4.4. Wheel of Fortune
5. Global Coffee Packaging Market Analysis and Forecast, by Packaging Type
5.1. Introduction
5.1.1. Market share and Basis Points (BPS) Analysis, by Packaging Type
5.1.2. Y-o-Y Growth Projections, by Packaging Type
5.2. Market Value (US$ Mn) and Volume (Tons) Forecast, by Packaging Type
5.2.1. Pouches
5.2.1.1. Stand Up Pouches
5.2.1.2. Flat Pouches
5.2.2. Side Gusseted Bag
5.2.3. Block Bottom Bag
5.2.4. Stick Pack
5.2.5. Bag-in-Box
5.2.6. Bottles
5.2.7. Cans
5.2.8. Containers & Boxes
5.2.9. Sacks
5.2.10. Others
5.3. Market Attractiveness Analysis, by Packaging Type
6. Global Coffee Packaging Market Analysis and Forecast, by Material Type
6.1. Introduction
6.1.1. Market share and Basis Points (BPS) Analysis, by Material Type
6.1.2. Y-o-Y Growth Projections, by Material Type
6.2. Market Value (US$ Mn) and Volume (Tons) Forecast, by Material Type
6.2.1. Plastic
6.2.1.1. Polyethylene
6.2.1.2. Polypropylene
6.2.1.3. Polyethylene Terephthalate
6.2.1.4. Others
6.2.2. Metal
6.2.3. Paper and Paper Board
6.2.4. Glass
6.2.5. Others
6.3. Market Attractiveness Analysis, by Material Type
7. Global Coffee Packaging Market Analysis and Forecast, by Distribution Channel
7.1. Introduction
7.1.1. Market share and Basis Points (BPS) Analysis, by Distribution Channel
7.1.2. Y-o-Y Growth Projections, by Distribution Channel
7.2. Market Value (US$ Mn) and Volume (Tons) Forecast, by Distribution Channel
7.2.1. Retail Sales
7.2.2. Institutional Sales
7.3. Market Attractiveness Analysis, by Distribution Channel
8. Global Coffee Packaging Market Analysis and Forecast, by Region
8.1. Introduction
8.1.1. Coffee Packaging Market, by Region: Snapshot 2017
8.1.2. Market share and Basis Points (BPS) Analysis, by Region
8.1.3. Y-o-Y Growth Projections, by Region
8.2. Market Value (US$ Mn) and Volume (Tons) Forecast, by Region
8.2.1. North America
8.2.2. Europe
8.2.3. Asia Pacific (APAC)
8.2.4. Latin America
8.2.5. Middle East & Africa (MEA)
8.3. Market Attractiveness Analysis, by Region
9. North America Coffee Packaging Market Analysis and Forecast
9.1. Introduction
9.1.1. Market share and Basis Points (BPS) Analysis, by Country
9.1.2. Y-o-Y Growth Projections, by Country
9.2. Market Value (US$ Mn) and Volume (Tons) Forecast, by Country
9.2.1. U.S.
9.2.2. Canada
9.3. Market Value (US$ Mn) and Volume (Tons) Forecast, by Packaging Type
9.3.1. Pouches
9.3.1.1. Stand Up Pouches
9.3.1.2. Flat Pouches
9.3.2. Side Gusseted Bag
9.3.3. Block Bottom Bag
9.3.4. Stick Pack
9.3.5. Bag-in-Box
9.3.6. Bottles
9.3.7. Cans
9.3.8. Containers & Boxes
9.3.9. Sacks
9.3.10. Others
9.4. Market Value (US$ Mn) and Volume (Tons) Forecast, by Material Type
9.4.1. Plastic
9.4.1.1. Polyethylene
9.4.1.2. Polypropylene
9.4.1.3. Polyethylene Terephthalate
9.4.1.4. Others
9.4.2. Metal
9.4.3. Paper and Paper Board
9.4.4. Glass
9.4.5. Others
9.5. Market Value (US$ Mn) and Volume (Tons) Forecast, by Distribution Channel
9.5.1. Retail Sales
9.5.2. Institutional Sales
9.6. Market Attractiveness Analysis
9.6.1. By Country
9.6.2. By Packaging Type
9.6.3. By Material Type
9.6.4. By Distribution Channel
10. Europe Coffee Packaging Market Analysis and Forecast
10.1. Introduction
10.1.1. Market share and Basis Points (BPS) Analysis, by Country and Sub-region
10.1.2. Y-o-Y Growth Projections, by Country
10.2. Market Value (US$ Mn) and Volume (Tons) Forecast, by Country and Sub-region
10.2.1. Germany
10.2.2. Italy
10.2.3. France
10.2.4. U.K.
10.2.5. Spain
10.2.6. Benelux
10.2.7. Nordic
10.2.8. Russia
10.2.9. Poland
10.2.10. Rest of Europe
10.3. Market Value (US$ Mn) and Volume (Tons) Forecast, by Packaging Type
10.3.1. Pouches
10.3.1.1. Stand Up Pouches
10.3.1.2. Flat Pouches
10.3.2. Side Gusseted Bag
10.3.3. Block Bottom Bag
10.3.4. Stick Pack
10.3.5. Bag-in-Box
10.3.6. Bottles
10.3.7. Cans
10.3.8. Containers & Boxes
10.3.9. Sacks
10.3.10. Others
10.4. Market Value (US$ Mn) and Volume (Tons) Forecast, by Material Type
10.4.1. Plastic
10.4.1.1. Polyethylene
10.4.1.2. Polypropylene
10.4.1.3. Polyethylene Terephthalate
10.4.1.4. Others
10.4.2. Metal
10.4.3. Paper and Paper Board
10.4.4. Glass
10.4.5. Others
10.5. Market Value (US$ Mn) and Volume (Tons) Forecast, by Distribution Channel
10.5.1. Retail Sales
10.5.2. Institutional Sales
10.6. Market Attractiveness Analysis
10.6.1. By Country
10.6.2. By Packaging Type
10.6.3. By Material Type
10.6.4. By Distribution Channel
11. Latin America Coffee Packaging Market Analysis and Forecast
11.1. Introduction
11.1.1. Market share and Basis Points (BPS) Analysis, by Country and Sub-region
11.1.2. Y-o-Y Growth Projections, by Country
11.1.3. Key Regulations
11.2. Market Value (US$ Mn) and Volume (Tons) Forecast, by Country and Sub-region
11.2.1. Brazil
11.2.2. Mexico
11.2.3. Rest of Latin America
11.3. Market Value (US$ Mn) and Volume (Tons) Forecast, by Packaging Type
11.3.1. Pouches
11.3.1.1. Stand Up Pouches
11.3.1.2. Flat Pouches
11.3.2. Side Gusseted Bag
11.3.3. Block Bottom Bag
11.3.4. Stick Pack
11.3.5. Bag-in-Box
11.3.6. Bottles
11.3.7. Cans
11.3.8. Containers & Boxes
11.3.9. Sacks
11.3.10. Others
11.4. Market Value (US$ Mn) and Volume (Tons) Forecast, by Material Type
11.4.1. Plastic
11.4.1.1. Polyethylene
11.4.1.2. Polypropylene
11.4.1.3. Polyethylene Terephthalate
11.4.1.4. Others
11.4.2. Metal
11.4.3. Paper and Paper Board
11.4.4. Glass
11.4.5. Others
11.5. Market Value (US$ Mn) and Volume (Tons) Forecast, by Distribution Channel
11.5.1. Retail Sales
11.5.2. Institutional Sales
11.6. Market Attractiveness Analysis
11.6.1. By Country
11.6.2. By Packaging Type
11.6.3. By Material Type
11.6.4. By Distribution Channel
12. Asia Pacific Coffee Packaging Market Analysis and Forecast
12.1. Introduction
12.1.1. Market share and Basis Points (BPS) Analysis, by Country and Sub-region
12.1.2. Y-o-Y Growth Projections, by Country
12.1.3. Key Regulations
12.2. Market Value (US$ Mn) and Volume (Tons) Forecast, by Country and Sub-region
12.2.1. China
12.2.2. India
12.2.3. Japan
12.2.4. ASEAN
12.2.5. Australia & New Zealand
12.2.6. Rest of APAC
12.3. Market Value (US$ Mn) and Volume (Tons) Forecast, by Packaging Type
12.3.1. Pouches
12.3.1.1. Stand Up Pouches
12.3.1.2. Flat Pouches
12.3.2. Side Gusseted Bag
12.3.3. Block Bottom Bag
12.3.4. Stick Pack
12.3.5. Bag-in-Box
12.3.6. Bottles
12.3.7. Cans
12.3.8. Containers & Boxes
12.3.9. Sacks
12.3.10. Others
12.4. Market Value (US$ Mn) and Volume (Tons) Forecast, by Material Type
12.4.1. Plastic
12.4.1.1. Polyethylene
12.4.1.2. Polypropylene
12.4.1.3. Polyethylene Terephthalate
12.4.1.4. Others
12.4.2. Metal
12.4.3. Paper and Paper Board
12.4.4. Glass
12.4.5. Others
12.5. Market Value (US$ Mn) and Volume (Tons) Forecast, by Distribution Channel
12.5.1. Retail Sales
12.5.2. Institutional Sales
12.6. Market Attractiveness Analysis
12.6.1. By Country
12.6.2. By Packaging Type
12.6.3. By Material Type
12.6.4. By Distribution Channel
13. Middle East & Africa Coffee Packaging Market Analysis and Forecast
13.1. Introduction
13.1.1. Market share and Basis Points (BPS) Analysis, by Country and Sub-region
13.1.2. Y-o-Y Growth Projections, by Country
13.1.3. Key Regulations
13.2. Market Value (US$ Mn) and Volume (Tons) Forecast, by Country and Sub-region
13.2.1. Egypt
13.2.2. Israel
13.2.3. Turkey
13.2.4. Rest of MEA
13.3. Market Value (US$ Mn) and Volume (Tons) Forecast, by Packaging Type
13.3.1. Pouches
13.3.1.1. Stand Up Pouches
13.3.1.2. Flat Pouches
13.3.2. Side Gusseted Bag
13.3.3. Block Bottom Bag
13.3.4. Stick Pack
13.3.5. Bag-in-Box
13.3.6. Bottles
13.3.7. Cans
13.3.8. Containers & Boxes
13.3.9. Sacks
13.3.10. Others
13.4. Market Value (US$ Mn) and Volume (Tons) Forecast, by Material Type
13.4.1. Plastic
13.4.1.1. Polyethylene
13.4.1.2. Polypropylene
13.4.1.3. Polyethylene Terephthalate
13.4.1.4. Others
13.4.2. Metal
13.4.3. Paper and Paper Board
13.4.4. Glass
13.4.5. Others
13.5. Market Value (US$ Mn) and Volume (Tons) Forecast, by Distribution Channel
13.5.1. Retail Sales
13.5.2. Institutional Sales
13.6. Market Attractiveness Analysis
13.6.1. By Country
13.6.2. By Packaging Type
13.6.3. By Material Type
13.6.4. By Distribution Channel
14. Competitive Landscape
14.1. Competition Dashboard
14.2. Company Market Share Analysis
15. Company Profiles
15.1. Company Profiles (Details – Overview, Financials, Strategy, Recent Developments, SWOT analysis)
15.2. Global Players
15.2.1. Amcor Limited
15.2.1.1. Overview
15.2.1.2. Financials
15.2.1.3. Strategy
15.2.1.4. Recent Developments
15.2.1.5. SWOT analysis
15.2.2. WestRock Company
15.2.2.1. Overview
15.2.2.2. Financials
15.2.2.3. Strategy
15.2.2.4. Recent Developments
15.2.2.5. SWOT analysis
15.2.3. Mondi plc
15.2.3.1. Overview
15.2.3.2. Financials
15.2.3.3. Strategy
15.2.3.4. Recent Developments
15.2.3.5. SWOT analysis
15.2.4. DS Smith PLC
15.2.4.1. Overview
15.2.4.2. Financials
15.2.4.3. Strategy
15.2.4.4. Recent Developments
15.2.4.5. SWOT analysis
15.2.5. ProAmpac LLC
15.2.5.1. Overview
15.2.5.2. Financials
15.2.5.3. Strategy
15.2.5.4. Recent Developments
15.2.5.5. SWOT analysis
15.2.6. Crown Holdings, Inc.
15.2.6.1. Overview
15.2.6.2. Financials
15.2.6.3. Strategy
15.2.6.4. Recent Developments
15.2.6.5. SWOT analysis
15.2.7. Sonoco Products Company
15.2.7.1. Overview
15.2.7.2. Financials
15.2.7.3. Strategy
15.2.7.4. Recent Developments
15.2.7.5. SWOT analysis
15.2.8. Graham Packaging Company
15.2.8.1. Overview
15.2.8.2. Financials
15.2.8.3. Strategy
15.2.8.4. Recent Developments
15.2.8.5. SWOT analysis
15.2.9. Novolex Holdings, Inc.
15.2.9.1. Overview
15.2.9.2. Financials
15.2.9.3. Strategy
15.2.9.4. Recent Developments
15.2.9.5. SWOT analysis
15.2.10. Winpack Ltd.
15.2.10.1. Overview
15.2.10.2. Financials
15.2.10.3. Strategy
15.2.10.4. Recent Developments
15.2.10.5. SWOT analysis
15.2.11. Goglio S.p.A.
15.2.11.1. Overview
15.2.11.2. Financials
15.2.11.3. Strategy
15.2.11.4. Recent Developments
15.2.11.5. SWOT analysis
15.2.12. Co-Pack Inc.
15.2.12.1. Overview
15.2.12.2. Financials
15.2.12.3. Strategy
15.2.12.4. Recent Developments
15.2.12.5. SWOT analysis
15.2.13. PBFY Flexible Packaging
15.2.13.1. Overview
15.2.13.2. Financials
15.2.13.3. Strategy
15.2.13.4. Recent Developments
15.2.13.5. SWOT analysis
15.2.14. Constantia Flexibles Group GmbH
15.2.14.1. Overview
15.2.14.2. Financials
15.2.14.3. Strategy
15.2.14.4. Recent Developments
15.2.14.5. SWOT analysis
15.2.15. Glenroy, Inc.
15.2.15.1. Overview
15.2.15.2. Financials
15.2.15.3. Strategy
15.2.15.4. Recent Developments
15.2.15.5. SWOT analysis
15.2.16. Shenzhen Color Hoyo Paper & Plastic Products Co., Ltd
15.2.16.1. Overview
15.2.16.2. Financials
15.2.16.3. Strategy
15.2.16.4. Recent Developments
15.2.16.5. SWOT analysis
15.2.17. Swiss Pack
15.2.17.1. Overview
15.2.17.2. Financials
15.2.17.3. Strategy
15.2.17.4. Recent Developments
15.2.17.5. SWOT analysis
15.2.18. Huhtamaki Oyj
15.2.18.1. Overview
15.2.18.2. Financials
15.2.18.3. Strategy
15.2.18.4. Recent Developments
15.2.18.5. SWOT analysis
15.2.19. Syntegon
15.2.19.1. Overview
15.2.19.2. Financials
15.2.19.3. Strategy
15.2.19.4. Recent Developments
15.2.19.5. SWOT analysis
15.2.20. Roastar
15.2.20.1. Overview
15.2.20.2. Financials
15.2.20.3. Strategy
15.2.20.4. Recent Developments
15.2.20.5. SWOT analysis
16. Assumptions and Acronyms
17. Research Methodology
List of Tables
Table 01: Global Coffee Packaging Market Value (US$ Mn), 2017-2027, by Packaging Type
Table 02: Global Coffee Packaging Market Volume (Tons), 2017-2027, by Packaging Type
Table 03: Global Coffee Packaging Market Value (US$ Mn), 2017-2027, by Material Type
Table 04: Global Coffee Packaging Market Volume (Tons), 2017-2027, by Material Type
Table 05: Global Coffee Packaging Market Value (US$ Mn), 2017-2027, by Distribution Channel
Table 06: Global Coffee Packaging Market Volume (Tons), 2017-2027, by Distribution Channel
Table 07: Global Coffee Packaging Market Value (US$ Mn), 2017-2027, by Region
Table 08: Global Coffee Packaging Market Volume (Tons), 2017-2027, by Region
Table 09: North America Coffee Packaging Market Value (US$ Mn), 2017-2027, by Country
Table 10: North America Coffee Packaging Market Volume (Tons), 2017-2027, by Country
Table 11: North America Coffee Packaging Market Value (US$ Mn), 2017-2027, by Packaging Type
Table 12: North America Coffee Packaging Market Volume (Tons), 2017-2027, by Packaging Type
Table 13: North America Coffee Packaging Market Value (US$ Mn), 2017-2027, by Material Type
Table 14: North America Coffee Packaging Market Volume (Tons), 2017-2027, by Material Type
Table 15: North America Coffee Packaging Market Value (US$ Mn), 2017-2027, by Distribution Channel
Table 16: North America Coffee Packaging Market Volume (Tons), 2017-2027, by Distribution Channel
Table 17: Europe Coffee Packaging Market Value (US$ Mn), 2017-2027, by Country
Table 18: Europe Coffee Packaging Market Volume (Tons), 2017-2027, by Country
Table 19: Europe Coffee Packaging Market Value (US$ Mn), 2017-2027, by Packaging Type
Table 20: Europe Coffee Packaging Market Volume (Tons), 2017-2027, by Packaging Type
Table 21: Europe Coffee Packaging Market Value (US$ Mn), 2017-2027, by Material Type
Table 22: Europe Coffee Packaging Market Volume (Tons), 2017-2027, by Material Type
Table 23: Europe Coffee Packaging Market Value (US$ Mn), 2017-2027, by Distribution Channel
Table 24: Europe Coffee Packaging Market Volume (Tons), 2017-2027, by Distribution Channel
Table 25: Latin America Coffee Packaging Market Value (US$ Mn), 2017-2027, by Country
Table 26: Latin America Coffee Packaging Market Volume (Tons), 2017-2027, by Country
Table 27: Latin America Coffee Packaging Market Value (US$ Mn), 2017-2027, by Packaging Type
Table 28: Latin America Coffee Packaging Market Volume (Tons), 2017-2027, by Packaging Type
Table 29: Latin America Coffee Packaging Market Value (US$ Mn), 2017-2027, by Material Type
Table 30: Latin America Coffee Packaging Market Volume (Tons), 2017-2027, by Material Type
Table 31: Latin America Coffee Packaging Market Value (US$ Mn), 2017-2027, by Distribution Channel
Table 32: Latin America Coffee Packaging Market Volume (Tons), 2017-2027, by Distribution Channel
Table 33: Asia Pacific Coffee Packaging Market Value (US$ Mn), 2017-2027, by Country
Table 34: Asia Pacific Coffee Packaging Market Volume (Tons), 2017-2027, by Country
Table 35: Asia Pacific Coffee Packaging Market Value (US$ Mn), 2017-2027, by Packaging Type
Table 36: Asia Pacific Coffee Packaging Market Volume (Tons), 2017-2027, by Packaging Type
Table 37: Asia Pacific Coffee Packaging Market Value (US$ Mn), 2017-2027, by Material Type
Table 38: Asia Pacific Coffee Packaging Market Volume (Tons), 2017-2027, by Material Type
Table 39: Asia Pacific Coffee Packaging Market Value (US$ Mn), 2017-2027, by Distribution Channel
Table 40: Asia Pacific Coffee Packaging Market Volume (Tons), 2017-2027, by Distribution Channel
Table 41: MEA Coffee Packaging Market Value (US$ Mn), 2017-2027, by Country
Table 42: MEA Coffee Packaging Market Volume (Tons), 2017-2027, by Country
Table 43: MEA Coffee Packaging Market Value (US$ Mn), 2017-2027, by Packaging Type
Table 44: MEA Coffee Packaging Market Volume (Tons), 2017-2027, by Packaging Type
Table 45: MEA Coffee Packaging Market Value (US$ Mn), 2017-2027, by Material Type
Table 46: MEA Coffee Packaging Market Volume (Tons), 2017-2027, by Material Type
Table 47: MEA Coffee Packaging Market Value (US$ Mn), 2017-2027, by Distribution Channel
Table 48: MEA Coffee Packaging Market Volume (Tons), 2017-2027, by Distribution Channel
List of Figures
Figure 01: Global Coffee Packaging Market Value (US$ Mn) and Volume (Tons) Analysis, 2017-2027
Figure 02: Global Coffee Packaging Market Absolute $ Opportunity, 2017-2027
Figure 03: Global Coffee Packaging Market Value Share and BPS Analysis, by Packaging Type, 2017 & 2027
Figure 04: Global Coffee Packaging Market Y-o-Y Growth, by Packaging Type, 2017 & 2027
Figure 05: Global Coffee Packaging Market Value (US$ Mn) Forecast, by Packaging Type, 2017(H)-2027(F)
Figure 06: Global Coffee Packaging Market Volume (Tons) Forecast, by Packaging Type, 2017(H)-2027(F)
Figure 07: Global Coffee Packaging Market Attractiveness Analysis, by Packaging Type, 2017
Figure 08: Global Coffee Packaging Market Value Share and BPS Analysis, by Material Type, 2017 & 2027
Figure 09: Global Coffee Packaging Market Y-o-Y Growth, by Material Type, 2017 & 2027
Figure 10: Global Coffee Packaging Market Value (US$ Mn) Forecast, by Material Type, 2017(H)-2027(F)
Figure 11: Global Coffee Packaging Market Volume (Tons) Forecast, by Material Type, 2017(H)-2027(F)
Figure 12: Global Coffee Packaging Market Attractiveness Analysis, by Material Type, 2017
Figure 13: Global Coffee Packaging Market Value Share and BPS Analysis, by Distribution Channel, 2017 & 2027
Figure 14: Global Coffee Packaging Market Y-o-Y growth, by Distribution Channel 2017 & 2027
Figure 15: Global Coffee Packaging Market Value (US$ Mn) Forecast, by Distribution Channel, 2017(H)-2027(F)
Figure 16: Global Coffee Packaging Market Volume (Tons) Forecast, by Distribution Channel, 2017(H)-2027(F)
Figure 17: Global Coffee Packaging Market Attractiveness Analysis, by Distribution Channel, 2017
Figure 18: Global Coffee Packaging Market Value Share and BPS Analysis, by Region, 2017 & 2027
Figure 19: Global Coffee Packaging Market Y-o-Y growth, by Region 2017 & 2027
Figure 20: Global Coffee Packaging Market Attractiveness Analysis, by Region, 2017
Figure 21: North America Coffee Packaging Market Value share, by Country (2017)
Figure 22: North America Coffee Packaging Market Value Share, by Packaging Type (2017)
Figure 23: North America Coffee Packaging Market Value Share, by Material Type (2017)
Figure 24: North America Coffee Packaging Market Value Share, by Distribution Channel (2017)
Figure 25: North America Coffee Packaging Market Value (US$ Mn), and Volume (Tons) analysis, 2017-2027
Figure 26: North America Coffee Packaging Market Absolute $ Opportunity, 2017-2027
Figure 27: North America Coffee Packaging Market Value Share and BPS Analysis, by Country, 2017 & 2027
Figure 28: North America Coffee Packaging Market Y-o-Y growth, by Country, 2017 & 2027
Figure 29: North America Coffee Packaging Market Attractiveness Analysis, by Country, 2017
Figure 30: North America Coffee Packaging Market BPS analysis (2017 & 2027), by Packaging Type
Figure 31: North America Coffee Packaging Market attractiveness analysis (2017), by Packaging Type
Figure 32: North America Coffee Packaging Market absolute $ opportunity (2017-2027), by Pouches
Figure 33: North America Coffee Packaging absolute $ opportunity (2017-2027), by Side Gusseted Bag
Figure 34: North America Coffee Packaging Market absolute $ opportunity (2017-2027), by Block Bottom Bags
Figure 35: North America Coffee Packaging absolute $ opportunity (2017-2027), by Stick Pack
Figure 36: North America Coffee Packaging Market absolute $ opportunity (2017-2027), by Bag-in-Box
Figure 37: North America Coffee Packaging absolute $ opportunity (2017-2027), by Bottles
Figure 38: North America Coffee Packaging Market absolute $ opportunity (2017-2027), by Cans
Figure 39: North America Coffee Packaging absolute $ opportunity (2017-2027), by Containers & Boxes
Figure 40: North America Coffee Packaging Market absolute $ opportunity (2017-2027), by Sacks
Figure 41: North America Coffee Packaging absolute $ opportunity (2017-2027), by Others
Figure 42: North America Coffee Packaging Market Value (US$ Mn) and Volume (Tons), by Pouches Sub-segments, 2017-2027
Figure 43: North America Coffee Packaging Market BPS analysis (2017 & 2027), By Material Type
Figure 44: North America Coffee Packaging Market attractiveness analysis (2017), By Material Type
Figure 45: North America Coffee Packaging Market absolute $ opportunity (2017-2027), by Plastic
Figure 46: North America Coffee Packaging absolute $ opportunity (2017-2027), by Metal
Figure 47: North America Coffee Packaging Market absolute $ opportunity (2017-2027), by Paper and Paper Board
Figure 48: North America Coffee Packaging absolute $ opportunity (2017-2027), by Glass
Figure 49: North America Coffee Packaging Market absolute $ opportunity (2017-2027), by Others
Figure 50: North America Coffee Packaging Market Value (US$ Mn) and Volume (Tons), By Plastic Sub-segments 2017-2027
Figure 51: North America Coffee Packaging Market BPS analysis (2017 & 2027), by Distribution Channel
Figure 52: North America Coffee Packaging Market attractiveness analysis (2017), by Distribution Channel
Figure 53: North America Coffee Packaging Market absolute $ opportunity (2017-2027), by Retail Sales
Figure 54: North America Coffee Packaging absolute $ opportunity (2017-2027), by Institutional Sales
Figure 55: Europe Coffee Packaging Market Value share, by Country (2017)
Figure 56: Europe Coffee Packaging Market Value Share, by Packaging Type (2017)
Figure 57: Europe Coffee Packaging Market Value Share, By Material Type (2017)
Figure 58: Europe Coffee Packaging Market Value Share, by Distribution Channel (2017)
Figure 59: Europe Coffee Packaging Market Value (US$ Mn), and Volume (Tons) analysis, 2017-2027
Figure 60: Europe Coffee Packaging Market Absolute $ Opportunity, 2017-2027
Figure 61: Europe Coffee Packaging Market Value Share and BPS Analysis, By Country, 2017 & 2027
Figure 62: Europe Coffee Packaging Market Y-o-Y growth, By Country 2017 & 2027
Figure 63: Europe Coffee Packaging Market Attractiveness Analysis, by Country, 2017
Figure 64: Europe Coffee Packaging Market BPS analysis (2017 & 2027), by Packaging Type
Figure 65: Europe Coffee Packaging Market attractiveness analysis (2017), by Packaging Type
Figure 66: Europe Coffee Packaging Market absolute $ opportunity (2017-2027), by Pouches
Figure 67: Europe Coffee Packaging absolute $ opportunity (2017-2027), by Side Gusseted Bag
Figure 68: Europe Coffee Packaging Market absolute $ opportunity (2017-2027), by Block Bottom Bags
Figure 69: Europe Coffee Packaging absolute $ opportunity (2017-2027), by Stick Pack
Figure 70: Europe Coffee Packaging Market absolute $ opportunity (2017-2027), by Bag-in-Box
Figure 71: Europe Coffee Packaging absolute $ opportunity (2017-2027), by Bottles
Figure 72: Europe Coffee Packaging Market absolute $ opportunity (2017-2027), by Cans
Figure 73: Europe Coffee Packaging absolute $ opportunity (2017-2027), by Containers & Boxes
Figure 74: Europe Coffee Packaging Market absolute $ opportunity (2017-2027), by Sacks
Figure 75: Europe Coffee Packaging absolute $ opportunity (2017-2027), by Others
Figure 76: Europe Coffee Packaging Market Value (US$ Mn) and Volume (Tons), by Pouches Sub-segments, 2017-2027
Figure 77: Europe Coffee Packaging Market BPS analysis (2017 & 2027), by Material Type
Figure 78: Europe Coffee Packaging Market attractiveness analysis (2017), by Material Type
Figure 79: Europe Coffee Packaging Market absolute $ opportunity (2017-2027), by Plastic
Figure 80: Europe Coffee Packaging absolute $ opportunity (2017-2027), by Metal
Figure 81: Europe Coffee Packaging Market absolute $ opportunity (2017-2027), by Paper and Paper Board and Paper and Paper Board Board
Figure 82: Europe Coffee Packaging absolute $ opportunity (2017-2027), by Glass
Figure 83: Europe Coffee Packaging Market absolute $ opportunity (2017-2027), by Others
Figure 84: Europe Coffee Packaging Market Value (US$ Mn) and Volume (Tons), by Plastic Sub-segments 2017-2027
Figure 85: Europe Coffee Packaging Market BPS analysis (2017 & 2027), by Distribution Channel
Figure 86: Europe Coffee Packaging Market attractiveness analysis (2017), by Distribution Channel
Figure 87: Europe Coffee Packaging Market absolute $ opportunity (2017-2027), by Retail Sales
Figure 88: Europe Coffee Packaging absolute $ opportunity (2017-2027), by Institutional Sales
Figure 89: Latin America Coffee Packaging Market Value share, by Country (2017)
Figure 90: Latin America Coffee Packaging Market Value Share, by Packaging Type (2017)
Figure 91: Latin America Coffee Packaging Market Value Share, by Material Type (2017)
Figure 92: Latin America Coffee Packaging Market Value Share, by Distribution Channel (2017)
Figure 93: Latin America Coffee Packaging Market Value (US$ Mn), and Volume (Tons) analysis, 2017-2027
Figure 94: Latin America Coffee Packaging Market Absolute $ Opportunity, 2017-2027
Figure 95: Latin America Coffee Packaging Market Value Share and BPS Analysis, by Country, 2017 & 2027
Figure 96: Latin America Coffee Packaging Market Y-o-Y growth, by Country 2017 & 2027
Figure 97: Latin America Coffee Packaging Market Attractiveness Analysis, by Country, 2017
Figure 98: Latin America Coffee Packaging Market BPS analysis (2017 & 2027), by Packaging Type
Figure 99: Latin America Coffee Packaging Market attractiveness analysis (2017), by Packaging Type
Figure 100: Latin America Coffee Packaging Market absolute $ opportunity (2017-2027), by Pouches
Figure 101: Latin America Coffee Packaging absolute $ opportunity (2017-2027), by Side Gusseted Bag
Figure 102: Latin America Coffee Packaging Market absolute $ opportunity (2017-2027), by Block Bottom Bags
Figure 103: Latin America Coffee Packaging absolute $ opportunity (2017-2027), by Stick Pack
Figure 104: Latin America Coffee Packaging Market absolute $ opportunity (2017-2027), by Bag-in-Box
Figure 105: Latin America Coffee Packaging absolute $ opportunity (2017-2027), by Bottles
Figure 106: Latin America Coffee Packaging Market absolute $ opportunity (2017-2027), by Cans
Figure 107: Latin America Coffee Packaging absolute $ opportunity (2017-2027), by Containers & Boxes
Figure 108: Latin America Coffee Packaging Market absolute $ opportunity (2017-2027), by Sacks
Figure 109: Latin America Coffee Packaging absolute $ opportunity (2017-2027), by Others
Figure 110: Latin America Coffee Packaging Market Value (US$ Mn) and Volume (Tons), by Pouches Sub-segments 2017-2027
Figure 111: Latin America Coffee Packaging Market BPS analysis (2017 & 2027), by Material Type
Figure 112: Latin America Coffee Packaging Market attractiveness analysis (2017), by Material Type
Figure 113: Latin America Coffee Packaging Market absolute $ opportunity (2017-2027), by Plastic
Figure 114: Latin America Coffee Packaging absolute $ opportunity (2017-2027), by Metal
Figure 115: Latin America Coffee Packaging Market absolute $ opportunity (2017-2027), by Paper and Paper Board
Figure 116: Latin America Coffee Packaging absolute $ opportunity (2017-2027), by Glass
Figure 117: Latin America Coffee Packaging Market absolute $ opportunity (2017-2027), by Others
Figure 118: Latin America Coffee Packaging Market Value (US$ Mn) and Volume (Tons), by Plastic Sub-segments 2017-2027
Figure 119: Latin America Coffee Packaging Market BPS analysis (2017 & 2027), by Distribution Channel
Figure 120: Latin America Coffee Packaging Market attractiveness analysis (2017), by Distribution Channel
Figure 121: Latin America Coffee Packaging Market absolute $ opportunity (2017-2027), by Retail Sales
Figure 122: Latin America Coffee Packaging absolute $ opportunity (2017-2027), by Institutional Sales
Figure 123: Asia Pacific Coffee Packaging Market Value share, by Country (2017)
Figure 124: Asia Pacific Coffee Packaging Market Value Share, by Packaging Type (2017)
Figure 125: Asia Pacific Coffee Packaging Market Value Share, by Material Type (2017)
Figure 126: Asia Pacific Coffee Packaging Market Value Share, by Distribution Channel (2017)
Figure 127: Asia Pacific Coffee Packaging Market Value (US$ Mn), and Volume (Tons) analysis, 2017-2027
Figure 128: Asia Pacific Coffee Packaging Market Absolute $ Opportunity, 2017-2027
Figure 129: Asia Pacific Coffee Packaging Market Value Share and BPS Analysis, by Country, 2017 & 2027
Figure 130: Asia Pacific Coffee Packaging Market Y-o-Y growth, by Country, 2017 & 2027
Figure 131: Asia Pacific Coffee Packaging Market Attractiveness Analysis, by Country, 2017
Figure 132: Asia Pacific Coffee Packaging Market BPS analysis (2017 & 2027), by Packaging Type
Figure 133: Asia Pacific Coffee Packaging Market attractiveness analysis (2017), by Packaging Type
Figure 134: Asia Pacific Coffee Packaging Market absolute $ opportunity (2017-2027), by Pouches
Figure 135: Asia Pacific Coffee Packaging absolute $ opportunity (2017-2027), by Side Gusseted Bag
Figure 136: Asia Pacific Coffee Packaging Market absolute $ opportunity (2017-2027), by Block Bottom Bags
Figure 137: Asia Pacific Coffee Packaging absolute $ opportunity (2017-2027), by Stick Pack
Figure 138: Asia Pacific Coffee Packaging Market absolute $ opportunity (2017-2027), by Bag-in-Box
Figure 139: Asia Pacific Coffee Packaging absolute $ opportunity (2017-2027), by Bottles
Figure 140: Asia Pacific Coffee Packaging Market absolute $ opportunity (2017-2027), by Cans
Figure 141: Asia Pacific Coffee Packaging absolute $ opportunity (2017-2027), by Containers & Boxes
Figure 142: Asia Pacific Coffee Packaging Market absolute $ opportunity (2017-2027), by Sacks
Figure 143: Asia Pacific Coffee Packaging absolute $ opportunity (2017-2027), by Others
Figure 144: Asia Pacific Coffee Packaging Market Value (US$ Mn) and Volume (Tons), by Pouches Sub-segments, 2017-2027
Figure 145: Asia Pacific Coffee Packaging Market BPS analysis (2017 & 2027), by Material Type
Figure 146: Asia Pacific Coffee Packaging Market attractiveness analysis (2017), by Material Type
Figure 147: Asia Pacific Coffee Packaging Market absolute $ opportunity (2017-2027), by Plastic
Figure 148: Asia Pacific Coffee Packaging absolute $ opportunity (2017-2027), by Metal
Figure 149: Asia Pacific Coffee Packaging Market absolute $ opportunity (2017-2027), by Paper and Paper Board
Figure 150: Asia Pacific Coffee Packaging absolute $ opportunity (2017-2027), by Glass
Figure 151: Asia Pacific Coffee Packaging Market absolute $ opportunity (2017-2027), by Others
Figure 152: Asia Pacific Coffee Packaging Market Value (US$ Mn) and Volume (Tons), by Plastic Sub-segments 2017-2027
Figure 153: Asia Pacific Coffee Packaging Market BPS analysis (2017 & 2027), by Distribution Channel
Figure 154: Asia Pacific Coffee Packaging Market attractiveness analysis (2017), by Distribution Channel
Figure 155: Asia Pacific Coffee Packaging Market absolute $ opportunity (2017-2027), by Retail Sales
Figure 156: Asia Pacific Coffee Packaging absolute $ opportunity (2017-2027), by Institutional Sales
Figure 157: Middle East and Africa Coffee Packaging Market Value share, by Country (2017)
Figure 158: Middle East and Africa Coffee Packaging Market Value Share, by Packaging Type (2017)
Figure 159: Middle East and Africa Coffee Packaging Market Value Share, by Material Type (2017)
Figure 160: Middle East and Africa Coffee Packaging Market Value Share, by Distribution Channel (2017)
Figure 161: Middle East and Africa Coffee Packaging Market Value (US$ Mn), and Volume (Tons) analysis, 2017-2027
Figure 162: Middle East and Africa Coffee Packaging Market Absolute $ Opportunity, 2017-2027
Figure 163: Middle East and Africa Coffee Packaging Market Value Share and BPS Analysis, by Country, 2017 & 2027
Figure 164: Middle East and Africa Coffee Packaging Market Y-o-Y growth, by Country, 2017 & 2027
Figure 165: Middle East and Africa Coffee Packaging Market Attractiveness Analysis, by Country, 2017
Figure 166: Middle East and Africa Coffee Packaging Market BPS analysis (2017 & 2027), by Packaging Type
Figure 167: Middle East and Africa Coffee Packaging Market attractiveness analysis (2017), by Packaging Type
Figure 168: Middle East and Africa Coffee Packaging Market absolute $ opportunity (2017-2027), by Pouches
Figure 169: Middle East and Africa Coffee Packaging absolute $ opportunity (2017-2027), by Side Gusseted Bag
Figure 170: Middle East and Africa Coffee Packaging Market absolute $ opportunity (2017-2027), by Block Bottom Bags
Figure 171: Middle East and Africa Coffee Packaging absolute $ opportunity (2017-2027), by Stick Pack
Figure 172: Middle East and Africa Coffee Packaging Market absolute $ opportunity (2017-2027), by Bag-in-Box
Figure 173: Middle East and Africa Coffee Packaging absolute $ opportunity (2017-2027), by Bottles
Figure 174: Middle East and Africa Coffee Packaging Market absolute $ opportunity (2017-2027), by Cans
Figure 175: Middle East and Africa Coffee Packaging absolute $ opportunity (2017-2027), by Containers & Boxes
Figure 176: Middle East and Africa Coffee Packaging Market absolute $ opportunity (2017-2027), by Sacks
Figure 177: Middle East and Africa Coffee Packaging absolute $ opportunity (2017-2027), by Others
Figure 178: Middle East and Africa Coffee Packaging Market Value (US$ Mn) and Volume (Tons), by Pouches Sub-segments 2017-2027
Figure 179: Middle East and Africa Coffee Packaging Market BPS analysis (2017 & 2027), by Material Type
Figure 180: Middle East and Africa Coffee Packaging Market attractiveness analysis (2017), by Material Type
Figure 181: Middle East and Africa Coffee Packaging Market absolute $ opportunity (2017-2027), by Plastic
Figure 182: Middle East and Africa Coffee Packaging absolute $ opportunity (2017-2027), by Metal
Figure 183: Middle East and Africa Coffee Packaging Market absolute $ opportunity (2017-2027), by Paper and Paper Board
Figure 184: Middle East and Africa Coffee Packaging absolute $ opportunity (2017-2027), by Glass
Figure 185: Middle East and Africa Coffee Packaging Market absolute $ opportunity (2017-2027), by Others
Figure 186: Middle East and Africa Coffee Packaging Market Value (US$ Mn) and Volume (Tons), by Plastic Sub-segments, 2017-2027
Figure 187: Middle East and Africa Coffee Packaging Market BPS analysis (2017 & 2027), by Distribution Channel
Figure 188: Middle East and Africa Coffee Packaging Market attractiveness analysis (2017), by Distribution Channel
Figure 189: Middle East and Africa Coffee Packaging Market absolute $ opportunity (2017-2027), by Retail Sales
Figure 190: Middle East and Africa Coffee Packaging absolute $ opportunity (2017-2027), by Institutional Sales
Copyright © Transparency Market Research, Inc. All Rights reserved
Trust Online

Coffee Packaging Market