
Reports
Reports
Analysts’ Viewpoint on Chemical Mechanical Planarization (CMP) Market Scenario
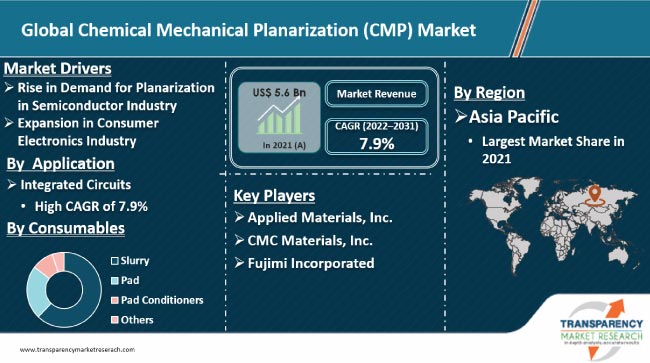
Rise in demand for consumer electronics and automobiles is driving the global chemical mechanical planarization (CMP) market. CMP is widely used in the semiconductor industry to fabricate ICs and memory disks. Recent developments made in the CMP process provide planarity levels and multi-selective removal of metals and dielectric materials. Thus, rapid expansion in the semiconductor sector is expected to augment the global market during the forecast period. Chemical mechanical planarization companies are investing significantly to expand their manufacturing capabilities and offer reliable CMP material solutions. Production of contaminants on the wafer surface is a major challenge in chemical mechanical planarization.
Chemical Mechanical Planarization (CMP) is a critical technological procedure used in the fabrication of semiconductor wafers and chips. It combines chemical and mechanical forces to polish and smoothen wafer surfaces. The chemical mechanical planarization process offers a uniform surface that is essential for subsequent processing steps. Chemical mechanical planarization equipment include polishing and grinding machines and slurry testing equipment. CMP models can be classified as models for material removal mechanisms and models for planarization, depending on their primary purpose of fabricating integrated circuits and memory disks.
CMP is widely used in the semiconductor industry for oxide dielectric and metal layer planarization. It is also utilized to fabricate Microelectromechanical Systems (MEMS). Increase in demand for Molded Interconnect Devices (MIDs), PCs, and mobile devices is fueling the semiconductor industry. This, in turn, is boosting the production of chips that support various functions in electronic devices. Thus, expansion in the semiconductor industry is likely to propel the CMP market during the forecast period.
Rise in the usage of 3D devices, LEDs, smartphones, computers, TVs, and videogame consoles is augmenting the consumer electronics sector. Printed Circuit Boards (PCBs) are a core part of almost every consumer electronic appliance. Surge in the integration of telematics, Advanced Driver Assistance Systems (ADAS), and infotainment devices in automobiles has also led to significant investment in PCB production. ADAS is gaining traction in the automotive sector due to increase in demand for safety, security, and comfort in vehicles. Thus, expansion in the electronics sector and rise in the integration of electronic control units in vehicles are augmenting the demand for chemical mechanical planarization.
Based on equipment, the global chemical mechanical planarization (CMP) market has been segmented into polishing & grinding equipment, slurry testing equipment, on-line, and laboratory. The polishing & grinding equipment segment is expected to dominate the global market and expand at a CAGR of 8.6% during the forecast period. Chemical mechanical paired grinding is designed to provide a marked defect reduction at feasible and economic operational conditions. Chemical mechanical polishing is used to remove material and achieve very high levels of planarity. It relies on chemical oxidation and mechanical abrasion for polishing semiconductor wafers or other substrates.
In terms of consumables, the global chemical mechanical planarization (CMP) market has been classified into slurry, pad, pad conditioners, and others. The slurry segment is anticipated to hold largest share of the global market during the forecast period. Slurries are liquid dispersions that contain active chemicals and micro-abrasive grains used for chemical mechanical planarization. They typically consist of a nano-sized abrasive powder dispersed in a chemically-reactive solution. While chemical etching softens the material, the mechanical abrasion removes the material resulting in the flattening of the topographic features and making the surface planar. CMP pads and slurries are used together on a polishing tool multiple times throughout the compound semiconductor fabrication process in order to planarize both die-level and wafer-level topography. They are also employed to remove overfilled metal and metalloid materials that serve as interconnects in an IC.
Based on application, the chemical mechanical planarization (CMP) market has been divided into integrated circuits, optics, compound semiconductors, MEMS & NEMS, and others. The integrated circuits segment is likely to dominate the global market and rise at a CAGR of 7.9% during the forecast period. Increase in demand for consumer electronic goods and automotive electronics is driving the segment. The NEMS & MEMS segment is estimated to expand at a CAGR of 8.6% in the next few years. Rise in adoption of sensors and actuators is propelling the segment.
Asia Pacific held largest share of 64.1% of the global chemical mechanical planarization (CMP) market in 2021. The region is anticipated to maintain its dominance and advance at a CAGR of 8.0% during the forecast period. Growth of the market can be ascribed to expansion in the consumer electronics sector and rise in investment in semiconductor manufacturing in the region.
The global chemical mechanical planarization (CMP) market is dominated by a few large- and medium-sized manufacturers. A few of the top companies, cumulatively, accounted for more than 60% share in 2021. Manufacturers are expanding their production capacities and adopting M&A and collaboration strategies to enhance their chemical mechanical planarization market share. Applied Materials, Inc., CMC Materials, Inc., Fujimi Incorporated, Hitachi Chemical Co., Ltd., Ebara Corporation, Versum Materials, Inc., DuPont Electronic Solutions, BASF SE, Lam Research Corporation, Intel Corporation, Samsung Electronics Co., Ltd., Micron Technology, Inc., Taiwan Semiconductor Manufacturing Company Limited, Okamoto Machine Tool Works, Ltd., Alpsitec SAS, Axus Technology, Revasum, and GlobalFoundries Inc. are prominent entities operating in the market.
Key players have been profiled in the chemical mechanical planarization (CMP) market report based on parameters such as company overview, financial overview, business strategies, product portfolio, business segments, and recent developments.
|
Attribute |
Detail |
|
Market Size Value in 2021 |
US$ 5.6 Bn |
|
Market Forecast Value in 2031 |
US$ 12.0 Bn |
|
Growth Rate (CAGR) |
7.9% |
|
Forecast Period |
2022–2031 |
|
Historical Data Available for |
2020 |
|
Quantitative Units |
US$ Bn For Value |
|
Market Analysis |
It includes cross segment analysis at Europe as well as country level. Furthermore, qualitative analysis includes drivers, restraints, opportunities, key trends, Porter’s Five Forces analysis, value chain analysis, and key trend analysis. |
|
Competition Landscape |
|
|
Format |
Example: Electronic (PDF) + Excel |
|
Market Segmentation |
|
|
Regions Covered |
|
|
Countries Covered |
|
|
Companies Profiled |
|
|
Customization Scope |
Available upon request |
|
Pricing |
Available upon request |
The chemical mechanical planarization (CMP) market stood at US$ 5.6 Bn in 2021.
The chemical mechanical planarization (CMP) market is expected to rise at a CAGR of 7.9% from 2022 to 2031.
Rise in adoption of planarization in semiconductor industry and growth in consumer electronics industry are driving the market.
The polishing & grinding equipment segment held largest share of 75% of the market in 2021.
Asia Pacific was the most lucrative region of the chemical mechanical planarization (CMP) market with 64.1% share in 2021.
Applied Materials, Inc., CMC Materials, Inc., Fujimi Incorporated, Hitachi Chemical Co., Ltd., Ebara Corporation, Versum Materials, Inc., DuPont Electronic Solutions, BASF SE, Lam Research Corporation, Intel Corporation, Samsung Electronics Co., Ltd., Micron Technology, Inc., Taiwan Semiconductor Manufacturing Company Limited, Okamoto Machine Tool Works, Ltd., Alpsitec SAS, Axus Technology, Revasum, and GlobalFoundries Inc.
1. Executive Summary
1.1. Chemical Mechanical Planarization (CMP) Market Snapshot
1.2. Key Market Trends
1.3. Current Market and Future Potential
1.4. TMR’s Growth Opportunity Wheel
2. Market Overview
2.1. Market Segmentation
2.2. Market Indicators
2.3. Market Definitions
2.4. Market Dynamics
2.4.1. Drivers
2.4.2. Restraints
2.4.3. Opportunities
2.5. Porter’s Five Forces Analysis
2.6. Value Chain Analysis
2.6.1. List of Service Providers
2.6.2. List of Potential Customers
3. COVID-19 Impact Analysis
4. Global Chemical Mechanical Planarization (CMP) Market Analysis and Forecast, by Equipment, 2020–2031
4.1. Introduction and Definitions
4.2. Global Chemical Mechanical Planarization (CMP) Market Value (US$ Mn) Forecast, by Equipment,
4.2.1. Polishing & Grinding Equipment
4.2.2. Slurry Testing Equipment
4.2.3. On-line
4.2.4. Laboratory
4.3. Global Chemical Mechanical Planarization (CMP) Market Attractiveness, by Equipment
5. Global Chemical Mechanical Planarization (CMP) Market Analysis and Forecast, by Consumables, 2020–2031
5.1. Introduction and Definitions
5.2. Global Chemical Mechanical Planarization (CMP) Market Value (US$ Mn) Forecast, by Consumables, 2020–2031
5.2.1.1. Slurry
5.2.1.2. Pad
5.2.1.3. Pad Conditioners
5.2.1.4. Others
5.3. Global Chemical Mechanical Planarization (CMP) Market Attractiveness, by Consumables
6. Global Chemical Mechanical Planarization (CMP) Market Analysis and Forecast, by Application, 2020–2031
6.1. Introduction and Definitions
6.2. Global Chemical Mechanical Planarization (CMP) Market Value (US$ Mn) Forecast, by Application,
6.2.1. Integrated Circuits
6.2.2. Optics
6.2.3. Compound Semiconductors
6.2.4. MEMS & NEMS
6.2.5. Others
6.3. Global Chemical Mechanical Planarization (CMP) Market Attractiveness, by Application
7. Global Chemical Mechanical Planarization (CMP) Market Analysis and Forecast, by Region, 2020–2031
7.1. Key Findings
7.2. Global Chemical Mechanical Planarization (CMP) Market Value (US$ Mn) Forecast, by Region, 2020–2031
7.2.1. North America
7.2.2. Europe
7.2.3. Asia Pacific
7.2.4. Latin America
7.2.5. Middle East & Africa
7.3. Global Chemical Mechanical Planarization (CMP) Market Attractiveness, by Region
8. North America Chemical Mechanical Planarization (CMP) Market Analysis and Forecast, 2020–2031
8.1. Key Findings
8.2. North America Chemical Mechanical Planarization (CMP) Market Value (US$ Mn) Forecast, by Equipment, 2020–2031
8.3. North America Chemical Mechanical Planarization (CMP) Market Value (US$ Mn) Forecast, by Consumables, 2020–2031
8.4. North America Chemical Mechanical Planarization (CMP) Market Value (US$ Mn) Forecast, by Application, 2020–2031
8.5. North America Chemical Mechanical Planarization (CMP) Market Value (US$ Mn) Forecast, by Country, 2020–2031
8.5.1. U.S. Chemical Mechanical Planarization (CMP) Market Value (US$ Mn) Forecast, by Equipment, 2020–2031
8.5.2. U.S. Chemical Mechanical Planarization (CMP) Market Value (US$ Mn) Forecast, by Consumables, 2020–2031
8.5.3. U.S. Chemical Mechanical Planarization (CMP) Market Value (US$ Mn) Forecast, by Application, 2020–2031
8.5.4. Canada Chemical Mechanical Planarization (CMP) Market Value (US$ Mn) Forecast, by Equipment, 2020–2031
8.5.5. Canada Chemical Mechanical Planarization (CMP) Market Value (US$ Mn) Forecast, by Consumables, 2020–2031
8.5.6. Canada Chemical Mechanical Planarization (CMP) Market Value (US$ Mn) Forecast, by Application, 2020–2031
8.6. North America Chemical Mechanical Planarization (CMP) Market Attractiveness Analysis
9. Europe Chemical Mechanical Planarization (CMP) Market Analysis and Forecast, 2020–2031
9.1. Key Findings
9.2. Europe Chemical Mechanical Planarization (CMP) Market Value (US$ Mn) Forecast, by Equipment, 2020–2031
9.3. Europe Chemical Mechanical Planarization (CMP) Market Value (US$ Mn) Forecast, by Consumables, 2020–2031
9.4. Europe Chemical Mechanical Planarization (CMP) Market Value (US$ Mn) Forecast, by Application, 2020–2031
9.5. Europe Chemical Mechanical Planarization (CMP) Market Value (US$ Mn) Forecast, by Country and Sub-region, 2020-2031
9.5.1. Germany Chemical Mechanical Planarization (CMP) Market Value (US$ Mn) Forecast, by Equipment, 2020–2031
9.5.2. Germany Chemical Mechanical Planarization (CMP) Market Value (US$ Mn) Forecast, by Consumables, 2020–2031
9.5.3. Germany Chemical Mechanical Planarization (CMP) Market Value (US$ Mn) Forecast, by Application, 2020–2031
9.5.4. France Chemical Mechanical Planarization (CMP) Market Value (US$ Mn) Forecast, by Equipment, 2020–2031
9.5.5. France Chemical Mechanical Planarization (CMP) Market Value (US$ Mn) Forecast, by Consumables, 2020–2031
9.5.6. France Chemical Mechanical Planarization (CMP) Market Value (US$ Mn) Forecast, by Application, 2020–2031
9.5.7. U.K. Chemical Mechanical Planarization (CMP) Market Value (US$ Mn) Forecast, by Equipment, 2020–2031
9.5.8. U.K. Chemical Mechanical Planarization (CMP) Market Value (US$ Mn) Forecast, by Consumables, 2020–2031
9.5.9. U.K. Chemical Mechanical Planarization (CMP) Market Value (US$ Mn) Forecast, by Application, 2020–2031
9.5.10. Italy Chemical Mechanical Planarization (CMP) Market Value (US$ Mn) Forecast, by Equipment, 2020–2031
9.5.11. Italy Chemical Mechanical Planarization (CMP) Market Value (US$ Mn) Forecast, by Consumables, 2020–2031
9.5.12. Italy Chemical Mechanical Planarization (CMP) Market Value (US$ Mn) Forecast, by Application, 2020–2031
9.5.13. Russia & CIS Chemical Mechanical Planarization (CMP) Market Value (US$ Mn) Forecast, by Equipment, 2020–2031
9.5.14. Russia & CIS Chemical Mechanical Planarization (CMP) Market Value (US$ Mn) Forecast, by Consumables, 2020–2031
9.5.15. Russia & CIS Chemical Mechanical Planarization (CMP) Market Value (US$ Mn) Forecast, by Application, 2020–2031
9.5.16. Rest of Europe Chemical Mechanical Planarization (CMP) Market Value (US$ Mn) Forecast, by Equipment, 2020–2031
9.5.17. Rest of Europe Chemical Mechanical Planarization (CMP) Market Value (US$ Mn) Forecast, by Consumables, 2020–2031
9.5.18. Rest of Europe Chemical Mechanical Planarization (CMP) Market Value (US$ Mn) Forecast, by Application, 2020–2031
9.6. Europe Chemical Mechanical Planarization (CMP) Market Attractiveness Analysis
10. Asia Pacific Chemical Mechanical Planarization (CMP) Market Analysis and Forecast, 2020–2031
10.1. Key Findings
10.2. Asia Pacific Chemical Mechanical Planarization (CMP) Market Value (US$ Mn) Forecast, by Equipment, 2020-2031
10.3. Asia Pacific Chemical Mechanical Planarization (CMP) Market Value (US$ Mn) Forecast, by Consumables, 2020–2031
10.4. Asia Pacific Chemical Mechanical Planarization (CMP) Market Value (US$ Mn) Forecast, by Application, 2020–2031
10.5. Asia Pacific Chemical Mechanical Planarization (CMP) Market Value (US$ Mn) Forecast, by Country and Sub-region, 2020-2031
10.5.1. China Chemical Mechanical Planarization (CMP) Market Value (US$ Mn) Forecast, by Equipment, 2020–2031
10.5.2. China Chemical Mechanical Planarization (CMP) Market Value (US$ Mn) Forecast, by Consumables, 2020–2031
10.5.3. China Chemical Mechanical Planarization (CMP) Market Value (US$ Mn) Forecast, by Application, 2020–2031
10.5.4. Japan Chemical Mechanical Planarization (CMP) Market Value (US$ Mn) Forecast, by Equipment, 2020–2031
10.5.5. Japan Chemical Mechanical Planarization (CMP) Market Value (US$ Mn) Forecast, by Consumables, 2020–2031
10.5.6. Japan Chemical Mechanical Planarization (CMP) Market Value (US$ Mn) Forecast, by Application, 2020–2031
10.5.7. India Chemical Mechanical Planarization (CMP) Market Value (US$ Mn) Forecast, by Equipment, 2020–2031
10.5.8. India Chemical Mechanical Planarization (CMP) Market Value (US$ Mn) Forecast, by Consumables, 2020–2031
10.5.9. India Chemical Mechanical Planarization (CMP) Market Value (US$ Mn) Forecast, by Application, 2020–2031
10.5.10. ASEAN Chemical Mechanical Planarization (CMP) Market Value (US$ Mn) Forecast, by Equipment, 2020–2031
10.5.11. ASEAN Chemical Mechanical Planarization (CMP) Market Value (US$ Mn) Forecast, by Consumables, 2020–2031
10.5.12. ASEAN Chemical Mechanical Planarization (CMP) Market Value (US$ Mn) Forecast, by Application, 2020–2031
10.5.13. Rest of Asia Pacific Chemical Mechanical Planarization (CMP) Market Value (US$ Mn) Forecast, by Equipment, 2020–2031
10.5.14. Rest of Asia Pacific Chemical Mechanical Planarization (CMP) Market Value (US$ Mn) Forecast, by Consumables, 2020–2031
10.5.15. Rest of Asia Pacific Chemical Mechanical Planarization (CMP) Market Value (US$ Mn) Forecast, by Application, 2020–2031
10.6. Asia Pacific Chemical Mechanical Planarization (CMP) Market Attractiveness Analysis
11. Latin America Chemical Mechanical Planarization (CMP) Market Analysis and Forecast, 2020–2031
11.1. Key Findings
11.2. Latin America Chemical Mechanical Planarization (CMP) Market Value (US$ Mn) Forecast, by Equipment, 2020–2031
11.3. Latin America Chemical Mechanical Planarization (CMP) Market Value (US$ Mn) Forecast, by Consumables, 2020–2031
11.4. Latin America Chemical Mechanical Planarization (CMP) Market Value (US$ Mn) Forecast, by Application, 2020–2031
11.5. Latin America Chemical Mechanical Planarization (CMP) Market Value (US$ Mn) Forecast, by Country and Sub-region, 2020-2031
11.5.1. Brazil Chemical Mechanical Planarization (CMP) Market Value (US$ Mn) Forecast, by Equipment, 2020–2031
11.5.2. Brazil Chemical Mechanical Planarization (CMP) Market Value (US$ Mn) Forecast, by Consumables, 2020–2031
11.5.3. Brazil Chemical Mechanical Planarization (CMP) Market Value (US$ Mn) Forecast, by Application, 2020–2031
11.5.4. Mexico Chemical Mechanical Planarization (CMP) Market Value (US$ Mn) Forecast, by Equipment, 2020–2031
11.5.5. Mexico Chemical Mechanical Planarization (CMP) Market Value (US$ Mn) Forecast, by Consumables, 2020–2031
11.5.6. Mexico Chemical Mechanical Planarization (CMP) Market Value (US$ Mn) Forecast, by Application, 2020–2031
11.5.7. Rest of Latin America Chemical Mechanical Planarization (CMP) Market Value (US$ Mn) Forecast, by Equipment, 2020–2031
11.5.8. Rest of Latin America Chemical Mechanical Planarization (CMP) Market Value (US$ Mn) Forecast, by Consumables, 2020–2031
11.5.9. Rest of Latin America Chemical Mechanical Planarization (CMP) Market Value (US$ Mn) Forecast, by Application, 2020–2031
11.6. Latin America Chemical Mechanical Planarization (CMP) Market Attractiveness Analysis
12. Middle East & Africa Chemical Mechanical Planarization (CMP) Market Analysis and Forecast, 2020–2031
12.1. Key Findings
12.2. Middle East & Africa Chemical Mechanical Planarization (CMP) Market Value (US$ Mn) Forecast, by Equipment, 2020–2031
12.3. Middle East & Africa Chemical Mechanical Planarization (CMP) Market Value (US$ Mn) Forecast, by Consumables, 2020–2031
12.4. Middle East & Africa Chemical Mechanical Planarization (CMP) Market Value (US$ Mn) Forecast, by Application, 2020–2031
12.5. Middle East & Africa Chemical Mechanical Planarization (CMP) Market Value (US$ Mn) Forecast, by Country and Sub-region, 2020-2031
12.5.1. GCC Chemical Mechanical Planarization (CMP) Market Value (US$ Mn) Forecast, by Equipment, 2020–2031
12.5.2. GCC Chemical Mechanical Planarization (CMP) Market Value (US$ Mn) Forecast, by Consumables, 2020–2031
12.5.3. GCC Chemical Mechanical Planarization (CMP) Market Value (US$ Mn) Forecast, by Application, 2020–2031
12.5.4. South Africa Chemical Mechanical Planarization (CMP) Market Value (US$ Mn) Forecast, by Equipment, 2020–2031
12.5.5. South Africa Chemical Mechanical Planarization (CMP) Market Value (US$ Mn) Forecast, by Consumables, 2020–2031
12.5.6. South Africa Chemical Mechanical Planarization (CMP) Market Value (US$ Mn) Forecast, by Application, 2020–2031
12.5.7. Rest of Middle East & Africa Chemical Mechanical Planarization (CMP) Market Value (US$ Mn) Forecast, by Equipment, 2020–2031
12.5.8. South Africa Chemical Mechanical Planarization (CMP) Market Value (US$ Mn) Forecast, by Consumables, 2020–2031
12.5.9. Rest of Middle East & Africa Chemical Mechanical Planarization (CMP) Market Value (US$ Mn) Forecast, by Application, 2020–2031
12.6. Middle East & Africa Chemical Mechanical Planarization (CMP) Market Attractiveness Analysis
13. Global Chemical Mechanical Planarization (CMP) Company Market Share Analysis, 2021
13.1. Competition Matrix
13.2. Market Footprint Analysis
13.2.1. By Equipment
13.2.2. By Application
13.3. Company Profiles (Details – Overview, Financials, Recent Developments, and Strategy)
13.3.1. Applied Materials, Inc.
13.3.1.1. Company Description
13.3.1.2. Business Overview
13.3.1.3. Financial Details
13.3.1.4. Strategic Overview
13.3.2. CMC Materials, Inc.
13.3.2.1. Company Description
13.3.2.2. Business Overview
13.3.2.3. Financial Details
13.3.2.4. Strategic Overview
13.3.3. Fujimi Incorporated
13.3.3.1. Company Description
13.3.3.2. Business Overview
13.3.3.3. Financial Details
13.3.3.4. Strategic Overview
13.3.4. Hitachi Chemical Co., Ltd.
13.3.4.1. Company Description
13.3.4.2. Business Overview
13.3.4.3. Financial Details
13.3.4.4. Strategic Overview
13.3.5. Ebara Corporation
13.3.5.1. Company Description
13.3.5.2. Business Overview
13.3.5.3. Financial Details
13.3.5.4. Strategic Overview
13.3.6. Versum Materials, Inc.
13.3.6.1. Company Description
13.3.6.2. Business Overview
13.3.6.3. Financial Details
13.3.6.4. Strategic Overview
13.3.7. DuPont Electronic Solutions
13.3.7.1. Company Description
13.3.7.2. Business Overview
13.3.7.3. Financial Details
13.3.7.4. Strategic Overview
13.3.8. BASF SE
13.3.8.1. Company Description
13.3.8.2. Business Overview
13.3.8.3. Financial Details
13.3.8.4. Strategic Overview
13.3.9. Lam Research Corporation
13.3.9.1. Company Description
13.3.9.2. Business Overview
13.3.9.3. Financial Details
13.3.9.4. Strategic Overview
13.3.10. Intel Corporation
13.3.10.1. Company Description
13.3.10.2. Business Overview
13.3.10.3. Financial Details
13.3.10.4. Strategic Overview
13.3.11. Samsung Electronics Co., Ltd.
13.3.11.1. Company Description
13.3.11.2. Business Overview
13.3.11.3. Financial Details
13.3.11.4. Strategic Overview
13.3.12. Micron Technology, Inc.
13.3.12.1. Company Description
13.3.12.2. Business Overview
13.3.12.3. Financial Details
13.3.12.4. Strategic Overview
13.3.13. Taiwan Semiconductor Manufacturing Company Limited
13.3.13.1. Company Description
13.3.13.2. Business Overview
13.3.13.3. Financial Details
13.3.13.4. Strategic Overview
13.3.14. Okamoto Machine Tool Works, Ltd.
13.3.14.1. Company Description
13.3.14.2. Business Overview
13.3.14.3. Financial Details
13.3.14.4. Strategic Overview
13.3.15. Alpsitec SAS
13.3.15.1. Company Description
13.3.15.2. Business Overview
13.3.15.3. Financial Details
13.3.15.4. Strategic Overview
13.3.16. Axus Technology
13.3.16.1. Company Description
13.3.16.2. Business Overview
13.3.16.3. Financial Details
13.3.16.4. Strategic Overview
13.3.17. Revasum
13.3.17.1. Company Description
13.3.17.2. Business Overview
13.3.17.3. Financial Details
13.3.17.4. Strategic Overview
13.3.18. GlobalFoundries Inc.
13.3.18.1. Company Description
13.3.18.2. Business Overview
13.3.18.3. Financial Details
13.3.18.4. Strategic Overview
14. Primary Research: Key Insights
15. Appendix
List of Tables
Table 01: Global Chemical Mechanical Planarization Market Value (US$ Mn) Forecast, by Equipment, 2018–2027
Table 02: Global Chemical Mechanical Planarization (CMP) Market Value (US$ Mn) Forecast, by Consumables, 2018–2027
Table 03: Global Chemical Mechanical Planarization (CMP) Consumables Market Value (US$ Mn) Forecast, Application by Consumables, 2018–2027
Table 04: Global Chemical Mechanical Planarization (CMP) Market Value (US$ Mn) Forecast, by Region, 2018–2027
Table 05: North America Chemical Mechanical Planarization (CMP) Market Value (US$ Mn) Forecast, by Equipment, 2018–2027
Table 06: North America Chemical Mechanical Planarization (CMP) Market Value (US$ Mn) Forecast, by Consumables, 2018–2027
Table 07: North America Chemical Mechanical Planarization (CMP) Consumables Market Value (US$ Mn) Forecast, by Application, 2018–2027
Table 08: North America Chemical Mechanical Planarization (CMP) Market Value (US$ Mn) Forecast, by Country, 2018–2027
Table 09: U.S Chemical Mechanical Planarization (CMP) Market Value (US$ Mn) Forecast, by Equipment, 2018–2027
Table 10: U.S Chemical Mechanical Planarization (CMP) Market Value (US$ Mn) Forecast, by Consumables, 2018–2027
Table 11: U.S Chemical Mechanical Planarization (CMP) Consumables Market Value (US$ Mn) Forecast, by Application, 2018–2027
Table 12: Canada Chemical Mechanical Planarization (CMP) Market Value (US$ Mn) Forecast, by Equipment, 2018–2027
Table 13: Canada Chemical Mechanical Planarization (CMP) Market Value (US$ Mn) Forecast, by Consumables, 2018–2027
Table 14: Canada Chemical Mechanical Planarization (CMP) Consumables Market Value (US$ Mn) Forecast, by Application, 2018–2027
Table 15: Europe Chemical Mechanical Planarization Market Value (US$ Mn) Forecast, by Equipment, 2018–2027
Table 16: Europe Chemical Mechanical Planarization (CMP) Market Value (US$ Mn) Forecast, by Consumables, 2018–2027
Table 17: Europe Chemical Mechanical Planarization (CMP) Consumables Market Value (US$ Mn) Forecast, by Application, 2018–2027
Table 18: Europe Chemical Mechanical Planarization (CMP) Market Value (US$ Mn) Forecast, by Country and Sub-region, 2018–2027
Table 19: Germany Chemical Mechanical Planarization Market Value (US$ Mn) Forecast, by Equipment, 2018–2027
Table 20: Germany Chemical Mechanical Planarization (CMP) Market Value (US$ Mn) Forecast, by Consumables, 2018–2027
Table 21: Germany Chemical Mechanical Planarization (CMP) Consumables Market Value (US$ Mn) Forecast, by Application, 2018–2027
Table 22: U.K. Chemical Mechanical Planarization (CMP) Market Value (US$ Mn) Forecast, by Equipment, 2018–2027
Table 23: U.K. Chemical Mechanical Planarization (CMP) Market Value (US$ Mn) Forecast, by Consumables, 2018–2027
Table 24: U.K Chemical Mechanical Planarization (CMP) Consumables Market Value (US$ Mn) Forecast, by Application, 2018–2027
Table 25: France Chemical Mechanical Planarization (CMP) Market Value (US$ Mn) Forecast, by Equipment, 2018–2027
Table 26: France Chemical Mechanical Planarization (CMP) Market Value (US$ Mn) Forecast, by Consumables, 2018–2027
Table 27: France Chemical Mechanical Planarization (CMP) Consumables Market Value (US$ Mn) Forecast, by Application, 2018–2027
Table 28: Italy Chemical Mechanical Planarization (CMP) Market Value (US$ Mn) Forecast, by Equipment, 2018–2027
Table 29: Italy Chemical Mechanical Planarization (CMP) Market Value (US$ Mn) Forecast, by Consumables, 2018–2027
Table 30: Italy Chemical Mechanical Planarization (CMP) Consumables Market Value (US$ Mn) Forecast, by Application, 2018–2027
Table 31: Spain Chemical Mechanical Planarization (CMP) Market Value (US$ Mn) Forecast, by Equipment, 2018–2027
Table 32: Spain Chemical Mechanical Planarization (CMP) Market Value (US$ Mn) Forecast, by Consumables, 2018–2027
Table 33: Spain Chemical Mechanical Planarization (CMP) Consumables Market Value (US$ Mn) Forecast, by Application, 2018–2027
Table 34: Russia & CIS Chemical Mechanical Planarization (CMP) Market Value (US$ Mn) Forecast, by Equipment, 2018–2027
Table 35: Russia & CIS Chemical Mechanical Planarization (CMP) Market Value (US$ Mn) Forecast, by Consumables, 2018–2027
Table 36: Russia & CIS Chemical Mechanical Planarization (CMP) Consumables Market Value (US$ Mn) Forecast, by Application, 2018–2027
Table 37: Rest of Europe Chemical Mechanical Planarization (CMP) Market Value (US$ Mn) Forecast, by Equipment, 2018–2027
Table 38: Rest of Europe Chemical Mechanical Planarization (CMP) Market Value (US$ Mn) Forecast, by Consumables, 2018–2027
Table 39: Rest of Europe Chemical Mechanical Planarization (CMP) Consumables Market Value (US$ Mn) Forecast, by Application, 2018–2027
Table 40: Asia Pacific Chemical Mechanical Planarization Market Value (US$ Mn) Forecast, by Equipment, 2018–2027
Table 41: Asia Pacific Chemical Mechanical Planarization (CMP) Market Value (US$ Mn) Forecast, by Consumables, 2018–2027
Table 42: Asia Pacific Chemical Mechanical Planarization (CMP) Consumables Market Value (US$ Mn) Forecast, by Application, 2018–2027
Table 43: Asia Pacific Chemical Mechanical Planarization (CMP) Market Value (US$ Mn) Forecast, by Country and Sub-region, 2018–2027
Table 44: China Chemical Mechanical Planarization Market Value (US$ Mn) Forecast, by Equipment, 2018–2027
Table 45: China Chemical Mechanical Planarization (CMP) Market Value (US$ Mn) Forecast, by Consumables, 2018–2027
Table 46: China Chemical Mechanical Planarization (CMP) Consumables Market Value (US$ Mn) Forecast, by Application, 2018–2027
Table 47: India Chemical Mechanical Planarization (CMP) Market Value (US$ Mn) Forecast, by Equipment, 2018–2027
Table 48: India Chemical Mechanical Planarization (CMP) Market Value (US$ Mn) Forecast, by Consumables, 2018–2027
Table 49: India Chemical Mechanical Planarization (CMP) Consumables Market Value (US$ Mn) Forecast, by Application, 2018–2027
Table 50: Japan Chemical Mechanical Planarization (CMP) Market Value (US$ Mn) Forecast, by Equipment, 2018–2027
Table 51: Japan Chemical Mechanical Planarization (CMP) Market Value (US$ Mn) Forecast, by Consumables, 2018–2027
Table 52: Japan Chemical Mechanical Planarization (CMP) Consumables Market Value (US$ Mn) Forecast, by Application, 2018–2027
Table 53: ASEAN Chemical Mechanical Planarization (CMP) Market Value (US$ Mn) Forecast, by Equipment, 2018–2027
Table 54: ASEAN Chemical Mechanical Planarization (CMP) Market Value (US$ Mn) Forecast, by Consumables, 2018–2027
Table 55: ASEAN Chemical Mechanical Planarization (CMP) Consumables Market Value (US$ Mn) Forecast, by Application, 2018–2027
Table 56: Rest of Asia Pacific Chemical Mechanical Planarization (CMP) Market Value (US$ Mn) Forecast, by Equipment, 2018–2027
Table 57: Rest of Asia Pacific Chemical Mechanical Planarization (CMP) Market Value (US$ Mn) Forecast, by Consumables, 2018–2027
Table 58: Rest of Asia Pacific Chemical Mechanical Planarization (CMP) Consumables Market Value (US$ Mn) Forecast, by Application, 2018–2027
Table 59: Latin America Chemical Mechanical Planarization Market Value (US$ Mn) Forecast, by Equipment, 2018–2027
Table 60: Latin America Chemical Mechanical Planarization (CMP) Market Value (US$ Mn) Forecast, by Consumables, 2018–2027
Table 61: Latin America Chemical Mechanical Planarization (CMP) Consumables Market Value (US$ Mn) Forecast, by Application, 2018–2027
Table 62: Latin America Chemical Mechanical Planarization (CMP) Market Value (US$ Mn) Forecast, by Country and Sub-region, 2018–2027
Table 63: Brazil Chemical Mechanical Planarization Market Value (US$ Mn) Forecast, by Equipment, 2018–2027
Table 64: Brazil Chemical Mechanical Planarization (CMP) Market Value (US$ Mn) Forecast, by Consumables, 2018–2027
Table 65: Brazil Chemical Mechanical Planarization (CMP) Consumables Market Value (US$ Mn) Forecast, by Application, 2018–2027
Table 66: Mexico Chemical Mechanical Planarization (CMP) Market Value (US$ Mn) Forecast, by Equipment, 2018–2027
Table 67: Mexico Chemical Mechanical Planarization (CMP) Market Value (US$ Mn) Forecast, by Consumables, 2018–2027
Table 68: Mexico Chemical Mechanical Planarization (CMP) Consumables Market Value (US$ Mn) Forecast, by Application, 2018–2027
Table 69: Rest of Latin America Chemical Mechanical Planarization (CMP) Market Value (US$ Mn) Forecast, by Equipment, 2018–2027
Table 70: Rest of Latin America Chemical Mechanical Planarization (CMP) Market Value (US$ Mn) Forecast, by Consumables, 2018–2027
Table 71: Rest of Latin America Chemical Mechanical Planarization (CMP) Consumables Market Value (US$ Mn) Forecast, by Application, 2018–2027
Table 72: Middle East & Africa Chemical Mechanical Planarization Market Value (US$ Mn) Forecast, by Equipment, 2018–2027
Table 73: Middle East & Africa Chemical Mechanical Planarization (CMP) Market Value (US$ Mn) Forecast, by Consumables, 2018–2027
Table 74: Middle East & Africa Chemical Mechanical Planarization (CMP) Consumables Market Value (US$ Mn) Forecast, by Application, 2018–2027
Table 75: Middle East & Africa Chemical Mechanical Planarization (CMP) Market Value (US$ Mn) Forecast, by Country and Sub-region, 2018–2027
Table 76: GCC Chemical Mechanical Planarization Market Value (US$ Mn) Forecast, by Equipment, 2018–2027
Table 77: GCC Chemical Mechanical Planarization (CMP) Market Value (US$ Mn) Forecast, by Consumables, 2018–2027
Table 78: GCC Chemical Mechanical Planarization (CMP) Consumables Market Value (US$ Mn) Forecast, by Application, 2018–2027
Table 79: South Africa Chemical Mechanical Planarization (CMP) Market Value (US$ Mn) Forecast, by Equipment, 2018–2027
Table 80: South Africa Chemical Mechanical Planarization (CMP) Market Value (US$ Mn) Forecast, by Consumables, 2018–2027
Table 81: South Africa Chemical Mechanical Planarization (CMP) Consumables Market Value (US$ Mn) Forecast, by Application, 2018–2027
Table 82: Rest of Middle East & Africa Chemical Mechanical Planarization (CMP) Market Value (US$ Mn) Forecast, by Equipment, 2018–2027
Table 83: Rest of Middle East & Africa Chemical Mechanical Planarization (CMP) Market Value (US$ Mn) Forecast, by Consumables, 2018–2027
Table 84: Rest of Middle East & Africa Chemical Mechanical Planarization (CMP) Consumables Market Value (US$ Mn) Forecast, by Application, 2018–2027
List of Figures
Figure 01: Global CMP Market Snapshot
Figure 02: CMP Market in 2018, Application, By Consumables
Figure 03: Global Chemical Mechanical Planarization (CMP) Market Value (US$ Mn) Forecast, 2018–2027
Figure 04: Global Chemical Mechanical Planarization (CMP) Market Attractiveness Analysis, by Country and Sub-region
Figure 05: Global Chemical Mechanical Planarization Market Value Share Analysis, by Equipment, 2018 and 2027
Figure 06: Global Chemical Mechanical Planarization Market Value Share Analysis, by Consumables, 2018 and 2027
Figure 07: Global Chemical Mechanical Planarization Consumables Market Value Share Analysis, by Application, 2018 and 2027
Figure 08: Global Chemical Mechanical Planarization Market Value Share Analysis, by Region, 2018 and 2027
Figure 09: Global Chemical Mechanical Planarization Market Attractiveness Analysis, by Equipment
Figure 10: Global Chemical Mechanical Planarization Market Attractiveness Analysis, by Consumables
Figure 11: Global Chemical Mechanical Planarization Consumables Market Attractiveness Analysis, by Application
Figure 12: North America Chemical Mechanical Planarization (CMP) Market Value (US$ Mn ) Forecast, 2018–2027
Figure 13: North America Chemical Mechanical Planarization (CMP) Market Attractiveness Analysis, by Country
Figure 14: North America Chemical Mechanical Planarization (CMP) Market Value Share Analysis, by Equipment, 2018 and 2027
Figure 15: North America Chemical Mechanical Planarization (CMP) Market Value Share Analysis, by Consumables, 2018 and 2027
Figure 16: North America Chemical Mechanical Planarization Consumables Market Value Share Analysis, by Application, 2018 and 2027
Figure 17: North America Chemical Mechanical Planarization (CMP) Market Value Share Analysis, by Country, 2018 and 2027
Figure 18: North America Chemical Mechanical Planarization (CMP) Market Attractiveness Analysis, by Equipment
Figure 19: North America Chemical Mechanical Planarization (CMP) Market Attractiveness Analysis, by Consumables
Figure 20: North America Chemical Mechanical Planarization Consumables Market Attractiveness Analysis, by Application
Figure 21: Europe Chemical Mechanical Planarization (CMP) Market Value (US$ Mn) Forecast, 2018–2027
Figure 22: Europe Chemical Mechanical Planarization (CMP) Market Attractiveness Analysis, by Country and Sub-region
Figure 23: Europe Chemical Mechanical Planarization Market Value Share Analysis, by Equipment, 2018 and 2027
Figure 24: Europe Chemical Mechanical Planarization Market Value Share Analysis, by Consumables, 2018 and 2027
Figure 25: Europe Chemical Mechanical Planarization Consumables Market Value Share Analysis, by Application, 2018 and 2027
Figure 26: Europe Chemical Mechanical Planarization Market Value Share Analysis, by Country and Sub-region,2018 and 2027
Figure 27: Europe Chemical Mechanical Planarization Market Attractiveness Analysis, by Equipment
Figure 28: Europe Chemical Mechanical Planarization Market Attractiveness Analysis, by Consumables
Figure 29: Europe Chemical Mechanical Planarization Consumables Market Attractiveness Analysis, by Application
Figure 30: Asia Pacific Chemical Mechanical Planarization (CMP) Market Value (US$ Mn) Forecast, 2018–2027
Figure 31: Asia Pacific Chemical Mechanical Planarization (CMP) Market Attractiveness Analysis, by Country and Sub-region
Figure 32: Asia Pacific Chemical Mechanical Planarization Market Value Share Analysis, by Equipment, 2018 and 2027
Figure 33: Asia Pacific Chemical Mechanical Planarization Market Value Share Analysis, by Consumables, 2018 and 2027
Figure 34: Asia Pacific Chemical Mechanical Planarization Consumables Market Value Share Analysis, by Application, 2018 and 2027
Figure 35: Asia Pacific Chemical Mechanical Planarization Market Value Share Analysis, by Country and Sub-region, 2018 and 2027
Figure 36: Asia Pacific Chemical Mechanical Planarization Market Attractiveness Analysis, by Equipment
Figure 37: Asia Pacific Chemical Mechanical Planarization Market Attractiveness Analysis, by Consumables
Figure 38: Asia Pacific Chemical Mechanical Planarization Consumables Market Attractiveness Analysis, by Application
Figure 39: Latin America Chemical Mechanical Planarization (CMP) Market Value (US$ Mn) Forecast, 2018–2027
Figure 40: Latin America Chemical Mechanical Planarization (CMP) Market Attractiveness Analysis, by Country and Sub-region
Figure 41: Latin America Chemical Mechanical Planarization Market Value Share Analysis, by Equipment, 2018 and 2027
Figure 42: Latin America Chemical Mechanical Planarization Market Value Share Analysis, by Consumables, 2018 and 2027
Figure 43: Latin America Chemical Mechanical Planarization Consumables Market Value Share Analysis, by Application, 2018 and 2027
Figure 44: Latin America Chemical Mechanical Planarization Market Value Share Analysis, by Country and Sub-region, 2018 and 2027
Figure 45: Latin America Chemical Mechanical Planarization Market Attractiveness Analysis, by Equipment
Figure 46: Latin America Chemical Mechanical Planarization Market Attractiveness Analysis, by Consumables
Figure 47: Latin America Chemical Mechanical Planarization Consumables Market Attractiveness Analysis, by Application
Figure 48: Middle East & Africa Chemical Mechanical Planarization (CMP) Market Value (US$ Mn) Forecast, 2018–2027
Figure 49: Middle East & Africa Chemical Mechanical Planarization (CMP) Market Attractiveness Analysis, by Country and Sub-region
Figure 50: Middle East & Africa Chemical Mechanical Planarization Market Value Share Analysis, by Equipment, 2018 and 2027
Figure 51: Middle East & Africa Chemical Mechanical Planarization Market Value Share Analysis, by Consumables, 2018 and 2027
Figure 52: Middle East & Africa Chemical Mechanical Planarization Consumables Market Value Share Analysis, by Application, 2018 and 2027
Figure 53: Middle East & Africa Chemical Mechanical Planarization Market Value Share Analysis, by Country and Sub-region, 2018 and 2027
Figure 54: Middle East & Africa Chemical Mechanical Planarization Market Attractiveness Analysis, by Equipment
Figure 55: Middle East & Africa Chemical Mechanical Planarization Market Attractiveness Analysis, by Consumables
Figure 56: Middle East & Africa Chemical Mechanical Planarization Consumables Market Attractiveness Analysis, by Application
Figure 57: Chemical Mechanical Planarization (CMP) Consumables Market Share Analysis, by Company Revenue, 2018
Figure 58: Chemical Mechanical Planarization (CMP) Equipment Market Share Analysis, by Company Revenue, 2018
Copyright © Transparency Market Research, Inc. All Rights reserved
Trust Online

Chemical Mechanical Planarization Market