
Reports
Reports
Health advantages of veganism are increasingly catching the attention of pro-health consumers. Hence, stakeholders in the cashew milk market are tapping opportunities in dairy goods to meet consumer requirements. For instance, New York-based restaurant chain 16 Handles, announced the launch of their new line of vegan soft serve flavors, including their latest cashew milk-based flavor, made from proprietary recipes and natural ingredients. Stakeholders are increasing efforts to strike the right balance between health and indulgence to meet niche requirements of consumers.
As a result of collaborations, the cashew milk market is currently valued at ~US$ 91 Mn and is estimated to surpass the ~US$ 193 Mn by the end of 2029. Stakeholders are adopting strategies to create a demand for ‘limited-time-only’ cashew milk-based bakery items, such as vegan chocolate chip cookie dough toppings. Another driver that is triggering the growth of the cashew milk market is high prevalence of lactose-intolerant consumers.
Several drivers such as the emergence of plant-based foods is helping to contribute toward market growth. Likewise, cashew milk is being highly publicized as a plant-based beverage rich in calcium. Its low fat and low in sugar attributes are catching the attention of consumers. Companies in the cashew milk market are gaining prominence in the F&B sector, since cashew milk is gradually replacing conventional dairy milk among several consumers. Thus, companies are capitalizing on this trend and are developing cashew milk that is gluten free. For instance, Sanitarium-a health and wellbeing company, excels in the production of cashew milk, which is gluten and cholesterol free.
An alarming rate of deaths caused due to high cholesterol in patients has fueled the demand for low-fat milk such as cashew milk. Individuals with deficiencies of vitamin B2 and B12 are increasingly opting for cashew milk. Another trend engulfing the cashew milk market is the demand for frozen desserts. Stakeholders in the value chain are increasing their portfolio in non-dairy products such as cashew milk-, almond milk-, and coconut milk-based frozen desserts.
Apart from leading players, even startups are capitalizing on the trend of plant-based and non-dairy food items. For instance, manufacturer of plant-based food products, Benni Alimentos, announced the launch of soluble cashew milk powder to meet consumer requirements for plant-based milk alternatives. Companies are increasing R&D to boost the shelf life of plant-based products. This research has helped companies to gain competitive edge over the others, since conventional plant-based products degrade in a short span of time, thus leading to issues of food wastage. Hence, startups in the cashew milk market are developing plant-based products with longer shelf life by introducing powdered milk.
Cashew milk is expensive on the pocket of consumers, as compared to conventional dairy milk. Hence, companies in the cashew milk market are increasing production capabilities to produce cashew nut milk powder so that consumers need not throw away cashew milk, since milk has a much shorter shelf life.
Plant-based dairy and convenience foods are being highly publicized at various food events. For instance, plant-based cheese maker, Parmela Creamery, revealed its traditionally cultured and age-processed cheese made from cashew milk at the 2019 Natural Products Expo East event. Companies in the cashew milk market are expanding their product portfolio in smoky spreads and familiar flavors of cheddar and Havarti cheese.
The ever-increasing demand for vegan and dairy-free food has led to the adoption of cashew milk-based products. As such, the demand for cashew milk-based products is growing in Australia. Companies in the cashew milk market are increasing efforts to strengthen their export business for cashew-based non-dairy cream cheese and other vegan-friendly products. Cashewgurt is another addition in the product line of cashew milk-based products. Growing awareness about GMO-free products has contributed toward market growth. Companies are using nutritious ingredients such as inulin to enhance calcium absorption through cashew milk powders.
Analysts’ Viewpoint
The cashew milk market is projected to grow at a healthy CAGR of 7% during the forecast period. This indicates that consumers are inclining toward foods with cashew flavor. Likewise, companies are increasing production capabilities to produce cashew milk powders in vanilla and chocolate flavors. Nut milks are growing popular in Brazil.
Cashew milk is being highly publicized for its nutritional value such as high calcium and low fat attributes. However, cashew milk has a short shelf life. Hence, companies are increasing R&D and are producing soluble cashew milk powders with extended shelf life to cater to the needs of consumers and reduce issues of food wastage.
Cashew Milk Market: Overview
Cashew Milk: Market Frontrunners
Cashew Milk Market: Trends
Cashew Milk Market: Players
Cashew Milk Market is projected to reach US$ 193 Mn by the end of 2029
Cashew Milk Market is expected to grow at a CAGR of 7% during 2019-2029
Rising trend of drinking low calories drinks expected to drive Cashew Milk Market
North America is more attractive region for vendors in the Cashew Milk Market
Key vendors in the Cashew Milk Market are WhiteWave Services, Inc.,Blue Diamond Growers,Provamel,Dream Blends, So Delicious Dairy Free
1. Executive Summary
1.1. Global Market Outlook
1.2. Demand Side Trends
1.3. Supply Side Trends
1.4. Technology Roadmap
1.5. Analysis and Recommendations
2. Market Overview
2.1. Market Coverage / Taxonomy
2.2. Market Definition / Scope / Limitations
3. Key Market Trends
3.1. Key Trends Impacting the Market
3.1.1. Transformed Packaging Format
3.1.2. Increased advertising spend
3.1.3. Brandishing Functional claims to acquire new customers
3.1.4. Increased retail shelves visibility
3.2. Product Innovation / Development Trends
4. Market Background
4.1. Macro-Economic Factors
4.1.1. Global GDP Growth Outlook
4.1.2. Global Food Industry Outlook
4.1.3. Rise in Consumption of Food Items across Globe
4.1.4. Global and Regional Per Capita Food Consumption (Kcal per capita per day)
4.1.5. Population Growth by Key Countries
4.1.6. Dairy Health Impacts
4.1.7. Rise in Disposable Income
4.1.8. Others
4.2. Forecast Factors - Relevance & Impact
4.2.1. Adoption of public and private Safety Standards by manufactures
4.2.2. Transparency – the embracing trend
4.2.3. Foodborne Illness
4.2.4. Label Claims
4.2.5. Balance of Trade
4.2.6. Rising demand for safe and quality food products among consumers
4.2.7. Demand for ethical and sustainable products
4.2.8. Local Food Movement
4.3. Market Dynamics
4.3.1. Drivers
4.3.2. Restraints
4.3.3. Opportunity Analysis
4.4. Value Chain Analysis
4.4.1. List of Key Manufacturers
4.4.2. List of Key Brand Owners
4.4.3. Brand Owner and Manufacturer (Who Supplies Whom)
4.4.4. Operating Margins
5. Survey Analysis
5.1. Consumer Sentimental Analysis
5.1.1. Factors influencing target market behaviour
5.1.2. Which specific brand is preferred by the consumers and why?
5.1.3. How consumers perceive the existing target market brands in terms of value for money and how important is brand for a customer?
5.1.4. Which factor would consumers like to change among the currently available target market products
5.1.5. Are consumers ready to pay premium price for target market product type?
5.1.6. Does social media influence customer’s decision making?
5.1.7. Which mode of advertisement does vendors prefer?
5.1.8. Which of the social media platforms does companies prefers for branding?
5.1.9. What are the key challenges associated with the target market suppliers?
5.1.10. Others
5.2. Social Media Sentimental Analysis
5.2.1. Consumer perception for products on social media platforms- Positive and Negative Mentions
5.2.2. Trending Brands
5.2.3. Social Media Platform Mentions (% of total mentions)
5.2.4. Region-wise Social Media Mentions (% total mentions)
5.2.5. Overall Sentiment on Social Media Platforms- By End Use Applications
5.2.6. Others
6. Key Success Factors
6.1. Product Adoption / Consumption Analysis
6.2. Product Attractiveness amongst Target Audience
6.3. Strategic Promotional Strategies
7. Global Cashew Milk Market Demand Analysis 2014–2018 and Forecast, 2019–2029
7.1. Historical Market Volume (Mn Units) Analysis, 2014–2018
7.2. Current and Future Market Volume (Mn Units) Projections, 2019–2029
7.3. Y-o-Y Growth Trend Analysis
8. Global Cashew Milk Market - Pricing Analysis
8.1. Regional Pricing Analysis By Product Type
8.2. Pricing Break-up
8.2.1. Manufacturer Level Pricing
8.2.2. Distributor Level Pricing
8.3. Global Average Pricing Analysis Benchmark
9. Global Cashew Milk Market Demand (in Value or Size in US$ Mn) Analysis 2014–2018 and Forecast, 2019–2029
9.1. Historical Market Value (US$ Mn) Analysis, 2014–2018
9.2. Current and Future Market Value (US$ Mn) Projections, 2019–2029
9.2.1. Y-o-Y Growth Trend Analysis
9.2.2. Absolute $ Opportunity Analysis
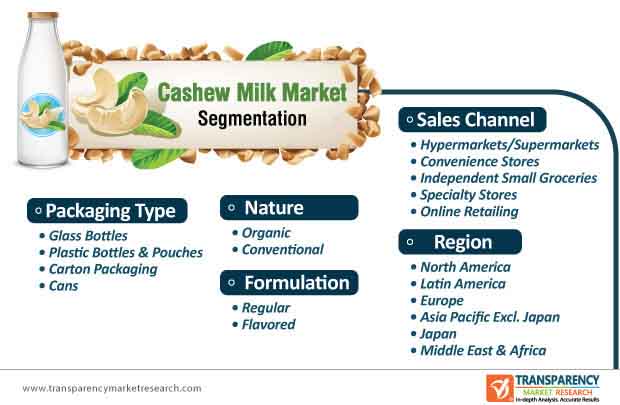
10. Global Cashew Milk Market Analysis 2014–2018 and Forecast 2019–2029, by Formulations
10.1. Introduction / Key Findings
10.2. Historical Market Size (US$ Mn) and Volume Analysis By Formulations, 2014–2018
10.3. Current and Future Market Size (US$ Mn) and Volume Analysis and Forecast By Formulations, 2019–2029
10.3.1. Regular
10.3.2. Flavoured
10.4. Market Attractiveness Analysis By Formulations
11. Global Cashew Milk Market Analysis 2014–2018 and Forecast 2019–2029, by Nature
11.1. Introduction / Key Findings
11.2. Historical Market Size (US$ Mn) and Volume Analysis By Nature, 2014–2018
11.3. Current and Future Market Size (US$ Mn) and Volume Analysis and Forecast By Nature, 2019–2029
11.3.1. Organic
11.3.2. Conventional
11.4. Market Attractiveness Analysis By Nature
12. Global Cashew Milk Market Analysis 2014–2018 and Forecast 2019–2029, by Packaging Type
12.1. Introduction / Key Findings
12.2. Historical Market Size (US$ Mn) and Volume Analysis By Packaging Type, 2014–2018
12.3. Current and Future Market Size (US$ Mn) and Volume Analysis and Forecast By Packaging Type, 2019–2029
12.3.1. Glass Bottles
12.3.2. Plastic Bottles & Pouches
12.3.3. Carton Packaging
12.3.4. Cans
12.4. Market Attractiveness Analysis By Packaging Type
13. Global Cashew Milk Market Analysis 2014–2018 and Forecast 2019–2029, by Sales Channel
13.1. Introduction / Key Findings
13.2. Historical Market Size (US$ Mn) and Volume Analysis By Sales Channel, 2014–2018
13.3. Current and Future Market Size (US$ Mn) and Volume Analysis and Forecast By Sales Channel, 2019–2029
13.3.1. Hypermarket/Supermarket
13.3.2. Convenience store
13.3.3. Independent Small Groceries
13.3.4. Speciality Stores
13.3.5. Online Retailing
13.4. Market Attractiveness Analysis By Sales Channel
14. Global Cashew Milk Market Analysis 2014–2018 and Forecast 2019–2029, by Region
14.1. Introduction
14.2. Historical Market Size (US$ Mn) and Volume Analysis By Region, 2014–2018
14.3. Current Market Size (US$ Mn) and Volume Analysis and Forecast By Region, 2019–2029
14.3.1. North America
14.3.2. Latin America
14.3.3. Europe
14.3.4. Middle East and Africa (MEA)
14.3.5. East Asia
14.3.6. South Asia
14.3.7. Oceania
14.4. Market Attractiveness Analysis By Region
15. North America Cashew Milk Market Analysis 2014–2018 and Forecast 2019–2029
15.1. Introduction
15.2. Pricing Analysis
15.3. Historical Market Size (US$ Mn) and Volume Trend Analysis By Market Taxonomy, 2014–2018
15.4. Market Size (US$ Mn) and Volume Forecast By Market Taxonomy, 2019–2029
15.4.1. By Country
15.4.1.1. U.S.
15.4.1.2. Canada
15.4.2. By Formulations
15.4.3. By Nature
15.4.4. By Packaging Type
15.4.5. By Sales Channel
15.5. Market Attractiveness Analysis
15.5.1. By Country
15.5.2. By Formulations
15.5.3. By Nature
15.5.4. By Packaging Type
15.5.5. By Sales Channel
15.6. Market Trends
15.7. Key Market Participants - Intensity Mapping
15.8. Drivers and Restraints - Impact Analysis
16. Latin America Cashew Milk Market Analysis 2014–2018 and Forecast 2019–2029
16.1. Introduction
16.2. Pricing Analysis
16.3. Historical Market Size (US$ Mn) and Volume Trend Analysis By Market Taxonomy, 2014–2018
16.4. Market Size (US$ Mn) and Volume Forecast By Market Taxonomy, 2019–2029
16.4.1. By Country
16.4.1.1. Brazil
16.4.1.2. Mexico
16.4.1.3. Rest of Latin America
16.4.2. By Formulations
16.4.3. By Nature
16.4.4. By Packaging Type
16.4.5. By Sales Channel
16.5. Market Attractiveness Analysis
16.5.1. By Country
16.5.2. By Formulations
16.5.3. By Nature
16.5.4. By Packaging Type
16.5.5. By Sales Channel
16.6. Market Trends
16.7. Key Market Participants - Intensity Mapping
16.8. Drivers and Restraints - Impact Analysis
17. Europe Cashew Milk Market Analysis 2014–2018 and Forecast 2019–2029
17.1. Introduction
17.2. Pricing Analysis
17.3. Historical Market Size (US$ Mn) and Volume Trend Analysis By Market Taxonomy, 2014–2018
17.4. Market Size (US$ Mn) and Volume Forecast By Market Taxonomy, 2019–2029
17.4.1. By Country
17.4.1.1. Germany
17.4.1.2. Italy
17.4.1.3. France
17.4.1.4. U.K.
17.4.1.5. Spain
17.4.1.6. BENELUX
17.4.1.7. Russia
17.4.1.8. Rest of Europe
17.4.2. By Formulations
17.4.3. By Nature
17.4.4. By Packaging Type
17.4.5. By Sales Channel
17.5. Market Attractiveness Analysis
17.5.1. By Country
17.5.2. By Formulations
17.5.3. By Nature
17.5.4. By Packaging Type
17.5.5. By Sales Channel
17.6. Market Trends
17.7. Key Market Participants - Intensity Mapping
17.8. Drivers and Restraints - Impact Analysis
18. South Asia Cashew Milk Market Analysis 2014–2018 and Forecast 2019–2029
18.1. Introduction
18.2. Pricing Analysis
18.3. Historical Market Size (US$ Mn) and Volume Trend Analysis By Market Taxonomy, 2014–2018
18.4. Market Size (US$ Mn) and Volume Forecast By Market Taxonomy, 2019–2029
18.4.1. By Country
18.4.1.1. India
18.4.1.2. Thailand
18.4.1.3. Indonesia
18.4.1.4. Malaysia
18.4.1.5. Rest of South Asia
18.4.2. By Formulations
18.4.3. By Nature
18.4.4. By Packaging Type
18.4.5. By Sales Channel
18.5. Market Attractiveness Analysis
18.5.1. By Country
18.5.2. By Formulations
18.5.3. By Nature
18.5.4. By Packaging Type
18.5.5. By Sales Channel
18.6. Market Trends
18.7. Key Market Participants - Intensity Mapping
18.8. Drivers and Restraints - Impact Analysis
19. East Asia Cashew Milk Market Analysis 2014–2018 and Forecast 2019–2029
19.1. Introduction
19.2. Pricing Analysis
19.3. Historical Market Size (US$ Mn) and Volume Trend Analysis By Market Taxonomy, 2014–2018
19.4. Market Size (US$ Mn) and Volume Forecast By Market Taxonomy, 2019–2029
19.4.1. By Country
19.4.1.1. China
19.4.1.2. Japan
19.4.1.3. South Korea
19.4.2. By Formulations
19.4.3. By Nature
19.4.4. By Packaging Type
19.4.5. By Sales Channel
19.5. Market Attractiveness Analysis
19.5.1. By Country
19.5.2. By Formulations
19.5.3. By Nature
19.5.4. By Packaging Type
19.5.5. By Sales Channel
19.6. Market Trends
19.7. Key Market Participants - Intensity Mapping
19.8. Drivers and Restraints - Impact Analysis
20. Oceania Cashew Milk Market Analysis 2014–2018 and Forecast 2019–2029
20.1. Introduction
20.2. Pricing Analysis
20.3. Historical Market Size (US$ Mn) and Volume Trend Analysis By Market Taxonomy, 2014–2018
20.4. Market Size (US$ Mn) and Volume Forecast By Market Taxonomy, 2019–2029
20.4.1. By Country
20.4.1.1. Australia
20.4.1.2. New Zealand
20.4.2. By Formulations
20.4.3. By Nature
20.4.4. By Packaging Type
20.4.5. By Sales Channel
20.5. Market Attractiveness Analysis
20.5.1. By Country
20.5.2. By Formulations
20.5.3. By Nature
20.5.4. By Packaging Type
20.5.5. By Sales Channel
20.6. Market Trends
20.7. Key Market Participants - Intensity Mapping
20.8. Drivers and Restraints - Impact Analysis
21. Middle East and Africa Cashew Milk Market Analysis 2014–2018 and Forecast 2019–2029
21.1. Introduction
21.2. Pricing Analysis
21.3. Historical Market Size (US$ Mn) and Volume Trend Analysis By Market Taxonomy, 2014–2018
21.4. Market Size (US$ Mn) and Volume Forecast By Market Taxonomy, 2019–2029
21.4.1. By Country
21.4.1.1. GCC Countries
21.4.1.2. Turkey
21.4.1.3. Northern Africa
21.4.1.4. South Africa
21.4.1.5. Rest of Middle East and Africa
21.4.2. By Formulations
21.4.3. By Nature
21.4.4. By Packaging Type
21.4.5. By Sales Channel
21.5. Market Attractiveness Analysis
21.5.1. By Country
21.5.2. By Formulations
21.5.3. By Nature
21.5.4. By Packaging Type
21.5.5. By Sales Channel
21.6. Market Trends
21.7. Key Market Participants - Intensity Mapping
21.8. Drivers and Restraints - Impact Analysis
22. Market Structure Analysis
22.1. Market Analysis by Tier of Companies (Cashew Milks)
22.2. Market Concentration
22.3. Market Share Analysis of Top Players
22.4. Market Presence Analysis
22.4.1. By Regional footprint of Players
22.4.2. Product foot print by Players
22.4.3. Channel Foot Print by Players
23. Competition Analysis
23.1. Competition Dashboard
23.2. Pricing Analysis by Competition
23.3. Competition Benchmarking
23.4. Competition Deep Dive
23.4.1. Danone S.A.
23.4.1.1. Overview
23.4.1.2. Product Portfolio
23.4.1.3. Profitability by Market Segments (Product/Channel/Region)
23.4.1.4. Sales Footprint
23.4.1.5. Strategy Overview
23.4.1.5.1. Marketing Strategy
23.4.1.5.2. Product Strategy
23.4.1.5.3. Channel Strategy
23.4.2. WhiteWave Services, Inc.
23.4.2.1. Overview
23.4.2.2. Product Portfolio
23.4.2.3. Profitability by Market Segments (Product/Channel/Region)
23.4.2.4. Sales Footprint
23.4.2.5. Strategy Overview
23.4.2.5.1. Marketing Strategy
23.4.2.5.2. Product Strategy
23.4.2.5.3. Channel Strategy
23.4.3. So Delicious Dairy Free
23.4.3.1. Overview
23.4.3.2. Product Portfolio
23.4.3.3. Profitability by Market Segments (Product/Channel/Region)
23.4.3.4. Sales Footprint
23.4.3.5. Strategy Overview
23.4.3.5.1. Marketing Strategy
23.4.3.5.2. Product Strategy
23.4.3.5.3. Channel Strategy
23.4.4. Vitasoy International Holdings Limited.
23.4.4.1. Overview
23.4.4.2. Product Portfolio
23.4.4.3. Profitability by Market Segments (Product/Channel/Region)
23.4.4.4. Sales Footprint
23.4.4.5. Strategy Overview
23.4.4.5.1. Marketing Strategy
23.4.4.5.2. Product Strategy
23.4.4.5.3. Channel Strategy
23.4.5. Forager Project
23.4.5.1. Overview
23.4.5.2. Product Portfolio
23.4.5.3. Profitability by Market Segments (Product/Channel/Region)
23.4.5.4. Sales Footprint
23.4.5.5. Strategy Overview
23.4.5.5.1. Marketing Strategy
23.4.5.5.2. Product Strategy
23.4.5.5.3. Channel Strategy
23.4.6. Alpro
23.4.6.1. Overview
23.4.6.2. Product Portfolio
23.4.6.3. Profitability by Market Segments (Product/Channel/Region)
23.4.6.4. Sales Footprint
23.4.6.5. Strategy Overview
23.4.6.5.1. Marketing Strategy
23.4.6.5.2. Product Strategy
23.4.6.5.3. Channel Strategy
23.4.7. Freedom Foods Group Ltd
23.4.7.1. Overview
23.4.7.2. Product Portfolio
23.4.7.3. Profitability by Market Segments (Product/Channel/Region)
23.4.7.4. Sales Footprint
23.4.7.5. Strategy Overview
23.4.7.5.1. Marketing Strategy
23.4.7.5.2. Product Strategy
23.4.7.5.3. Channel Strategy
23.4.8. Dream Blends
23.4.8.1. Overview
23.4.8.2. Product Portfolio
23.4.8.3. Profitability by Market Segments (Product/Channel/Region)
23.4.8.4. Sales Footprint
23.4.8.5. Strategy Overview
23.4.8.5.1. Marketing Strategy
23.4.8.5.2. Product Strategy
23.4.8.5.3. Channel Strategy
23.4.9. Blue Diamond Growers, Inc.
23.4.9.1. Overview
23.4.9.2. Product Portfolio
23.4.9.3. Profitability by Market Segments (Product/Channel/Region)
23.4.9.4. Sales Footprint
23.4.9.5. Strategy Overview
23.4.9.5.1. Marketing Strategy
23.4.9.5.2. Product Strategy
23.4.9.5.3. Channel Strategy
23.4.10. Other Key Players (On Additional Demand)
24. Assumptions and Acronyms Used
25. Research Methodology
TMR follows tried and tested methodology and assumptions to arrive at quantitative and qualitative analysis for particular market studies. TMR utilizes robust methodology and approach to arrive at market size and related projections. The research methodology for this report is based on 3 dimensional model. We conduct about 45-60 min duration detailed interviews with industry participants collecting the market feedback. In addition, we leverage on our existing pool of information, paid database and other valid information sources available in public domain. Usually industry interactions extend to more than 50+ interviews from market participants across the value chain.
List of Tables
Table 1: Global Cashew Milk Market Value (US$ Mn) Analysis and Forecast by Region, 2014-2018
Table 2: Global Cashew Milk Market Value (US$ Mn) Analysis and Forecast by Region, 2019-2029
Table 3: Global Cashew Milk Market Volume (MT) Analysis and Forecast by Region, 2014-2018
Table 4: Global Cashew Milk Market Volume (MT) Analysis and Forecast by Region, 2019-2029
Table 5: Global Cashew Milk Market Value (US$ Mn) Analysis and Forecast by Formulation, 2014-2018
Table 6: Global Cashew Milk Market Value (US$ Mn) Analysis and Forecast by Formulation, 2019-2029
Table 7: Global Cashew Milk Market Volume (MT) Analysis and Forecast by Formulation, 2014-2018
Table 8: Global Cashew Milk Market Volume (MT) Analysis and Forecast by Formulation, 2019-2029
Table 9: Global Cashew Milk Market Value (US$ Mn) Analysis and Forecast by Nature, 2014-2018
Table 10: Global Cashew Milk Market Value (US$ Mn) Analysis and Forecast by Nature, 2019-2029
Table 11: Global Cashew Milk Market Volume (MT) Analysis and Forecast by Nature, 2014-2018
Table 12: Global Cashew Milk Market Volume (MT) Analysis and Forecast by Nature, 2019-2029
Table 13: Global Cashew Milk Market Value (US$ Mn) Analysis and Forecast by Packaging Type, 2014-2018
Table 14: Global Cashew Milk Market Value (US$ Mn) Analysis and Forecast by Packaging Type, 2019-2029
Table 15: Global Cashew Milk Market Volume (MT) Analysis and Forecast by Packaging Type, 2014-2018
Table 16: Global Cashew Milk Market Volume (MT) Analysis and Forecast by Packaging Type, 2019-2029
Table 17: Global Cashew Milk Market Value (US$ Mn) Analysis and Forecast by Sales Channel, 2014-2018
Table 18: Global Cashew Milk Market Value (US$ Mn) Analysis and Forecast by Sales Channel, 2019-2029
Table 19: Global Cashew Milk Market Volume (MT) Analysis and Forecast by Sales Channel, 2014-2018
Table 20: Global Cashew Milk Market Volume (MT) Analysis and Forecast by Sales Channel, 2019-2029
Table 21: North America Cashew Milk Market Value (US$ Mn) Analysis and Forecast by Region, 2014-2018
Table 22: North America Cashew Milk Market Value (US$ Mn) Analysis and Forecast by Region, 2019-2029
Table 23: North America Cashew Milk Market Volume (MT) Analysis and Forecast by Region, 2014-2018
Table 24: North America Cashew Milk Market Volume (MT) Analysis and Forecast by Region, 2019-2029
Table 25: North America Cashew Milk Market Value (US$ Mn) Analysis and Forecast by Formulation, 2014-2018
Table 26: North America Cashew Milk Market Value (US$ Mn) Analysis and Forecast by Formulation, 2019-2029
Table 27: North America Cashew Milk Market Volume (MT) Analysis and Forecast by Formulation, 2014-2018
Table 28: North America Cashew Milk Market Volume (MT) Analysis and Forecast by Formulation, 2019-2029
Table 29: North America Cashew Milk Market Value (US$ Mn) Analysis and Forecast by Nature, 2014-2018
Table 30: North America Cashew Milk Market Value (US$ Mn) Analysis and Forecast by Nature, 2019-2029
Table 31: North America Cashew Milk Market Volume (MT) Analysis and Forecast by Nature, 2014-2018
Table 32: North America Cashew Milk Market Volume (MT) Analysis and Forecast by Nature, 2019-2029
Table 33: North America Cashew Milk Market Value (US$ Mn) Analysis and Forecast by Packaging Type, 2014-2018
Table 34: North America Cashew Milk Market Value (US$ Mn) Analysis and Forecast by Packaging Type, 2019-2029
Table 35: North America Cashew Milk Market Volume (MT) Analysis and Forecast by Packaging Type, 2014-2018
Table 36: North America Cashew Milk Market Volume (MT) Analysis and Forecast by Packaging Type, 2019-2029
Table 37: North America Cashew Milk Market Value (US$ Mn) Analysis and Forecast by Sales Channel, 2014-2018
Table 38: North America Cashew Milk Market Value (US$ Mn) Analysis and Forecast by Sales Channel, 2019-2029
Table 39: North America Cashew Milk Market Volume (MT) Analysis and Forecast by Sales Channel, 2014-2018
Table 40: North America Cashew Milk Market Volume (MT) Analysis and Forecast by Sales Channel, 2019-2029
Table 41: Latin America Cashew Milk Market Value (US$ Mn) Analysis and Forecast by Region, 2014-2018
Table 42: Latin America Cashew Milk Market Value (US$ Mn) Analysis and Forecast by Region, 2019-2029
Table 43: Latin America Cashew Milk Market Volume (MT) Analysis and Forecast by Region, 2014-2018
Table 44: Latin America Cashew Milk Market Volume (MT) Analysis and Forecast by Region, 2019-2029
Table 45: Latin America Cashew Milk Market Value (US$ Mn) Analysis and Forecast by Formulation, 2014-2018
Table 46: Latin America Cashew Milk Market Value (US$ Mn) Analysis and Forecast by Formulation, 2019-2029
Table 47: Latin America Cashew Milk Market Volume (MT) Analysis and Forecast by Formulation, 2014-2018
Table 48: Latin America Cashew Milk Market Volume (MT) Analysis and Forecast by Formulation, 2019-2029
Table 49: Latin America Cashew Milk Market Value (US$ Mn) Analysis and Forecast by Nature, 2014-2018
Table 50: Latin America Cashew Milk Market Value (US$ Mn) Analysis and Forecast by Nature, 2019-2029
Table 51: Latin America Cashew Milk Market Volume (MT) Analysis and Forecast by Nature, 2014-2018
Table 52: Latin America Cashew Milk Market Volume (MT) Analysis and Forecast by Nature, 2019-2029
Table 53: Latin America Cashew Milk Market Value (US$ Mn) Analysis and Forecast by Packaging Type, 2014-2018
Table 54: Latin America Cashew Milk Market Value (US$ Mn) Analysis and Forecast by Packaging Type, 2019-2029
Table 55: Latin America Cashew Milk Market Volume (MT) Analysis and Forecast by Packaging Type, 2014-2018
Table 56: Latin America Cashew Milk Market Volume (MT) Analysis and Forecast by Packaging Type, 2019-2029
Table 57: Latin America Cashew Milk Market Value (US$ Mn) Analysis and Forecast by Sales Channel, 2014-2018
Table 58: Latin America Cashew Milk Market Value (US$ Mn) Analysis and Forecast by Sales Channel, 2019-2029
Table 59: Latin America Cashew Milk Market Volume (MT) Analysis and Forecast by Sales Channel, 2014-2018
Table 60: Latin America Cashew Milk Market Volume (MT) Analysis and Forecast by Sales Channel, 2019-2029
Table 61: Europe Cashew Milk Market Value (US$ Mn) Analysis and Forecast by Region, 2014-2018
Table 62: Europe Cashew Milk Market Value (US$ Mn) Analysis and Forecast by Region, 2019-2029
Table 63: Europe Cashew Milk Market Volume (MT) Analysis and Forecast by Region, 2014-2018
Table 64: Europe Cashew Milk Market Volume (MT) Analysis and Forecast by Region, 2019-2029
Table 65: Europe Cashew Milk Market Value (US$ Mn) Analysis and Forecast by Formulation, 2014-2018
Table 66: Europe Cashew Milk Market Value (US$ Mn) Analysis and Forecast by Formulation, 2019-2029
Table 67: Europe Cashew Milk Market Volume (MT) Analysis and Forecast by Formulation, 2014-2018
Table 68: Europe Cashew Milk Market Volume (MT) Analysis and Forecast by Formulation, 2019-2029
Table 69: Europe Cashew Milk Market Value (US$ Mn) Analysis and Forecast by Nature, 2014-2018
Table 70: Europe Cashew Milk Market Value (US$ Mn) Analysis and Forecast by Nature, 2019-2029
Table 71: Europe Cashew Milk Market Volume (MT) Analysis and Forecast by Nature, 2014-2018
Table 72: Europe Cashew Milk Market Volume (MT) Analysis and Forecast by Nature, 2019-2029
Table 73: Europe Cashew Milk Market Value (US$ Mn) Analysis and Forecast by Packaging Type, 2014-2018
Table 74: Europe Cashew Milk Market Value (US$ Mn) Analysis and Forecast by Packaging Type, 2019-2029
Table 75: Europe Cashew Milk Market Volume (MT) Analysis and Forecast by Packaging Type, 2014-2018
Table 76: Europe Cashew Milk Market Volume (MT) Analysis and Forecast by Packaging Type, 2019-2029
Table 77: Europe Cashew Milk Market Value (US$ Mn) Analysis and Forecast by Sales Channel, 2014-2018
Table 78: Europe Cashew Milk Market Value (US$ Mn) Analysis and Forecast by Sales Channel, 2019-2029
Table 79: Europe Cashew Milk Market Volume (MT) Analysis and Forecast by Sales Channel, 2014-2018
Table 80: Europe Cashew Milk Market Volume (MT) Analysis and Forecast by Sales Channel, 2019-2029
Table 81: APEJ Cashew Milk Market Value (US$ Mn) Analysis and Forecast by Region, 2014-2018
Table 82: APEJ Cashew Milk Market Value (US$ Mn) Analysis and Forecast by Region, 2019-2029
Table 83: APEJ Cashew Milk Market Volume (MT) Analysis and Forecast by Region, 2014-2018
Table 84: APEJ Cashew Milk Market Volume (MT) Analysis and Forecast by Region, 2019-2029
Table 85: APEJ Cashew Milk Market Value (US$ Mn) Analysis and Forecast by Formulation, 2014-2018
Table 86: APEJ Cashew Milk Market Value (US$ Mn) Analysis and Forecast by Formulation, 2019-2029
Table 87: APEJ Cashew Milk Market Volume (MT) Analysis and Forecast by Formulation, 2014-2018
Table 88: APEJ Cashew Milk Market Volume (MT) Analysis and Forecast by Formulation, 2019-2029
Table 89: APEJ Cashew Milk Market Value (US$ Mn) Analysis and Forecast by Nature, 2014-2018
Table 90: APEJ Cashew Milk Market Value (US$ Mn) Analysis and Forecast by Nature, 2019-2029
Table 91: APEJ Cashew Milk Market Volume (MT) Analysis and Forecast by Nature, 2014-2018
Table 92: APEJ Cashew Milk Market Volume (MT) Analysis and Forecast by Nature, 2019-2029
Table 93: APEJ Cashew Milk Market Value (US$ Mn) Analysis and Forecast by Packaging Type, 2014-2018
Table 94: APEJ Cashew Milk Market Value (US$ Mn) Analysis and Forecast by Packaging Type, 2019-2029
Table 95: APEJ Cashew Milk Market Volume (MT) Analysis and Forecast by Packaging Type, 2014-2018
Table 96: APEJ Cashew Milk Market Volume (MT) Analysis and Forecast by Packaging Type, 2019-2029
Table 97: APEJ Cashew Milk Market Value (US$ Mn) Analysis and Forecast by Sales Channel, 2014-2018
Table 98: APEJ Cashew Milk Market Value (US$ Mn) Analysis and Forecast by Sales Channel, 2019-2029
Table 99: APEJ Cashew Milk Market Volume (MT) Analysis and Forecast by Sales Channel, 2014-2018
Table 100: APEJ Cashew Milk Market Volume (MT) Analysis and Forecast by Sales Channel, 2019-2029
Table 101: Japan Cashew Milk Market Value (US$ Mn) Analysis and Forecast by Region, 2014-2018
Table 102: Japan Cashew Milk Market Value (US$ Mn) Analysis and Forecast by Region, 2019-2029
Table 103: Japan Cashew Milk Market Volume (MT) Analysis and Forecast by Region, 2014-2018
Table 104: Japan Cashew Milk Market Volume (MT) Analysis and Forecast by Region, 2019-2029
Table 105: Japan Cashew Milk Market Value (US$ Mn) Analysis and Forecast by Formulation, 2014-2018
Table 106: Japan Cashew Milk Market Value (US$ Mn) Analysis and Forecast by Formulation, 2019-2029
Table 107: Japan Cashew Milk Market Volume (MT) Analysis and Forecast by Formulation, 2014-2018
Table 108: Japan Cashew Milk Market Volume (MT) Analysis and Forecast by Formulation, 2019-2029
Table 109: Japan Cashew Milk Market Value (US$ Mn) Analysis and Forecast by Nature, 2014-2018
Table 110: Japan Cashew Milk Market Value (US$ Mn) Analysis and Forecast by Nature, 2019-2029
Table 111: Japan Cashew Milk Market Volume (MT) Analysis and Forecast by Nature, 2014-2018
Table 112: Japan Cashew Milk Market Volume (MT) Analysis and Forecast by Nature, 2019-2029
Table 113: Japan Cashew Milk Market Value (US$ Mn) Analysis and Forecast by Packaging Type, 2014-2018
Table 114: Japan Cashew Milk Market Value (US$ Mn) Analysis and Forecast by Packaging Type, 2019-2029
Table 115: Japan Cashew Milk Market Volume (MT) Analysis and Forecast by Packaging Type, 2014-2018
Table 116: Japan Cashew Milk Market Volume (MT) Analysis and Forecast by Packaging Type, 2019-2029
Table 117: Japan Cashew Milk Market Value (US$ Mn) Analysis and Forecast by Sales Channel, 2014-2018
Table 118: Japan Cashew Milk Market Value (US$ Mn) Analysis and Forecast by Sales Channel, 2019-2029
Table 119: Japan Cashew Milk Market Volume (MT) Analysis and Forecast by Sales Channel, 2014-2018
Table 120: Japan Cashew Milk Market Volume (MT) Analysis and Forecast by Sales Channel, 2019-2029
Table 121: MEA Cashew Milk Market Value (US$ Mn) Analysis and Forecast by Region, 2014-2018
Table 122: MEA Cashew Milk Market Value (US$ Mn) Analysis and Forecast by Region, 2019-2029
Table 123: MEA Cashew Milk Market Volume (MT) Analysis and Forecast by Region, 2014-2018
Table 124: MEA Cashew Milk Market Volume (MT) Analysis and Forecast by Region, 2019-2029
Table 125: MEA Cashew Milk Market Value (US$ Mn) Analysis and Forecast by Formulation, 2014-2018
Table 126: MEA Cashew Milk Market Value (US$ Mn) Analysis and Forecast by Formulation, 2019-2029
Table 127: MEA Cashew Milk Market Volume (MT) Analysis and Forecast by Formulation, 2014-2018
Table 128: MEA Cashew Milk Market Volume (MT) Analysis and Forecast by Formulation, 2019-2029
Table 129: MEA Cashew Milk Market Value (US$ Mn) Analysis and Forecast by Nature, 2014-2018
Table 130: MEA Cashew Milk Market Value (US$ Mn) Analysis and Forecast by Nature, 2019-2029
Table 131: MEA Cashew Milk Market Volume (MT) Analysis and Forecast by Nature, 2014-2018
Table 132: MEA Cashew Milk Market Volume (MT) Analysis and Forecast by Nature, 2019-2029
Table 133: MEA Cashew Milk Market Value (US$ Mn) Analysis and Forecast by Packaging Type, 2014-2018
Table 134: MEA Cashew Milk Market Value (US$ Mn) Analysis and Forecast by Packaging Type, 2019-2029
Table 135: MEA Cashew Milk Market Volume (MT) Analysis and Forecast by Packaging Type, 2014-2018
Table 136: MEA Cashew Milk Market Volume (MT) Analysis and Forecast by Packaging Type, 2019-2029
Table 137: MEA Cashew Milk Market Value (US$ Mn) Analysis and Forecast by Sales Channel, 2014-2018
Table 138: MEA Cashew Milk Market Value (US$ Mn) Analysis and Forecast by Sales Channel, 2019-2029
Table 139: MEA Cashew Milk Market Volume (MT) Analysis and Forecast by Sales Channel, 2014-2018
Table 140: MEA Cashew Milk Market Volume (MT) Analysis and Forecast by Sales Channel, 2019-2029
List of Figures
Figure 1: Global Cashew Milk Market Value Share (%) and BPS Analysis by Region, 2014, 2019 & 2029
Figure 2: Global Cashew Milk Market Y-o-Y Analysis by Region, 2019 & 2029
Figure 3: Global Cashew Milk Market Attractiveness, by Region, 2019 to 2029
Figure 4: Global Cashew Milk Market Value Share (%) and BPS Analysis by Formulation, 2014, 2019 & 2029
Figure 5: Global Cashew Milk Market Y-o-Y Analysis by Formulation, 2019 & 2029
Figure 6: Global Cashew Milk Market Attractiveness, by Formulation, 2019 to 2029
Figure 7: Global Cashew Milk Market Value Share (%) and BPS Analysis by Nature, 2014, 2019 & 2029
Figure 8: Global Cashew Milk Market Y-o-Y Analysis by Nature, 2019 & 2029
Figure 9: Global Cashew Milk Market Attractiveness, by Nature, 2019 to 2029
Figure 10: Global Cashew Milk Market Value Share (%) and BPS Analysis by Packaging Type, 2014, 2019 & 2029
Figure 11: Global Cashew Milk Market Y-o-Y Analysis by Packaging Type, 2019 & 2029
Figure 12: Global Cashew Milk Market Attractiveness, by Packaging Type, 2019 to 2029
Figure 13: Global Cashew Milk Market Value Share (%) and BPS Analysis by Sales Channel, 2014, 2019 & 2029
Figure 14: Global Cashew Milk Market Y-o-Y Analysis by Sales Channel, 2019 & 2029
Figure 15: Global Cashew Milk Market Attractiveness, by Sales Channel, 2019 to 2029
Figure 16: North America Cashew Milk Market Value Share (%) and BPS Analysis by Region, 2014, 2019 & 2029
Figure 17: North America Cashew Milk Market Y-o-Y Analysis by Region, 2019 & 2029
Figure 18: North America Cashew Milk Market Attractiveness, by Region, 2019 to 2029
Figure 19: North America Cashew Milk Market Value Share (%) and BPS Analysis by Formulation, 2014, 2019 & 2029
Figure 20: North America Cashew Milk Market Y-o-Y Analysis by Formulation, 2019 & 2029
Figure 21: North America Cashew Milk Market Attractiveness, by Formulation, 2019 to 2029
Figure 22: North America Cashew Milk Market Value Share (%) and BPS Analysis by Nature, 2014, 2019 & 2029
Figure 23: North America Cashew Milk Market Y-o-Y Analysis by Nature, 2019 & 2029
Figure 24: North America Cashew Milk Market Attractiveness, by Nature, 2019 to 2029
Figure 25: North America Cashew Milk Market Value Share (%) and BPS Analysis by Packaging Type, 2014, 2019 & 2029
Figure 26: North America Cashew Milk Market Y-o-Y Analysis by Packaging Type, 2019 & 2029
Figure 27: North America Cashew Milk Market Attractiveness, by Packaging Type, 2019 to 2029
Figure 28: North America Cashew Milk Market Value Share (%) and BPS Analysis by Sales Channel, 2014, 2019 & 2029
Figure 29: North America Cashew Milk Market Y-o-Y Analysis by Sales Channel, 2019 & 2029
Figure 30: North America Cashew Milk Market Attractiveness, by Sales Channel, 2019 to 2029
Figure 31: Latin America Cashew Milk Market Value Share (%) and BPS Analysis by Region, 2014, 2019 & 2029
Figure 32: Latin America Cashew Milk Market Y-o-Y Analysis by Region, 2019 & 2029
Figure 33: Latin America Cashew Milk Market Attractiveness, by Region, 2019 to 2029
Figure 34: Latin America Cashew Milk Market Value Share (%) and BPS Analysis by Formulation, 2014, 2019 & 2029
Figure 35: Latin America Cashew Milk Market Y-o-Y Analysis by Formulation, 2019 & 2029
Figure 36: Latin America Cashew Milk Market Attractiveness, by Formulation, 2019 to 2029
Figure 37: Latin America Cashew Milk Market Value Share (%) and BPS Analysis by Nature, 2014, 2019 & 2029
Figure 38: Latin America Cashew Milk Market Y-o-Y Analysis by Nature, 2019 & 2029
Figure 39: Latin America Cashew Milk Market Attractiveness, by Nature, 2019 to 2029
Figure 40: Latin America Cashew Milk Market Value Share (%) and BPS Analysis by Packaging Type, 2014, 2019 & 2029
Figure 41: Latin America Cashew Milk Market Y-o-Y Analysis by Packaging Type, 2019 & 2029
Figure 42: Latin America Cashew Milk Market Attractiveness, by Packaging Type, 2019 to 2029
Figure 43: Latin America Cashew Milk Market Value Share (%) and BPS Analysis by Sales Channel, 2014, 2019 & 2029
Figure 44: Latin America Cashew Milk Market Y-o-Y Analysis by Sales Channel, 2019 & 2029
Figure 45: Latin America Cashew Milk Market Attractiveness, by Sales Channel, 2019 to 2029
Figure 46: Europe Cashew Milk Market Value Share (%) and BPS Analysis by Region, 2014, 2019 & 2029
Figure 47: Europe Cashew Milk Market Y-o-Y Analysis by Region, 2019 & 2029
Figure 48: Europe Cashew Milk Market Attractiveness, by Region, 2019 to 2029
Figure 49: Europe Cashew Milk Market Value Share (%) and BPS Analysis by Formulation, 2014, 2019 & 2029
Figure 50: Europe Cashew Milk Market Y-o-Y Analysis by Formulation, 2019 & 2029
Figure 51: Europe Cashew Milk Market Attractiveness, by Formulation, 2019 to 2029
Figure 52: Europe Cashew Milk Market Value Share (%) and BPS Analysis by Nature, 2014, 2019 & 2029
Figure 53: Europe Cashew Milk Market Y-o-Y Analysis by Nature, 2019 & 2029
Figure 54: Europe Cashew Milk Market Attractiveness, by Nature, 2019 to 2029
Figure 55: Europe Cashew Milk Market Value Share (%) and BPS Analysis by Packaging Type, 2014, 2019 & 2029
Figure 56: Europe Cashew Milk Market Y-o-Y Analysis by Packaging Type, 2019 & 2029
Figure 57: Europe Cashew Milk Market Attractiveness, by Packaging Type, 2019 to 2029
Figure 58: Europe Cashew Milk Market Value Share (%) and BPS Analysis by Sales Channel, 2014, 2019 & 2029
Figure 59: Europe Cashew Milk Market Y-o-Y Analysis by Sales Channel, 2019 & 2029
Figure 60: Europe Cashew Milk Market Attractiveness, by Sales Channel, 2019 to 2029
Figure 61: APEJ Cashew Milk Market Value Share (%) and BPS Analysis by Region, 2014, 2019 & 2029
Figure 62: APEJ Cashew Milk Market Y-o-Y Analysis by Region, 2019 & 2029
Figure 63: APEJ Cashew Milk Market Attractiveness, by Region, 2019 to 2029
Figure 64: APEJ Cashew Milk Market Value Share (%) and BPS Analysis by Formulation, 2014, 2019 & 2029
Figure 65: APEJ Cashew Milk Market Y-o-Y Analysis by Formulation, 2019 & 2029
Figure 66: APEJ Cashew Milk Market Attractiveness, by Formulation, 2019 to 2029
Figure 67: APEJ Cashew Milk Market Value Share (%) and BPS Analysis by Nature, 2014, 2019 & 2029
Figure 68: APEJ Cashew Milk Market Y-o-Y Analysis by Nature, 2019 & 2029
Figure 69: APEJ Cashew Milk Market Attractiveness, by Nature, 2019 to 2029
Figure 70: APEJ Cashew Milk Market Value Share (%) and BPS Analysis by Packaging Type, 2014, 2019 & 2029
Figure 71: APEJ Cashew Milk Market Y-o-Y Analysis by Packaging Type, 2019 & 2029
Figure 72: APEJ Cashew Milk Market Attractiveness, by Packaging Type, 2019 to 2029
Figure 73: APEJ Cashew Milk Market Value Share (%) and BPS Analysis by Sales Channel, 2014, 2019 & 2029
Figure 74: APEJ Cashew Milk Market Y-o-Y Analysis by Sales Channel, 2019 & 2029
Figure 75: APEJ Cashew Milk Market Attractiveness, by Sales Channel, 2019 to 2029
Figure 76: Japan Cashew Milk Market Value Share (%) and BPS Analysis by Region, 2014, 2019 & 2029
Figure 77: Japan Cashew Milk Market Y-o-Y Analysis by Region, 2019 & 2029
Figure 78: Japan Cashew Milk Market Attractiveness, by Region, 2019 to 2029
Figure 79: Japan Cashew Milk Market Value Share (%) and BPS Analysis by Formulation, 2014, 2019 & 2029
Figure 80: Japan Cashew Milk Market Y-o-Y Analysis by Formulation, 2019 & 2029
Figure 81: Japan Cashew Milk Market Attractiveness, by Formulation, 2019 to 2029
Figure 82: Japan Cashew Milk Market Value Share (%) and BPS Analysis by Nature, 2014, 2019 & 2029
Figure 83: Japan Cashew Milk Market Y-o-Y Analysis by Nature, 2019 & 2029
Figure 84: Japan Cashew Milk Market Attractiveness, by Nature, 2019 to 2029
Figure 85: Japan Cashew Milk Market Value Share (%) and BPS Analysis by Packaging Type, 2014, 2019 & 2029
Figure 86: Japan Cashew Milk Market Y-o-Y Analysis by Packaging Type, 2019 & 2029
Figure 87: Japan Cashew Milk Market Attractiveness, by Packaging Type, 2019 to 2029
Figure 88: Japan Cashew Milk Market Value Share (%) and BPS Analysis by Sales Channel, 2014, 2019 & 2029
Figure 89: Japan Cashew Milk Market Y-o-Y Analysis by Sales Channel, 2019 & 2029
Figure 90: Japan Cashew Milk Market Attractiveness, by Sales Channel, 2019 to 2029
Figure 91: MEA Cashew Milk Market Value Share (%) and BPS Analysis by Region, 2014, 2019 & 2029
Figure 92: MEA Cashew Milk Market Y-o-Y Analysis by Region, 2019 & 2029
Figure 93: MEA Cashew Milk Market Attractiveness, by Region, 2019 to 2029
Figure 94: MEA Cashew Milk Market Value Share (%) and BPS Analysis by Formulation, 2014, 2019 & 2029
Figure 95: MEA Cashew Milk Market Y-o-Y Analysis by Formulation, 2019 & 2029
Figure 96: MEA Cashew Milk Market Attractiveness, by Formulation, 2019 to 2029
Figure 97: MEA Cashew Milk Market Value Share (%) and BPS Analysis by Nature, 2014, 2019 & 2029
Figure 98: MEA Cashew Milk Market Y-o-Y Analysis by Nature, 2019 & 2029
Figure 99: MEA Cashew Milk Market Attractiveness, by Nature, 2019 to 2029
Figure 100: MEA Cashew Milk Market Value Share (%) and BPS Analysis by Packaging Type, 2014, 2019 & 2029
Figure 101: MEA Cashew Milk Market Y-o-Y Analysis by Packaging Type, 2019 & 2029
Figure 102: MEA Cashew Milk Market Attractiveness, by Packaging Type, 2019 to 2029
Figure 103: MEA Cashew Milk Market Value Share (%) and BPS Analysis by Sales Channel, 2014, 2019 & 2029
Figure 104: MEA Cashew Milk Market Y-o-Y Analysis by Sales Channel, 2019 & 2029
Figure 105: MEA Cashew Milk Market Attractiveness, by Sales Channel, 2019 to 2029
Copyright © Transparency Market Research, Inc. All Rights reserved
Trust Online

Cashew Milk Market