
Reports
Reports
Analysts’ Viewpoint on Carpets & Rugs Market Scenario
The carpets & rugs market is significantly driven by the rise in construction activities in developed and developing countries across the world. People are more inclined toward an esthetic appeal in their homes and workplaces, which is driving the global carpets & rugs market. Key suppliers are increasing their R&D spending and focusing on developing technologically upgraded carpets and rugs. Manufacturers are using advanced and sustainable materials to supply high-value products to their end-users. Increase in sale of carpets and rugs through online channels and e-commerce platforms is likely to create incremental opportunities for market players. Asia Pacific is expected to hold the highest share of the carpets & rugs market during the forecast period, due to the significant increase in construction activities in the region.
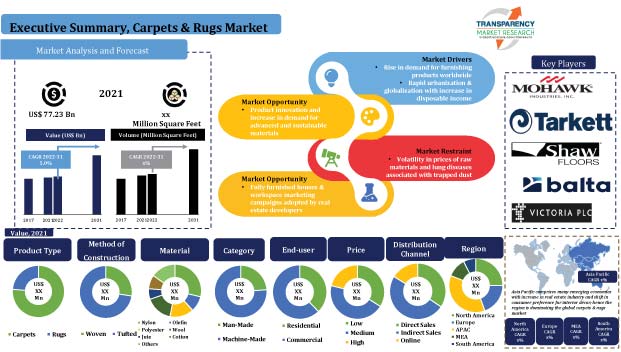
Carpets and rugs are used in residential and commercial sectors, as they protect floors by adding a layer of padding. They also add to the overall interior of a residential or workplace decor. Furthermore, carpets and rugs keep the floor from getting too cold in winters. The global carpets & rugs market is expected to grow at a decent pace during the forecast period owing to rapid urbanization, surge in construction activities, increase in disposable income of consumers, and rise in need for furnishing products in developing countries.
Demand for carpets and rugs has increased with the rise in infrastructure development and construction activities across the globe. Demand for furnishing products is also increasing in residential as well as commercial spaces for the improvement of workplaces as well as homes. According to India Brand Equity Foundation (IBEF), the real estate market in India is projected to reach a value of US$ 1 Trn by 2030, up from US$ 200 Bn in 2021, and account for 13% of the country's GDP by 2025. According to the National Association of Realtors, in the U.S., existing house sales hit a 15-year high of 6.12 million in 2021, indicating an 8.5% rise. According to the Office for National Statistics (ONS), monthly building output in the U.K. climbed by 1.1% in terms of volume in January 2022, and is currently at its highest level since September 2019.
Carpets and rugs offer functional characteristics such as slip prevention and thermal insulation. The freezing temperature makes carpets vital for residential homes in various regions. Wools of New Zealand conducted a research and discovered that carpets provide roughly 10 times more insulation than hard floor coverings. These factors are expected to drive the demand for rugs and carpets in the next few years.
Customers are increasingly inclined toward modern interiors in their homes and workplaces; thus, they tend to spend more on making esthetic improvements to their homes or offices. This is fueling the demand for carpets and rugs. Furthermore, increase in disposable income of the people, particularly in developing countries, is projected to boost the market. According to the World Bank, metropolitan regions are home to 55% of the world's population or over 4.2 billion people. This pattern is likely to continue. By 2050, roughly seven out of 10 people in the world would live in cities, with the urban population more than double the current level. Additionally, government and industry support for carpet and rug manufacturing is propelling the market. In some countries, such as Afghanistan, the carpet industry has long been a source of income for many households. Officials from Afghanistan's Carpet Manufacturers' Union aim to expand the carpet manufacturing industry from 18 to 34 provinces. Consequently, the market for carpets and rugs is projected to grow in the next few years.
In terms of product type, the global carpets & rugs market is bifurcated into carpets and rugs. The carpets segment is likely to hold a major share of the market during the forecast period. It is also expected to witness the highest growth rate during the forecast period. Global carpet manufacturers and dealers are introducing innovative products to meet the demands of customers. Higher preference for carpets can be primarily ascribed to their advantages and benefits over rugs. Carpeting is mostly fixed to the floor by glue or tacking, and cushion padding is underlain to provide a softness and cushioning effect, which makes it more preferred than rugs. Top carpet manufacturers & suppliers are targeting potential customers to increase their sales and revenue opportunities. However, demand for rugs is also expected to rise at a considerable rate during the forecast period.
In terms of material, the carpets & rugs market is segmented into nylon, olefin (polypropylene), polyester, wool, jute, cotton, and others (acrylic, trixeta, animal skins, etc.). The nylon segment is expected to grow at the fastest pace during the forecast period, as nylon is the most durable and stain-resistant carpet fiber compared to other material types. Furthermore, nylon carpets are ideal for high-traffic areas such as hallways and stairwells due to their resilience. However, the olefin (polypropylene) segment is expected to witness the highest growth rate during the forecast period, as olefin has strong stain and moisture resistance.
Asia Pacific is projected to hold the largest value share of the global carpets & rugs market during the forecast period. This can be primarily ascribed to the increase in construction activities in residential and commercial spaces; and rise in disposable income of the people in the region. China and India are among the world’s leading producers and exporters of carpets. Furthermore, Asia Pacific is home to the world’s largest textile industry. Top manufacturers in the Asia Pacific carpets & rugs market are focusing on the production of innovative products such as carpet flooring, carpet runners, handmade carpets, handmade rugs, and area rugs to gain higher revenue share. The carpets & rugs market in North America is also expected to grow at a significant pace during the forecast period, as customers in the region are more inclined toward getting higher value from interior design of their homes and workplaces.
The carpets & rugs market report concludes with the company profiles section, which includes key information about the leading players in the global carpet & rugs market. Most of the firms are spending significantly on comprehensive research and development activities, primarily to introduce innovative products. Expansion of product portfolios and mergers and acquisitions are the main strategies adopted by key players. Mohawk Industries, Inc., Milliken & Company, Tarkett Group, Shaw Industries Group, Inc., The Dixie Group, Inc., Balta Industries NV, Mannington Mills, Inc., Tai Ping Carpets International Ltd, Marquis Industries, Inc., and Victoria PLC are the prominent entities operating in this market.
Each of these players has been profiled in the carpets & rugs market report based on parameters such as company overview, financial overview, business strategies, product portfolio, business segments, and recent developments.
| Attribute | Detail |
|---|---|
| Market Size Value in 2021 | US$ 77.23 Bn |
| Market Forecast Value in 2031 | US$ 123.73 Bn |
| Growth Rate (CAGR) | 5.0% |
| Forecast Period | 2022-2031 |
| Historical Data Available for | 2017-2020 |
| Quantitative Units | US$ Bn for Value & Million Square Feet for Volume |
| Market Analysis | It includes cross segment analysis at global as well as regional level. Furthermore, qualitative analysis includes drivers, restraints, opportunities, key trends, Porter’s Five Forces analysis, value chain analysis, and key trend analysis. |
| Competition Landscape |
|
| Format | Electronic (PDF) + Excel |
| Market Segmentation |
|
| Regions Covered |
|
| Countries Covered |
|
| Companies Profiled |
|
| Customization Scope | Available upon request |
| Pricing | Available upon request |
The market stood at US$ 77.23 Bn in 2021
The market is estimated to grow at a CAGR of 5.0% during 2022-2031
Increase in demand for furnishing products is likely to drive the market
Carpets accounted for more than 50% share of the market in 2021
Asia Pacific is likely to be the most lucrative market during the forecast period
Mohawk Industries, Inc., Milliken & Company, Tarkett Group, Shaw Industries Group, Inc., The Dixie Group, Inc., Balta Industries NV, Mannington Mills, Inc., Tai Ping Carpets International Ltd, Marquis Industries, Inc., and Victoria PLC
1. Preface
1.1. Market Definition and Scope
1.2. Market Segmentation
1.3. Key Research Objectives
1.4. Research Highlights
2. Assumptions
3. Research Methodology
4. Executive Summary
5. Market Overview
5.1. Introduction
5.2. Market Dynamics
5.2.1. Drivers
5.2.2. Restraints
5.2.3. Opportunities
5.3. Key Trends Analysis
5.3.1. Demand Side Analysis
5.3.2. Supply Side Analysis
5.4. Key Market Indicators
5.4.1. Overall Home Furnishings Market Overview
5.5. Porter’s Five Forces Analysis
5.6. Value Chain Analysis
5.7. Industry SWOT Analysis
5.8. Raw Material Analysis
5.9. COVID-19 Impact Analysis
5.10. Global Carpets & Rugs Market Analysis and Forecast, 2017-2031
5.10.1. Market Value Projections (US$ Mn)
5.10.2. Market Volume Projections (Million Square Feet)
6. Global Carpets & Rugs Market Analysis and Forecast, By Type
6.1. Global Carpets & Rugs Market Size (US$ Mn and Million Square Feet) Forecast, By Type, 2017-2031
6.1.1. Carpets
6.1.2. Rugs
6.2. Incremental Opportunity, By Type
7. Global Carpets & Rugs Market Analysis and Forecast, By Method of Construction
7.1. Global Carpets & Rugs Market Size (US$ Mn and Mn Square Feet) Forecast, By Method of Construction, 2017-2031
7.1.1. Woven
7.1.2. Tufted
7.1.2.1. Loop Pile
7.1.2.2. Cut Pile
7.2. Incremental Opportunity, By Method of Construction
8. Global Carpets & Rugs Market Analysis and Forecast, By Material
8.1. Global Carpets & Rugs Market Size (US$ Mn and Million Square Feet) Forecast, By Material, 2017-2031
8.1.1. Nylon
8.1.2. Olefin (polypropylene)
8.1.3. Polyester
8.1.4. Wool
8.1.5. Jute
8.1.6. Cotton
8.1.7. Others
8.2. Incremental Opportunity, By Material
9. Global Carpets & Rugs Market Analysis and Forecast, By Category
9.1. Global Carpets & Rugs Market Size (US$ Mn and Million Square Feet) Forecast, By Category, 2017-2031
9.1.1. Man Made
9.1.2. Machine Made
9.2. Incremental Opportunity, By Category
10. Global Carpets & Rugs Market Analysis and Forecast, By End-user
10.1. Global Carpets & Rugs Market Size (US$ Mn and Million Square Feet) Forecast, By End-user, 2017-2031
10.1.1. Residential
10.1.2. Commercial
10.2. Incremental Opportunity, By End-user
11. Global Carpets & Rugs Market Analysis and Forecast, By Price
11.1. Global Carpets & Rugs Market Size (US$ Mn and Million Square Feet) Forecast, By Price, 2017-2031
11.1.1. Low
11.1.2. Medium
11.1.3. High
11.2. Incremental Opportunity, By Price
12. Global Carpets & Rugs Market Analysis and Forecast, By Distribution Channel
12.1. Global Carpets & Rugs Market Size (US$ Mn and Million Square Feet) Forecast, By Distribution Channel, 2017-2031
12.1.1. Direct Sales
12.1.2. Indirect Sales
12.1.2.1. Hypermarket/Supermarket
12.1.2.2. Brand/Multi-brand Stores
12.1.2.3. Others
12.1.3. Online
12.1.3.1. E-Commerce Websites
12.1.3.2. Company- Owned Websites
12.2. Incremental Opportunity, By Distribution Channel
13. Global Carpets & Rugs Market Analysis and Forecast, By Region
13.1. Global Carpets & Rugs Market Size (US$ Mn and Million Square Feet) Forecast, By Region, 2017-2031
13.1.1. North America
13.1.2. Europe
13.1.3. Asia Pacific
13.1.4. Middle East & Africa
13.1.5. South America
13.2. Incremental Opportunity, By Region
14. North America Carpets & Rugs Market Analysis and Forecast
14.1. Regional Snapshot
14.2. Demographic Overview
14.3. Key Trend Analysis
14.3.1. Demand Side
14.3.2. Supply Side
14.4. Price Trend Analysis
14.4.1. Weighted Average Selling Price (US$)
14.5. Brand Analysis
14.6. Consumer Buying Behavior Analysis
14.7. Carpets & Rugs Market Size (US$ Mn and Million Square Feet) Forecast, By Type, 2017-2031
14.7.1. Carpets
14.7.2. Rugs
14.8. Carpets & Rugs Market Size (US$ Mn and Million Square Feet) Forecast, By Method of Construction, 2017-2031
14.8.1. Woven
14.8.2. Tufted
14.8.2.1. Loop Pile
14.8.2.2. Cut Pile
14.9. Carpets & Rugs Market Size (US$ Mn and Million Square Feet) Forecast, By Material, 2017-2031
14.9.1. Nylon
14.9.2. Olefin (polypropylene)
14.9.3. Polyester
14.9.4. Wool
14.9.5. Jute
14.9.6. Cotton
14.9.7. Others
14.10. Carpets & Rugs Market Size (US$ Mn and Million Square Feet) Forecast, By Category, 2017-2031
14.10.1. Man Made
14.10.2. Machine Made
14.11. Carpets & Rugs Market Size (US$ Mn and Million Square Feet) Forecast, By End-user, 2017-2031
14.11.1. Residential
14.11.2. Commercial
14.12. Carpets & Rugs Market Size (US$ Mn and Million Square Feet) Forecast, By Price, 2017-2031
14.12.1. Low
14.12.2. Medium
14.12.3. High
14.13. Carpets & Rugs Market Size (US$ Mn and Million Square Feet) Forecast, By Distribution Channel, 2017-2031
14.13.1. Direct Sales
14.13.2. Indirect Sales
14.13.2.1. Hypermarket/Supermarket
14.13.2.2. Brand/Multi-brand Stores
14.13.2.3. Others
14.13.3. Online
14.13.3.1. E-Commerce Websites
14.13.3.2. Company- Owned Websites
14.14. Carpets & Rugs Market Size (US$ Mn and Million Square Feet) Forecast, By Country & Sub-region, 2017-2031
14.14.1. The U.S.
14.14.2. Canada
14.14.3. Rest of North America
14.15. Incremental Opportunity Analysis
15. Europe Carpets & Rugs Market Analysis and Forecast
15.1. Regional Snapshot
15.2. Demographic Overview
15.3. Key Trend Analysis
15.3.1. Demand Side
15.3.2. Supply Side
15.4. Price Trend Analysis
15.4.1. Weighted Average Selling Price (US$)
15.5. Brand Analysis
15.6. Consumer Buying Behavior Analysis
15.7. Carpets & Rugs Market Size (US$ Mn and Million Square Feet) Forecast, By Type, 2017-2031
15.7.1. Carpets
15.7.2. Rugs
15.8. Carpets & Rugs Market Size (US$ Mn and Million Square Feet) Forecast, By Method of Construction, 2017-2031
15.8.1. Woven
15.8.2. Tufted
15.8.2.1. Loop Pile
15.8.2.2. Cut Pile
15.9. Carpets & Rugs Market Size (US$ Mn and Million Square Feet) Forecast, By Material, 2017-2031
15.9.1. Nylon
15.9.2. Olefin (polypropylene)
15.9.3. Polyester
15.9.4. Wool
15.9.5. Jute
15.9.6. Cotton
15.9.7. Others
15.10. Carpets & Rugs Market Size (US$ Mn and Million Square Feet) Forecast, By Category, 2017-2031
15.10.1. Man Made
15.10.2. Machine Made
15.11. Carpets & Rugs Market Size (US$ Mn and Million Square Feet) Forecast, By End-user, 2017-2031
15.11.1. Residential
15.11.2. Commercial
15.12. Carpets & Rugs Market Size (US$ Mn and Million Square Feet) Forecast, By Price, 2017-2031
15.12.1. Low
15.12.2. Medium
15.12.3. High
15.13. Carpets & Rugs Market Size (US$ Mn and Million Square Feet) Forecast, By Distribution Channel, 2017-2031
15.13.1. Direct Sales
15.13.2. Indirect Sales
15.13.2.1. Hypermarket/Supermarket
15.13.2.2. Brand/Multi-brand Stores
15.13.2.3. Others
15.13.3. Online
15.13.3.1. E-Commerce Websites
15.13.3.2. Company- Owned Websites
15.14. Carpets & Rugs Market Size (US$ Mn and Million Square Feet) Forecast, By Country & Sub-region, 2017-2031
15.14.1. U.K.
15.14.2. Germany
15.14.3. France
15.14.4. Rest of Europe
15.15. Incremental Opportunity Analysis
16. Asia Pacific Carpets & Rugs Market Analysis and Forecast
16.1. Regional Snapshot
16.2. Demographic Overview
16.3. Key Trend Analysis
16.3.1. Demand Side
16.3.2. Supply Side
16.4. Price Trend Analysis
16.4.1. Weighted Average Selling Price (US$)
16.5. Brand Analysis
16.6. Consumer Buying Behavior Analysis
16.7. Carpets & Rugs Market Size (US$ Mn and Million Square Feet) Forecast, By Type, 2017-2031
16.7.1. Carpets
16.7.2. Rugs
16.8. Carpets & Rugs Market Size (US$ Mn and Million Square Feet) Forecast, By Method of Construction, 2017-2031
16.8.1. Woven
16.8.2. Tufted
16.8.2.1. Loop Pile
16.8.2.2. Cut Pile
16.9. Carpets & Rugs Market Size (US$ Mn and Million Square Feet) Forecast, By Material, 2017-2031
16.9.1. Nylon
16.9.2. Olefin (polypropylene)
16.9.3. Polyester
16.9.4. Wool
16.9.5. Jute
16.9.6. Cotton
16.9.7. Others
16.10. Carpets & Rugs Market Size (US$ Mn and Million Square Feet) Forecast, By Category, 2017-2031
16.10.1. Man Made
16.10.2. Machine Made
16.11. Carpets & Rugs Market Size (US$ Mn and Million Square Feet) Forecast, By End-user, 2017-2031
16.11.1. Residential
16.11.2. Commercial
16.12. Carpets & Rugs Market Size (US$ Mn and Million Square Feet) Forecast, By Price, 2017-2031
16.12.1. Low
16.12.2. Medium
16.12.3. High
16.13. Carpets & Rugs Market Size (US$ Mn and Million Square Feet) Forecast, By Distribution Channel, 2017-2031
16.13.1. Direct Sales
16.13.2. Indirect Sales
16.13.2.1. Hypermarket/Supermarket
16.13.2.2. Brand/Multi-brand Stores
16.13.2.3. Others
16.13.3. Online
16.13.3.1. E-Commerce Websites
16.13.3.2. Company- Owned Websites
16.14. Carpets & Rugs Market Size (US$ Mn and Million Square Feet) Forecast, By Country & Sub-region, 2017-2031
16.14.1. China
16.14.2. India
16.14.3. Japan
16.14.4. Rest of Asia Pacific
16.15. Incremental Opportunity Analysis
17. Middle East & Africa Carpets & Rugs Market Analysis and Forecast
17.1. Regional Snapshot
17.2. Demographic Overview
17.3. Key Trend Analysis
17.3.1. Demand Side
17.3.2. Supply Side
17.4. Price Trend Analysis
17.4.1. Weighted Average Selling Price (US$)
17.5. Brand Analysis
17.6. Consumer Buying Behavior Analysis
17.7. Carpets & Rugs Market Size (US$ Mn and Million Square Feet) Forecast, By Type, 2017-2031
17.7.1. Carpets
17.7.2. Rugs
17.8. Carpets & Rugs Market Size (US$ Mn and Million Square Feet) Forecast, By Method of Construction, 2017-2031
17.8.1. Woven
17.8.2. Tufted
17.8.2.1. Loop Pile
17.8.2.2. Cut Pile
17.9. Carpets & Rugs Market Size (US$ Mn and Million Square Feet) Forecast, By Material, 2017-2031
17.9.1. Nylon
17.9.2. Olefin (polypropylene)
17.9.3. Polyester
17.9.4. Wool
17.9.5. Jute
17.9.6. Cotton
17.9.7. Others
17.10. Carpets & Rugs Market Size (US$ Mn and Million Square Feet) Forecast, By Category, 2017-2031
17.10.1. Man Made
17.10.2. Machine Made
17.11. Carpets & Rugs Market Size (US$ Mn and Million Square Feet) Forecast, By End-user, 2017-2031
17.11.1. Residential
17.11.2. Commercial
17.12. Carpets & Rugs Market Size (US$ Mn and Million Square Feet) Forecast, By Price, 2017-2031
17.12.1. Low
17.12.2. Medium
17.12.3. High
17.13. Carpets & Rugs Market Size (US$ Mn and Million Square Feet) Forecast, By Distribution Channel, 2017-2031
17.13.1. Direct Sales
17.13.2. Indirect Sales
17.13.2.1. Hypermarket/Supermarket
17.13.2.2. Brand/Multi-brand Stores
17.13.2.3. Others
17.13.3. Online
17.13.3.1. E-Commerce Websites
17.13.3.2. Company- Owned Websites
17.14. Carpets & Rugs Market Size (US$ Mn and Million Square Feet) Forecast, By Country & Sub-region, 2017-2031
17.14.1. GCC
17.14.2. South Africa
17.14.3. Rest of Middle East & Africa
17.15. Incremental Opportunity Analysis
18. South America Carpets & Rugs Market Analysis and Forecast
18.1. Regional Snapshot
18.2. Demographic Overview
18.3. Key Trend Analysis
18.3.1. Demand Side
18.3.2. Supply Side
18.4. Price Trend Analysis
18.4.1. Weighted Average Selling Price (US$)
18.5. Brand Analysis
18.6. Consumer Buying Behavior Analysis
18.7. Carpets & Rugs Market Size (US$ Mn and Million Square Feet) Forecast, By Type, 2017-2031
18.7.1. Carpets
18.7.2. Rugs
18.8. Carpets & Rugs Market Size (US$ Mn and Million Square Feet) Forecast, By Method of Construction, 2017-2031
18.8.1. Woven
18.8.2. Tufted
18.8.2.1. Loop Pile
18.8.2.2. Cut Pile
18.9. Carpets & Rugs Market Size (US$ Mn and Million Square Feet) Forecast, By Material, 2017-2031
18.9.1. Nylon
18.9.2. Olefin (polypropylene)
18.9.3. Polyester
18.9.4. Wool
18.9.5. Jute
18.9.6. Cotton
18.9.7. Others
18.10. Carpets & Rugs Market Size (US$ Mn and Million Square Feet) Forecast, By Category, 2017-2031
18.10.1. Man Made
18.10.2. Machine Made
18.11. Carpets & Rugs Market Size (US$ Mn and Million Square Feet) Forecast, By End-user, 2017-2031
18.11.1. Residential
18.11.2. Commercial
18.12. Carpets & Rugs Market Size (US$ Mn and Million Square Feet) Forecast, By Price, 2017-2031
18.12.1. Low
18.12.2. Medium
18.12.3. High
18.13. Carpets & Rugs Market Size (US$ Mn and Million Square Feet) Forecast, By Distribution Channel, 2017-2031
18.13.1. Direct Sales
18.13.2. Indirect Sales
18.13.2.1. Hypermarket/Supermarket
18.13.2.2. Brand/Multi-brand Stores
18.13.2.3. Others
18.13.3. Online
18.13.3.1. E-Commerce Websites
18.13.3.2. Company- Owned Websites
18.14. Carpets & Rugs Market Size (US$ Mn and Million Square Feet) Forecast, By Country & Sub-region, 2017-2031
18.14.1. Brazil
18.14.2. Rest of South America
18.15. Incremental Opportunity Analysis
19. Competition Landscape
19.1. Market Player - Competition Dashboard
19.2. Market Share Analysis-2021 (%)
19.3. Company Profiles (Details - Company Overview, Sales Area/Geographical Presence, Financial/Revenue (Segmental Revenue), Strategy & Business Overview, Sales Channel Analysis, Product Portfolio & Pricing)
19.3.1. Balta industries NV.
19.3.1.1. Company Overview
19.3.1.2. Sales Area/Geographical Presence
19.3.1.3. Financial/Revenue (Segmental Revenue)
19.3.1.4. Strategy & Business Overview
19.3.1.5. Sales Channel Analysis
19.3.1.6. Product Portfolio & Pricing
19.3.2. Mannington mills, Inc.
19.3.2.1. Company Overview
19.3.2.2. Sales Area/Geographical Presence
19.3.2.3. Financial/Revenue (Segmental Revenue)
19.3.2.4. Strategy & Business Overview
19.3.2.5. Sales Channel Analysis
19.3.2.6. Product Portfolio & Pricing
19.3.3. Marquis industries, Inc.
19.3.3.1. Company Overview
19.3.3.2. Sales Area/Geographical Presence
19.3.3.3. Financial/Revenue (Segmental Revenue)
19.3.3.4. Strategy & Business Overview
19.3.3.5. Sales Channel Analysis
19.3.3.6. Product Portfolio & Pricing
19.3.4. Milliken & company.
19.3.4.1. Company Overview
19.3.4.2. Sales Area/Geographical Presence
19.3.4.3. Financial/Revenue (Segmental Revenue)
19.3.4.4. Strategy & Business Overview
19.3.4.5. Sales Channel Analysis
19.3.4.6. Product Portfolio & Pricing
19.3.5. Mohawk industries, Inc.
19.3.5.1. Company Overview
19.3.5.2. Sales Area/Geographical Presence
19.3.5.3. Financial/Revenue (Segmental Revenue)
19.3.5.4. Strategy & Business Overview
19.3.5.5. Sales Channel Analysis
19.3.5.6. Product Portfolio & Pricing
19.3.6. Shaw industries group, Inc.
19.3.6.1. Company Overview
19.3.6.2. Sales Area/Geographical Presence
19.3.6.3. Financial/Revenue (Segmental Revenue)
19.3.6.4. Strategy & Business Overview
19.3.6.5. Sales Channel Analysis
19.3.6.6. Product Portfolio & Pricing
19.3.7. Tai Ping Carpets International Limited
19.3.7.1. Company Overview
19.3.7.2. Sales Area/Geographical Presence
19.3.7.3. Financial/Revenue (Segmental Revenue)
19.3.7.4. Strategy & Business Overview
19.3.7.5. Sales Channel Analysis
19.3.7.6. Product Portfolio & Pricing
19.3.8. Tarkett SA
19.3.8.1. Company Overview
19.3.8.2. Sales Area/Geographical Presence
19.3.8.3. Financial/Revenue (Segmental Revenue)
19.3.8.4. Strategy & Business Overview
19.3.8.5. Sales Channel Analysis
19.3.8.6. Product Portfolio & Pricing
19.3.9. The Dixie Group Inc.
19.3.9.1. Company Overview
19.3.9.2. Sales Area/Geographical Presence
19.3.9.3. Financial/Revenue (Segmental Revenue)
19.3.9.4. Strategy & Business Overview
19.3.9.5. Sales Channel Analysis
19.3.9.6. Product Portfolio & Pricing
19.3.10. Victoria PLC
19.3.10.1. Company Overview
19.3.10.2. Sales Area/Geographical Presence
19.3.10.3. Financial/Revenue (Segmental Revenue)
19.3.10.4. Strategy & Business Overview
19.3.10.5. Sales Channel Analysis
19.3.10.6. Product Portfolio & Pricing
20. Key Takeaways
20.1. Identification of Potential Market Spaces
20.1.1. Type
20.1.2. Method of Construction
20.1.3. Material
20.1.4. Category
20.1.5. End-user
20.1.6. Price
20.1.7. Distribution Channel
20.1.8. Region
20.2. Understanding the Buying Process of Customers
20.3. Prevailing Market Risks
20.4. Preferred Sales & Marketing Strategy
List of Tables
Table 1: Global Carpets & Rugs Market, by Product Type, Million Square Feet, 2017-2031
Table 2: Global Carpets & Rugs Market, by Product Type, US$ Mn, 2017-2031
Table 3: Global Carpets & Rugs Market, Method of Construction, Million Square Feet, 2017-2031
Table 4: Global Carpets & Rugs Market, Method of Construction, US$ Mn, 2017-2031
Table 5: Global Carpets & Rugs Market, Category, Million Square Feet, 2017-2031
Table 6: Global Carpets & Rugs Market, Category, US$ Mn, 2017-2031
Table 7: Global Carpets & Rugs Market, Material, Million Square Feet, 2017-2031
Table 8: Global Carpets & Rugs Market, Material, US$ Mn, 2017-2031
Table 9: Global Carpets & Rugs Market, Price, Million Square Feet, 2017-2031
Table 10: Global Carpets & Rugs Market, Price, US$ Mn, 2017-2031
Table 11: Global Carpets & Rugs Market, End User, Million Square Feet, 2017-2031
Table 12: Global Carpets & Rugs Market, End User, US$ Mn, 2017-2031
Table 13: Global Carpets & Rugs Market, Distribution Channel, Million Square Feet, 2017-2031
Table 14: Global Carpets & Rugs Market, Distribution Channel, US$ Mn, 2017-2031
Table 15: Global Carpets & Rugs Market, Region, Million Square Feet, 2017-2031
Table 16: Global Carpets & Rugs Market, Region, US$ Mn, 2017-2031
Table 17: North America Carpets & Rugs Market, by Product Type, Million Square Feet, 2017-2031
Table 18: North America Carpets & Rugs Market, by Product Type, US$ Mn, 2017-2031
Table 19: North America Carpets & Rugs Market, Method of Construction, Million Square Feet, 2017-2031
Table 20: North America Carpets & Rugs Market, Method of Construction, US$ Mn, 2017-2031
Table 21: North America Carpets & Rugs Market, Category, Million Square Feet, 2017-2031
Table 22: North America Carpets & Rugs Market, Category, US$ Mn, 2017-2031
Table 23: North America Carpets & Rugs Market, Material, Million Square Feet, 2017-2031
Table 24: North America Carpets & Rugs Market, Material, US$ Mn, 2017-2031
Table 25: North America Carpets & Rugs Market, Price, Million Square Feet, 2017-2031
Table 26: North America Carpets & Rugs Market, Price, US$ Mn, 2017-2031
Table 27: North America Carpets & Rugs Market, End User, Million Square Feet, 2017-2031
Table 28: North America Carpets & Rugs Market, End User, US$ Mn, 2017-2031
Table 29: North America Carpets & Rugs Market, Distribution Channel, Million Square Feet, 2017-2031
Table 30: North America Carpets & Rugs Market, Distribution Channel, US$ Mn, 2017-2031
Table 31: North America Carpets & Rugs Market, Country, Million Square Feet, 2017-2031
Table 32: North America Carpets & Rugs Market, Country, US$ Mn, 2017-2031
Table 33: Europe Carpets & Rugs Market, by Product Type, Million Square Feet, 2017-2031
Table 34: Europe Carpets & Rugs Market, by Product Type, US$ Mn, 2017-2031
Table 35: Europe Carpets & Rugs Market, Method of Construction, Million Square Feet, 2017-2031
Table 36: Europe Carpets & Rugs Market, Method of Construction, US$ Mn, 2017-2031
Table 37: Europe Carpets & Rugs Market, Category, Million Square Feet, 2017-2031
Table 38: Europe Carpets & Rugs Market, Category, US$ Mn, 2017-2031
Table 39: Europe Carpets & Rugs Market, Material, Million Square Feet, 2017-2031
Table 40: Europe Carpets & Rugs Market, Material, US$ Mn, 2017-2031
Table 41: Europe Carpets & Rugs Market, Price, Million Square Feet, 2017-2031
Table 42: Europe Carpets & Rugs Market, Price, US$ Mn, 2017-2031
Table 43: Europe Carpets & Rugs Market, End User, Million Square Feet, 2017-2031
Table 44: Europe Carpets & Rugs Market, End User, US$ Mn, 2017-2031
Table 45: Europe Carpets & Rugs Market, Distribution Channel, Million Square Feet, 2017-2031
Table 46: Europe Carpets & Rugs Market, Distribution Channel, US$ Mn, 2017-2031
Table 47: Europe Carpets & Rugs Market, Country, Million Square Feet, 2017-2031
Table 48: Europe Carpets & Rugs Market, Country, US$ Mn, 2017-2031
Table 49: Asia Pacific Carpets & Rugs Market, by Product Type, Million Square Feet, 2017-2031
Table 50: Asia Pacific Carpets & Rugs Market, by Product Type, US$ Mn, 2017-2031
Table 51: Asia Pacific Carpets & Rugs Market, Method of Construction, Million Square Feet, 2017-2031
Table 52: Asia Pacific Carpets & Rugs Market, Method of Construction, US$ Mn, 2017-2031
Table 53: Asia Pacific Carpets & Rugs Market, Category, Million Square Feet, 2017-2031
Table 54: Asia Pacific Carpets & Rugs Market, Category, US$ Mn, 2017-2031
Table 55: Asia Pacific Carpets & Rugs Market, Material, Million Square Feet, 2017-2031
Table 56: Asia Pacific Carpets & Rugs Market, Material, US$ Mn, 2017-2031
Table 57: Asia Pacific Carpets & Rugs Market, Price, Million Square Feet, 2017-2031
Table 58: Asia Pacific Carpets & Rugs Market, Price, US$ Mn, 2017-2031
Table 59: Asia Pacific Carpets & Rugs Market, End User, Million Square Feet, 2017-2031
Table 60: Asia Pacific Carpets & Rugs Market, End User, US$ Mn, 2017-2031
Table 61: Asia Pacific Carpets & Rugs Market, Distribution Channel, Million Square Feet, 2017-2031
Table 62: Asia Pacific Carpets & Rugs Market, Distribution Channel, US$ Mn, 2017-2031
Table 63: Asia Pacific Carpets & Rugs Market, Country, Million Square Feet, 2017-2031
Table 64: Asia Pacific Carpets & Rugs Market, Country, US$ Mn, 2017-2031
Table 65: Middle East & Africa Carpets & Rugs Market, by Product Type, Million Square Feet, 2017-2031
Table 66: Middle East & Africa Carpets & Rugs Market, by Product Type, US$ Mn, 2017-2031
Table 67: Middle East & Africa Carpets & Rugs Market, Method of Construction, Million Square Feet, 2017-2031
Table 68: Middle East & Africa Carpets & Rugs Market, Method of Construction, US$ Mn, 2017-2031
Table 69: Middle East & Africa Carpets & Rugs Market, Category, Million Square Feet, 2017-2031
Table 70: Middle East & Africa Carpets & Rugs Market, Category, US$ Mn, 2017-2031
Table 71: Middle East & Africa Carpets & Rugs Market, Material, Million Square Feet, 2017-2031
Table 72: Middle East & Africa Carpets & Rugs Market, Material, US$ Mn, 2017-2031
Table 73: Middle East & Africa Carpets & Rugs Market, Price, Million Square Feet, 2017-2031
Table 74: Middle East & Africa Carpets & Rugs Market, Price, US$ Mn, 2017-2031
Table 75: Middle East & Africa Carpets & Rugs Market, End User, Million Square Feet, 2017-2031
Table 76: Middle East & Africa Carpets & Rugs Market, End User, US$ Mn, 2017-2031
Table 77: Middle East & Africa Carpets & Rugs Market, Distribution Channel, Million Square Feet, 2017-2031
Table 78: Middle East & Africa Carpets & Rugs Market, Distribution Channel, US$ Mn, 2017-2031
Table 79: Middle East & Africa Carpets & Rugs Market, Country, Million Square Feet, 2017-2031
Table 80: Middle East & Africa Carpets & Rugs Market, Country, US$ Mn, 2017-2031
Table 81: South America Carpets & Rugs Market, by Product Type, Million Square Feet, 2017-2031
Table 82: South America Carpets & Rugs Market, by Product Type, US$ Mn, 2017-2031
Table 83: South America Carpets & Rugs Market, Method of Construction, Million Square Feet, 2017-2031
Table 84: South America Carpets & Rugs Market, Method of Construction, US$ Mn, 2017-2031
Table 85: South America Carpets & Rugs Market, Category, Million Square Feet, 2017-2031
Table 86: South America Carpets & Rugs Market, Category, US$ Mn, 2017-2031
Table 87: South America Carpets & Rugs Market, Material, Million Square Feet, 2017-2031
Table 88: South America Carpets & Rugs Market, Material, US$ Mn, 2017-2031
Table 89: South America Carpets & Rugs Market, Price, Million Square Feet, 2017-2031
Table 90: South America Carpets & Rugs Market, Price, US$ Mn, 2017-2031
Table 91: South America Carpets & Rugs Market, End User, Million Square Feet, 2017-2031
Table 92: South America Carpets & Rugs Market, End User, US$ Mn, 2017-2031
Table 93: South America Carpets & Rugs Market, Distribution Channel, Million Square Feet, 2017-2031
Table 94: South America Carpets & Rugs Market, Distribution Channel, US$ Mn, 2017-2031
Table 95: South America Carpets & Rugs Market, Country, Million Square Feet, 2017-2031
Table 96: South America Carpets & Rugs Market, Country, US$ Mn, 2017-2031
List of Figures
Figure 1: Global Carpets & Rugs Market, by Product Type, Million Square Feet, 2017-2031
Figure 2: Global Carpets & Rugs Market, by Product Type, US$ Mn, 2017-2031
Figure 3: Global Carpets & Rugs Market, by Product Type, Incremental Opportunity, 2017-2031
Figure 4: Global Carpets & Rugs Market, Method of Construction, Million Square Feet, 2017-2031
Figure 5: Global Carpets & Rugs Market, Method of Construction, US$ Mn, 2017-2031
Figure 6: Global Carpets & Rugs Market, Method of Construction, Incremental Opportunity, 2017-2031
Figure 7: Global Carpets & Rugs Market, Category, Million Square Feet, 2017-2031
Figure 8: Global Carpets & Rugs Market, Category, US$ Mn, 2017-2031
Figure 9: Global Carpets & Rugs Market, Category, Incremental Opportunity, 2017-2031
Figure 10: Global Carpets & Rugs Market, Material, Million Square Feet, 2017-2031
Figure 11: Global Carpets & Rugs Market, Material, US$ Mn, 2017-2031
Figure 12: Global Carpets & Rugs Market, Material, Incremental Opportunity, 2017-2031
Figure 13: Global Carpets & Rugs Market, Price, Million Square Feet, 2017-2031
Figure 14: Global Carpets & Rugs Market, Price, US$ Mn, 2017-2031
Figure 15: Global Carpets & Rugs Market, Price, Incremental Opportunity, 2017-2031
Figure 16: Global Carpets & Rugs Market, End User, Million Square Feet, 2017-2031
Figure 17: Global Carpets & Rugs Market, End User, US$ Mn, 2017-2031
Figure 18: Global Carpets & Rugs Market, End User, Incremental Opportunity, 2017-2031
Figure 19: Global Carpets & Rugs Market, Distribution Channel, Million Square Feet, 2017-2031
Figure 20: Global Carpets & Rugs Market, Distribution Channel, US$ Mn, 2017-2031
Figure 21: Global Carpets & Rugs Market, Distribution Channel, Incremental Opportunity, 2017-2031
Figure 22: Global Carpets & Rugs Market, Region, Million Square Feet, 2017-2031
Figure 23: Global Carpets & Rugs Market, Region, US$ Mn, 2017-2031
Figure 24: Global Carpets & Rugs Market, Region, Incremental Opportunity, 2017-2031
Figure 25: North America Carpets & Rugs Market, by Product Type, Million Square Feet, 2017-2031
Figure 26: North America Carpets & Rugs Market, by Product Type, US$ Mn, 2017-2031
Figure 27: North America Carpets & Rugs Market, by Product Type, Incremental Opportunity, 2017-2031
Figure 28: North America Carpets & Rugs Market, Method of Construction, Million Square Feet, 2017-2031
Figure 29: North America Carpets & Rugs Market, Method of Construction, US$ Mn, 2017-2031
Figure 30: North America Carpets & Rugs Market, Method of Construction, Incremental Opportunity, 2017-2031
Figure 31: North America Carpets & Rugs Market, Category, Million Square Feet, 2017-2031
Figure 32: North America Carpets & Rugs Market, Category, US$ Mn, 2017-2031
Figure 33: North America Carpets & Rugs Market, Category, Incremental Opportunity, 2017-2031
Figure 34: North America Carpets & Rugs Market, Material, Million Square Feet, 2017-2031
Figure 35: North America Carpets & Rugs Market, Material, US$ Mn, 2017-2031
Figure 36: North America Carpets & Rugs Market, Material, Incremental Opportunity, 2017-2031
Figure 37: North America Carpets & Rugs Market, Price, Million Square Feet, 2017-2031
Figure 38: North America Carpets & Rugs Market, Price, US$ Mn, 2017-2031
Figure 39: North America Carpets & Rugs Market, Price, Incremental Opportunity, 2017-2031
Figure 40: North America Carpets & Rugs Market, End User, Million Square Feet, 2017-2031
Figure 41: North America Carpets & Rugs Market, End User, US$ Mn, 2017-2031
Figure 42: North America Carpets & Rugs Market, End User, Incremental Opportunity, 2017-2031
Figure 43: North America Carpets & Rugs Market, Distribution Channel, Million Square Feet, 2017-2031
Figure 44: North America Carpets & Rugs Market, Distribution Channel, US$ Mn, 2017-2031
Figure 45: North America Carpets & Rugs Market, Distribution Channel, Incremental Opportunity, 2017-2031
Figure 46: North America Carpets & Rugs Market, Country, Million Square Feet, 2017-2031
Figure 47: North America Carpets & Rugs Market, Country, US$ Mn, 2017-2031
Figure 48: North America Carpets & Rugs Market, Country, Incremental Opportunity, 2017-2031
Figure 49: Europe Carpets & Rugs Market, by Product Type, Million Square Feet, 2017-2031
Figure 50: Europe Carpets & Rugs Market, by Product Type, US$ Mn, 2017-2031
Figure 51: Europe Carpets & Rugs Market, by Product Type, Incremental Opportunity, 2017-2031
Figure 52: Europe Carpets & Rugs Market, Method of Construction, Million Square Feet, 2017-2031
Figure 53: Europe Carpets & Rugs Market, Method of Construction, US$ Mn, 2017-2031
Figure 54: Europe Carpets & Rugs Market, Method of Construction, Incremental Opportunity, 2017-2031
Figure 55: Europe Carpets & Rugs Market, Category, Million Square Feet, 2017-2031
Figure 56: Europe Carpets & Rugs Market, Category, US$ Mn, 2017-2031
Figure 57: Europe Carpets & Rugs Market, Category, Incremental Opportunity, 2017-2031
Figure 58: Europe Carpets & Rugs Market, Material, Million Square Feet, 2017-2031
Figure 59: Europe Carpets & Rugs Market, Material, US$ Mn, 2017-2031
Figure 60: Europe Carpets & Rugs Market, Material, Incremental Opportunity, 2017-2031
Figure 61: Europe Carpets & Rugs Market, Price, Million Square Feet, 2017-2031
Figure 62: Europe Carpets & Rugs Market, Price, US$ Mn, 2017-2031
Figure 63: Europe Carpets & Rugs Market, Price, Incremental Opportunity, 2017-2031
Figure 64: Europe Carpets & Rugs Market, End User, Million Square Feet, 2017-2031
Figure 65: Europe Carpets & Rugs Market, End User, US$ Mn, 2017-2031
Figure 66: Europe Carpets & Rugs Market, End User, Incremental Opportunity, 2017-2031
Figure 67: Europe Carpets & Rugs Market, Distribution Channel, Million Square Feet, 2017-2031
Figure 68: Europe Carpets & Rugs Market, Distribution Channel, US$ Mn, 2017-2031
Figure 69: Europe Carpets & Rugs Market, Distribution Channel, Incremental Opportunity, 2017-2031
Figure 70: Europe Carpets & Rugs Market, Country, Million Square Feet, 2017-2031
Figure 71: Europe Carpets & Rugs Market, Country, US$ Mn, 2017-2031
Figure 72: Europe Carpets & Rugs Market, Country, Incremental Opportunity, 2017-2031
Figure 73: Asia Pacific Carpets & Rugs Market, by Product Type, Million Square Feet, 2017-2031
Figure 74: Asia Pacific Carpets & Rugs Market, by Product Type, US$ Mn, 2017-2031
Figure 75: Asia Pacific Carpets & Rugs Market, by Product Type, Incremental Opportunity, 2017-2031
Figure 76: Asia Pacific Carpets & Rugs Market, Method of Construction, Million Square Feet, 2017-2031
Figure 77: Asia Pacific Carpets & Rugs Market, Method of Construction, US$ Mn, 2017-2031
Figure 78: Asia Pacific Carpets & Rugs Market, Method of Construction, Incremental Opportunity, 2017-2031
Figure 79: Asia Pacific Carpets & Rugs Market, Category, Million Square Feet, 2017-2031
Figure 80: Asia Pacific Carpets & Rugs Market, Category, US$ Mn, 2017-2031
Figure 81: Asia Pacific Carpets & Rugs Market, Category, Incremental Opportunity, 2017-2031
Figure 82: Asia Pacific Carpets & Rugs Market, Material, Million Square Feet, 2017-2031
Figure 83: Asia Pacific Carpets & Rugs Market, Material, US$ Mn, 2017-2031
Figure 84: Asia Pacific Carpets & Rugs Market, Material, Incremental Opportunity, 2017-2031
Figure 85: Asia Pacific Carpets & Rugs Market, Price, Million Square Feet, 2017-2031
Figure 86: Asia Pacific Carpets & Rugs Market, Price, US$ Mn, 2017-2031
Figure 87: Asia Pacific Carpets & Rugs Market, Price, Incremental Opportunity, 2017-2031
Figure 88: Asia Pacific Carpets & Rugs Market, End User, Million Square Feet, 2017-2031
Figure 89: Asia Pacific Carpets & Rugs Market, End User, US$ Mn, 2017-2031
Figure 90: Asia Pacific Carpets & Rugs Market, End User, Incremental Opportunity, 2017-2031
Figure 91: Asia Pacific Carpets & Rugs Market, Distribution Channel, Million Square Feet, 2017-2031
Figure 92: Asia Pacific Carpets & Rugs Market, Distribution Channel, US$ Mn, 2017-2031
Figure 93: Asia Pacific Carpets & Rugs Market, Distribution Channel, Incremental Opportunity, 2017-2031
Figure 94: Asia Pacific Carpets & Rugs Market, Country, Million Square Feet, 2017-2031
Figure 95: Asia Pacific Carpets & Rugs Market, Country, US$ Mn, 2017-2031
Figure 96: Asia Pacific Carpets & Rugs Market, Country, Incremental Opportunity, 2017-2031
Figure 97: Middle East & Africa Carpets & Rugs Market, by Product Type, Million Square Feet, 2017-2031
Figure 98: Middle East & Africa Carpets & Rugs Market, by Product Type, US$ Mn, 2017-2031
Figure 99: Middle East & Africa Carpets & Rugs Market, by Product Type, Incremental Opportunity, 2017-2031
Figure 100: Middle East & Africa Carpets & Rugs Market, Method of Construction, Million Square Feet, 2017-2031
Figure 101: Middle East & Africa Carpets & Rugs Market, Method of Construction, US$ Mn, 2017-2031
Figure 102: Middle East & Africa Carpets & Rugs Market, Method of Construction, Incremental Opportunity, 2017-2031
Figure 103: Middle East & Africa Carpets & Rugs Market, Category, Million Square Feet, 2017-2031
Figure 104: Middle East & Africa Carpets & Rugs Market, Category, US$ Mn, 2017-2031
Figure 105: Middle East & Africa Carpets & Rugs Market, Category, Incremental Opportunity, 2017-2031
Figure 106: Middle East & Africa Carpets & Rugs Market, Material, Million Square Feet, 2017-2031
Figure 107: Middle East & Africa Carpets & Rugs Market, Material, US$ Mn, 2017-2031
Figure 108: Middle East & Africa Carpets & Rugs Market, Material, Incremental Opportunity, 2017-2031
Figure 109: Middle East & Africa Carpets & Rugs Market, Price, Million Square Feet, 2017-2031
Figure 110: Middle East & Africa Carpets & Rugs Market, Price, US$ Mn, 2017-2031
Figure 111: Middle East & Africa Carpets & Rugs Market, Price, Incremental Opportunity, 2017-2031
Figure 112: Middle East & Africa Carpets & Rugs Market, End User, Million Square Feet, 2017-2031
Figure 113: Middle East & Africa Carpets & Rugs Market, End User, US$ Mn, 2017-2031
Figure 114: Middle East & Africa Carpets & Rugs Market, End User, Incremental Opportunity, 2017-2031
Figure 115: Middle East & Africa Carpets & Rugs Market, Distribution Channel, Million Square Feet, 2017-2031
Figure 116: Middle East & Africa Carpets & Rugs Market, Distribution Channel, US$ Mn, 2017-2031
Figure 117: Middle East & Africa Carpets & Rugs Market, Distribution Channel, Incremental Opportunity, 2017-2031
Figure 118: Middle East & Africa Carpets & Rugs Market, Country, Million Square Feet, 2017-2031
Figure 119: Middle East & Africa Carpets & Rugs Market, Country, US$ Mn, 2017-2031
Figure 120: Middle East & Africa Carpets & Rugs Market, Country, Incremental Opportunity, 2017-2031
Figure 121: South America Carpets & Rugs Market, by Product Type, Million Square Feet, 2017-2031
Figure 122: South America Carpets & Rugs Market, by Product Type, US$ Mn, 2017-2031
Figure 123: South America Carpets & Rugs Market, by Product Type, Incremental Opportunity, 2017-2031
Figure 124: South America Carpets & Rugs Market, Method of Construction, Million Square Feet, 2017-2031
Figure 125: South America Carpets & Rugs Market, Method of Construction, US$ Mn, 2017-2031
Figure 126: South America Carpets & Rugs Market, Method of Construction, Incremental Opportunity, 2017-2031
Figure 127: South America Carpets & Rugs Market, Category, Million Square Feet, 2017-2031
Figure 128: South America Carpets & Rugs Market, Category, US$ Mn, 2017-2031
Figure 129: South America Carpets & Rugs Market, Category, Incremental Opportunity, 2017-2031
Figure 130: South America Carpets & Rugs Market, Material, Million Square Feet, 2017-2031
Figure 131: South America Carpets & Rugs Market, Material, US$ Mn, 2017-2031
Figure 132: South America Carpets & Rugs Market, Material, Incremental Opportunity, 2017-2031
Figure 133: South America Carpets & Rugs Market, Price, Million Square Feet, 2017-2031
Figure 134: South America Carpets & Rugs Market, Price, US$ Mn, 2017-2031
Figure 135: South America Carpets & Rugs Market, Price, Incremental Opportunity, 2017-2031
Figure 136: South America Carpets & Rugs Market, End User, Million Square Feet, 2017-2031
Figure 137: South America Carpets & Rugs Market, End User, US$ Mn, 2017-2031
Figure 138: South America Carpets & Rugs Market, End User, Incremental Opportunity, 2017-2031
Figure 139: South America Carpets & Rugs Market, Distribution Channel, Million Square Feet, 2017-2031
Figure 140: South America Carpets & Rugs Market, Distribution Channel, US$ Mn, 2017-2031
Figure 141: South America Carpets & Rugs Market, Distribution Channel, Incremental Opportunity, 2017-2031
Figure 142: South America Carpets & Rugs Market, Country, Million Square Feet, 2017-2031
Figure 143: South America Carpets & Rugs Market, Country, US$ Mn, 2017-2031
Figure 144: South America Carpets & Rugs Market, Country, Incremental Opportunity, 2017-2031
Copyright © Transparency Market Research, Inc. All Rights reserved
Trust Online

Carpets & Rugs Market