
Reports
Reports
Analysts’ Viewpoint on Cable Assembly Market Scenario
Cable assembly is primarily used to transmit power, signals, and information to the designated application and to provide protection to cables. The cable assembly is easy to install, repair, and maintain, which helps save time during replacement purposes. Presently, cable assembly companies are focusing on high-growth applications such as high performance computing (HPC), artificial intelligence (GPU to GPU), core routing, switching, and infotainment systems in order to grow post the COVID-19 pandemic. Consequently, the market is expected to grow at a notable pace during the forecast period, owing to the numerous advantages offered by cable assembly such as minimal wastage of cable, high performance, ease of set up, etc.
Cable assemblies are widely used in mass production and can save time in assembling an entire machine or piece of equipment, especially when used repeatedly for each manufactured unit. They are also referred to as wiring looms or harnesses. Cable assemblies are integral to the production of diverse products, ranging from wearables to home electronics equipment. Various types of cable assemblies are key to interconnecting electronic equipment, components, and systems for optimum functionality owing to their reliability, durability, and all-around high quality. For instance, the use of coaxial cable assembly to connect computers to Ethernet connections, receivers to antennas, or the use of cable harness assembly in the automotive industry. Most cable assemblies are made of environment-friendly recyclable materials, and they have an extensive range of connectors and terminals. This helps control output, input, data, and electrical current in an efficient and effective manner.
Production processes currently employed in the food and beverage industry are characterized by stringent hygiene regulations. When it comes to hygiene regulation, the most important part of hygiene are germs and impurities, which must not allowed to form and come into contact with foods. Moreover, in the food and beverage industry, highly corrosive cleaning agents and chemicals are used to clean and sanitize machines and equipment. Therefore, the cable assembly is extensively used owing to its ability to withstand mechanical stress, chemical stress, and thermal stress. Demand for cable assembly has increased in the food & beverage industry because cable assemblies are used in warming and heating equipment, slicers, mixers, etc.
Cable assemblies also help minimize downtime, increase productivity, ensure quality, and increase safety for employees. This is estimated to boosts the adoption of cable assemblies in the food and beverage industry and consequently drive the global cable assembly market during the forecast period.
Custom cables assemblies need a metallic conductor to carry electrical load throughout the product’s lifetime. Heavy duty connectors are required in custom cables to withstand high humidity, high temperature, or electromagnetic interference (EMI), water, saltwater, particles, or vibration. The conductor in custom cable assemblies plays a vital role because the large power needed for electronic equipment requires a larger conductor to protect the cable and electronic devices from damage. This boosts the demand for custom cable assemblies.
Electronic appliances such as home theater systems need custom cable assemblies to ensure optimum performance because custom cable assemblies are manufactured to operate multiple function such as power, signal, and voltages, etc.
Small and large manufacturers are focused on the development of custom cable assemblies to cater to the demands of advanced electronic equipment and compact devices as well. Thus, increased use of custom cable assembly in compact electronic devices is projected to propel the global cable assembly market during the forecast period.
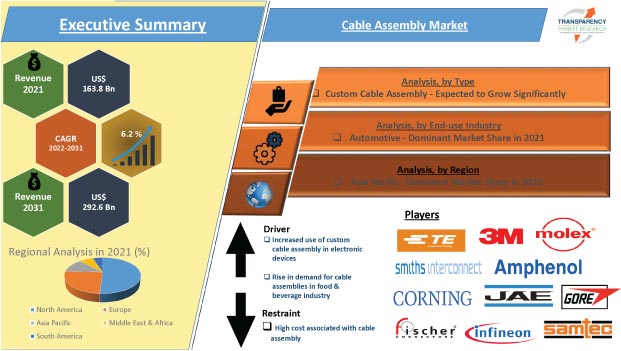
In terms of type, the global cable assembly market can be segregated into discrete wire assemblies, fiber optic cable assemblies, RF cable assemblies, ribbon cable assemblies, custom cable assemblies, coaxial cable assemblies, and others. The custom cable assemblies segment dominated the global cable harness assembly market, as they help save space and reduce weight of cables. Moreover, custom cable assemblies saving of assembly time by eliminating cable ties and cable loops, while improving performance and safety. This helps propel the cable assembly market size.
Analysis of the global cable assembly market trends reveal that, presently, various cable assembly manufacturers offer custom industrial cables and assemblies, such as rectangular cable assemblies, circular cable assemblies, and printed circuit board (PCB) assemblies, for automotive, industrial control and instrumentation systems, radio frequency (RF), personal computers (PCs) and local area network (LAN), audio/video (AV), and telecommunication applications.
In terms of end-use industry, the cable assembly market has been classified into automotive, IT and telecommunication, aerospace and defense, healthcare, industrial, and others. The automotive segment dominated the global cable assembly market owing to increased use of copper cable assemblies in motor vehicles such as gear boxes, door, side mirror, window, headlight, etc.
Use of RF cable assemblies and coaxial cable assemblies in infotainment systems, such as in-seat DVD players, global positioning systems, and Bluetooth connectivity, ensure systems work properly. However, low voltage differential signaling (LVDS) cable assemblies are also necessary for power in-car display units such as radio screens and backup cameras. All these factors boost the automotive segment of the cable assembly market.
Asia Pacific dominated the global cable assembly market owing to the presence of a large number of cable assembly manufacturers in countries, such as Japan, India, and China, in the region. Moreover, rise in industrialization, urbanization, and the demand for electric vehicles is driving the adoption of cable assembly in Asia Pacific.
The market in North America is expected to grow considerably in the next few years due to an increase of demand for cable assembly in military communications. Furthermore, a rise in need for cable assemblies in IT & telecommunication sector is also projected to propel the cable assembly market in the region.
The global cable assembly market is fragmented with a small number of large-scale vendors controlling the majority of the market share. Expansion of product portfolios and mergers and acquisitions are major strategies adopted by key players. Prominent cable assembly manufacturers operating in the global market include 3M Company, AFCI, Amphenol Corporation, Cable Manufacturing & Assembly Co., Carlisle Interconnect Technologies, Carrio Cabling, DC Electronics, Epec LLC, Fischer Connectors SA, Infineon Technologies AG, Minnesota Wire Company, Molex, LLC, PSC Electronics, Samtec, Smith’s Interconnect Inc., TE Connectivity, TMB, TPC Wire & Cable Corp., W. L. Gore & Associates, Inc., and Walker Component Group, Inc.
Each of these players has been profiled in the cable assembly market report based on parameters such as company overview, financial overview, business strategies, product portfolio, business segments, and recent developments
|
Attribute |
Detail |
|
Market Size Value in 2021 |
US$ 163.8 Bn |
|
Market Forecast Value in 2031 |
US$ 292.6 Bn |
|
Growth Rate (CAGR) |
6.2% |
|
Forecast Period |
2022–2031 |
|
Historical Data Available for |
2017–2020 |
|
Quantitative Units |
US$ Bn for Value & Billion for Volume |
|
Market Analysis |
It includes cross segment analysis at global as well as regional level. Furthermore, qualitative analysis includes drivers, restraints, opportunities, key trends, Porter’s Five Forces analysis, value chain analysis, and key trend analysis. |
|
Competition Landscape |
|
|
Format |
Electronic (PDF) + Excel |
|
Market Segmentation |
|
|
Regions Covered |
|
|
Countries Covered |
|
|
Companies Profiled |
|
|
Customization Scope |
Available upon request |
|
Pricing |
Available upon request |
The cable assembly market stood at US$ 163.8 Bn in 2021.
The cable assembly market is expected to rise at a CAGR of 6.2% from 2022 to 2031.
Increase in use of custom cable assembly in electronic devices and rise in demand for cable assembly from food & beverage industry.
The automotive segment accounted for major share of 28.6% of the cable assembly market in 2021.
Asia Pacific region accounted for major share of 43.5% of the global cable assembly market.
The U.S. accounted for 14.9% share of the cable assembly market.
3M Company, AFCI, Amphenol Corporation, Cable Manufacturing & Assembly Co., Carlisle Interconnect Technologies, Carrio Cabling, DC Electronics, Epec LLC, Fischer Connectors SA, Infineon Technologies AG, Minnesota Wire Company, Molex, LLC, PSC Electronics, Samtec, Smith’s Interconnect Inc., TE Connectivity, TMB, TPC Wire & Cable Corp., W. L. Gore & Associates, Inc., and Walker Component Group, Inc.
1. Preface
1.1. Market Introduction
1.2. Market and Segments Definition
1.3. Market Taxonomy
1.4. Research Methodology
1.5. Assumption and Acronyms
2. Executive Summary
2.1. Global Cable Assembly Market Overview
2.2. Regional Outline
2.3. Industry Outline
2.4. Market Dynamics Snapshot
2.5. Competition Blueprint
3. Market Dynamics
3.1. Macro-economic Factors
3.2. Drivers
3.3. Restraints
3.4. Opportunities
3.5. Key Trends
3.6. Regulatory Framework
4. Associated Industry and Key Indicator Assessment
4.1. Parent Industry Overview – Global Electronic Component Industry
4.2. Supply Chain Analysis
4.3. Pricing Analysis
4.4. Technology Roadmap Analysis
4.5. Industry SWOT Analysis
4.6. Porter Five Forces Analysis
4.7. Covid-19 Impact and Recovery Analysis
5. Global Cable Assembly Market Analysis, by Type
5.1. Cable Assembly Market Value (US$ Bn) and Volume (Billion Units) Analysis & Forecast, by Type, 2017–2031
5.1.1. Discrete Wire Assemblies
5.1.2. Optic Cable Assemblies
5.1.3. RF Cable Assemblies
5.1.4. Ribbon Cable Assemblies
5.1.5. Coaxial Cable Assemblies
5.1.6. Custom Cable Assemblies
5.1.7. Others
5.2. Market Attractiveness Analysis, by Type
6. Global Cable Assembly Market Analysis, by End-use Industry
6.1. Cable Assembly Market Value (US$ Bn) Analysis & Forecast, by End-use Industry, 2017–2031
6.1.1. Automotive
6.1.2. IT and Telecommunication
6.1.3. Aerospace and Defense
6.1.4. Healthcare
6.1.5. Industrial
6.1.6. Others
6.2. Market Attractiveness Analysis, by End-use Industry
7. Global Cable Assembly Market Analysis and Forecast, by Region
7.1. Cable Assembly Market Value (US$ Bn) and Volume (Billion Units) Analysis & Forecast, by Region, 2017–2031
7.1.1. North America
7.1.2. Europe
7.1.3. Asia Pacific
7.1.4. Middle East & Africa
7.1.5. South America
7.2. Market Attractiveness Analysis, by Region
8. North America Cable Assembly Market Analysis and Forecast
8.1. Market Snapshot
8.2. Drivers and Restraints: Impact Analysis
8.3. Cable Assembly Market Value (US$ Bn) and Volume (Billion Units) Analysis & Forecast, by Type, 2017–2031
8.3.1. Discrete Wire Assemblies
8.3.2. Optic Cable Assemblies
8.3.3. RF Cable Assemblies
8.3.4. Ribbon Cable Assemblies
8.3.5. Coaxial Cable Assemblies
8.3.6. Custom Cable Assemblies
8.3.7. Others
8.4. Cable Assembly Market Value (US$ Bn) Analysis & Forecast, by End-use Industry, 2017–2031
8.4.1. Automotive
8.4.2. IT and Telecommunication
8.4.3. Aerospace and Defense
8.4.4. Healthcare
8.4.5. Industrial
8.4.6. Others
8.5. Cable Assembly Market Value (US$ Bn) and Volume (Billion Units) Analysis & Forecast, by Country and Sub-region, 2017–2031
8.5.1. U.S.
8.5.2. Canada
8.5.3. Rest of North America
8.6. Market Attractiveness Analysis
8.6.1. By Type
8.6.2. By End-use Industry
8.6.3. By Country and Sub-region
9. Europe Cable Assembly Market Analysis and Forecast
9.1. Market Snapshot
9.2. Drivers and Restraints: Impact Analysis
9.3. Cable Assembly Market Value (US$ Bn) and Volume (Billion Units) Analysis & Forecast, by Type, 2017–2031
9.3.1. Discrete Wire Assemblies
9.3.2. Optic Cable Assemblies
9.3.3. RF Cable Assemblies
9.3.4. Ribbon Cable Assemblies
9.3.5. Coaxial Cable Assemblies
9.3.6. Custom Cable Assemblies
9.3.7. Others
9.4. Cable Assembly Market Value (US$ Bn) Analysis & Forecast, by End-use Industry, 2017–2031
9.4.1. Automotive
9.4.2. IT and Telecommunication
9.4.3. Aerospace and Defense
9.4.4. Healthcare
9.4.5. Industrial
9.4.6. Others
9.5. Cable Assembly Market Value (US$ Bn) and Volume (Billion Units) Analysis & Forecast, by Country and Sub-region, 2017–2031
9.5.1. U.K.
9.5.2. Germany
9.5.3. France
9.5.4. Rest of Europe
9.6. Market Attractiveness Analysis
9.6.1. By Type
9.6.2. By End-use Industry
9.6.3. By Country and Sub-region
10. Asia Pacific Cable Assembly Market Analysis and Forecast
10.1. Market Snapshot
10.2. Drivers and Restraints: Impact Analysis
10.3. Cable Assembly Market Value (US$ Bn) and Volume (Billion Units) Analysis & Forecast, by Type, 2017–2031
10.3.1. Discrete Wire Assemblies
10.3.2. Optic Cable Assemblies
10.3.3. RF Cable Assemblies
10.3.4. Ribbon Cable Assemblies
10.3.5. Coaxial Cable Assemblies
10.3.6. Custom Cable Assemblies
10.3.7. Others
10.4. Cable Assembly Market Value (US$ Bn) Analysis & Forecast, by End-use Industry, 2017–2031
10.4.1. Automotive
10.4.2. IT and Telecommunication
10.4.3. Aerospace and Defense
10.4.4. Healthcare
10.4.5. Industrial
10.4.6. Others
10.5. Cable Assembly Market Value (US$ Bn) and Volume (Billion Units) Analysis & Forecast, by Country and Sub-region, 2017–2031
10.5.1. China
10.5.2. India
10.5.3. Japan
10.5.4. South Korea
10.5.5. ASEAN
10.5.6. Rest of Asia Pacific
10.6. Market Attractiveness Analysis
10.6.1. By Type
10.6.2. By End-use Industry
10.6.3. By Country and Sub-region
11. Middle East & Africa Cable Assembly Market Analysis and Forecast
11.1. Market Snapshot
11.2. Drivers and Restraints: Impact Analysis
11.3. Cable Assembly Market Value (US$ Bn) and Volume (Billion Units) Analysis & Forecast, by Type, 2017–2031
11.3.1. Discrete Wire Assemblies
11.3.2. Optic Cable Assemblies
11.3.3. RF Cable Assemblies
11.3.4. Ribbon Cable Assemblies
11.3.5. Coaxial Cable Assemblies
11.3.6. Custom Cable Assemblies
11.3.7. Others
11.4. Cable Assembly Market Value (US$ Bn) Analysis & Forecast, by End-use Industry, 2017–2031
11.4.1. Automotive
11.4.2. IT and Telecommunication
11.4.3. Aerospace and Defense
11.4.4. Healthcare
11.4.5. Industrial
11.4.6. Others
11.5. Cable Assembly Market Value (US$ Bn) and Volume (Billion Units) Analysis & Forecast, by Country and Sub-region, 2017–2031
11.5.1. GCC
11.5.2. South Africa
11.5.3. Rest of the Middle East & Africa
11.6. Market Attractiveness Analysis
11.6.1. By Type
11.6.2. By End-use Industry
11.6.3. By Country and Sub-region
12. South America Cable Assembly Market Analysis and Forecast
12.1. Market Snapshot
12.2. Drivers and Restraints: Impact Analysis
12.3. Cable Assembly Market Value (US$ Bn) and Volume (Billion Units) Analysis & Forecast, by Type, 2017–2031
12.3.1. Discrete Wire Assemblies
12.3.2. Optic Cable Assemblies
12.3.3. RF Cable Assemblies
12.3.4. Ribbon Cable Assemblies
12.3.5. Coaxial Cable Assemblies
12.3.6. Custom Cable Assemblies
12.3.7. Others
12.4. Cable Assembly Market Value (US$ Bn) Analysis & Forecast, by End-use Industry, 2017–2031
12.4.1. Automotive
12.4.2. IT and Telecommunication
12.4.3. Aerospace and Defense
12.4.4. Healthcare
12.4.5. Industrial
12.4.6. Others
12.5. Cable Assembly Market Value (US$ Bn) and Volume (Billion Units) Analysis & Forecast, by Country and Sub-region, 2017–2031
12.5.1. Brazil
12.5.2. Rest of South America
12.6. Market Attractiveness Analysis
12.6.1. By Type
12.6.2. By End-use Industry
12.6.3. By Country and Sub-region
13. Competition Assessment
13.1. Global Cable Assembly Market Competition Matrix - a Dashboard View
13.1.1. Global Cable Assembly Market Company Share Analysis, by Value (2021)
13.1.2. Technological Differentiator
14. Company Profiles (Global Manufacturers/Suppliers)
14.1. 3M Company
14.1.1. Overview
14.1.2. Product Portfolio
14.1.3. Sales Footprint
14.1.4. Key Subsidiaries or Distributors
14.1.5. Strategy and Recent Developments
14.1.6. Key Financials
14.2. AFCI
14.2.1. Overview
14.2.2. Product Portfolio
14.2.3. Sales Footprint
14.2.4. Key Subsidiaries or Distributors
14.2.5. Strategy and Recent Developments
14.2.6. Key Financials
14.3. Amphenol Corporation.
14.3.1. Overview
14.3.2. Product Portfolio
14.3.3. Sales Footprint
14.3.4. Key Subsidiaries or Distributors
14.3.5. Strategy and Recent Developments
14.3.6. Key Financials
14.4. Cable Manufacturing & Assembly Co.
14.4.1. Overview
14.4.2. Product Portfolio
14.4.3. Sales Footprint
14.4.4. Key Subsidiaries or Distributors
14.4.5. Strategy and Recent Developments
14.4.6. Key Financials
14.5. Carlisle Interconnect Technologies
14.5.1. Overview
14.5.2. Product Portfolio
14.5.3. Sales Footprint
14.5.4. Key Subsidiaries or Distributors
14.5.5. Strategy and Recent Developments
14.5.6. Key Financials
14.6. Carrio Cabling
14.6.1. Overview
14.6.2. Product Portfolio
14.6.3. Sales Footprint
14.6.4. Key Subsidiaries or Distributors
14.6.5. Strategy and Recent Developments
14.6.6. Key Financials
14.7. DC Electronics
14.7.1. Overview
14.7.2. Product Portfolio
14.7.3. Sales Footprint
14.7.4. Key Subsidiaries or Distributors
14.7.5. Strategy and Recent Developments
14.7.6. Key Financials
14.8. Epec, LLC.
14.8.1. Overview
14.8.2. Product Portfolio
14.8.3. Sales Footprint
14.8.4. Key Subsidiaries or Distributors
14.8.5. Strategy and Recent Developments
14.8.6. Key Financials
14.9. Fischer Connectors SA
14.9.1. Overview
14.9.2. Product Portfolio
14.9.3. Sales Footprint
14.9.4. Key Subsidiaries or Distributors
14.9.5. Strategy and Recent Developments
14.9.6. Key Financials
14.10. Infineon Technologies AG
14.10.1. Overview
14.10.2. Product Portfolio
14.10.3. Sales Footprint
14.10.4. Key Subsidiaries or Distributors
14.10.5. Strategy and Recent Developments
14.10.6. Key Financials
14.11. Minnesota Wire Company
14.11.1. Overview
14.11.2. Product Portfolio
14.11.3. Sales Footprint
14.11.4. Key Subsidiaries or Distributors
14.11.5. Strategy and Recent Developments
14.11.6. Key Financials
14.12. Molex, LLC
14.12.1. Overview
14.12.2. Product Portfolio
14.12.3. Sales Footprint
14.12.4. Key Subsidiaries or Distributors
14.12.5. Strategy and Recent Developments
14.12.6. Key Financials
14.13. PSC Electronics
14.13.1. Overview
14.13.2. Product Portfolio
14.13.3. Sales Footprint
14.13.4. Key Subsidiaries or Distributors
14.13.5. Strategy and Recent Developments
14.13.6. Key Financials
14.14. Samtec
14.14.1. Overview
14.14.2. Product Portfolio
14.14.3. Sales Footprint
14.14.4. Key Subsidiaries or Distributors
14.14.5. Strategy and Recent Developments
14.14.6. Key Financials
14.15. Smith’s Interconnect Inc.
14.15.1. Overview
14.15.2. Product Portfolio
14.15.3. Sales Footprint
14.15.4. Key Subsidiaries or Distributors
14.15.5. Strategy and Recent Developments
14.15.6. Key Financials
14.16. TE Connectivity
14.16.1. Overview
14.16.2. Product Portfolio
14.16.3. Sales Footprint
14.16.4. Key Subsidiaries or Distributors
14.16.5. Strategy and Recent Developments
14.16.6. Key Financials
14.17. TMB
14.17.1. Overview
14.17.2. Product Portfolio
14.17.3. Sales Footprint
14.17.4. Key Subsidiaries or Distributors
14.17.5. Strategy and Recent Developments
14.17.6. Key Financials
14.18. TPC Wire & Cable Corp.
14.18.1. Overview
14.18.2. Product Portfolio
14.18.3. Sales Footprint
14.18.4. Key Subsidiaries or Distributors
14.18.5. Strategy and Recent Developments
14.18.6. Key Financials
14.19. W. L. Gore & Associates, Inc.
14.19.1. Overview
14.19.2. Product Portfolio
14.19.3. Sales Footprint
14.19.4. Key Subsidiaries or Distributors
14.19.5. Strategy and Recent Developments
14.19.6. Key Financials
14.20. Walker Component Group, Inc
14.20.1. Overview
14.20.2. Product Portfolio
14.20.3. Sales Footprint
14.20.4. Key Subsidiaries or Distributors
14.20.5. Strategy and Recent Developments
14.20.6. Key Financials
15. Recommendation
15.1. Opportunity Assessment
15.1.1. By Type
15.1.2. By End-use Industry
15.1.3. By Region
List of Tables
Table 01: Global Cable Assembly Market Size & Forecast, by Type, Value (US$ Bn), 2017‒2031
Table 02: Global Cable Assembly Market Size & Forecast, by Type, Volume (Billion Units), 2017‒2031
Table 03: Global Cable Assembly Market Size & Forecast, by End-use Industry, Value (US$ Bn), 2017‒2031
Table 04: Global Cable Assembly Market Size & Forecast, by Region, Value (US$ Bn), 2017‒2031
Table 05: Global Cable Assembly Market Size & Forecast, by Region, Volume (Billion Units), 2017‒2031
Table 06: North America Cable Assembly Market Size & Forecast, by Type, Value (US$ Bn), 2017‒2031
Table 07: North America Cable Assembly Market Size & Forecast, by Type, Volume (Billion Units), 2017‒2031
Table 08: North America Cable Assembly Market Size & Forecast, by End-use Industry, Value (US$ Bn), 2017‒2031
Table 09: North America Cable Assembly Market Size & Forecast, by Country & Sub-region, Value (US$ Bn), 2017‒2031
Table 10: North America Cable Assembly Market Size & Forecast, by Country & Sub-region, Volume (Billion Units), 2017‒2031
Table 11: Europe Cable Assembly Market Size & Forecast, by Type, Value (US$ Bn), 2017‒2031
Table 12: Europe Cable Assembly Market Size & Forecast, by Type, Volume (Billion Units), 2017‒2031
Table 13: Europe Cable Assembly Market Size & Forecast, by End-use Industry, Value (US$ Bn), 2017‒2031
Table 14: Europe Cable Assembly Market Size & Forecast, by Country & Sub-region, Value (US$ Bn), 2017‒2031
Table 15: Europe Cable Assembly Market Size & Forecast, by Country & Sub-region, Volume (Billion Units), 2017‒2031
Table 16: Asia Pacific Cable Assembly Market Size & Forecast, by Type, Value (US$ Bn), 2017‒2031
Table 17: Asia Pacific Cable Assembly Market Size & Forecast, by Type, Volume (Billion Units), 2017‒2031
Table 18: Asia Pacific Cable Assembly Market Size & Forecast, by End-use Industry, Value (US$ Bn), 2017‒2031
Table 19: Asia Pacific Cable Assembly Market Size & Forecast, by Country & Sub-region, Value (US$ Bn), 2017‒2031
Table 20: Asia Pacific Cable Assembly Market Size & Forecast, by Country & Sub-region, Volume (Billion Units), 2017‒2031
Table 21: Middle East & Africa Cable Assembly Market Size & Forecast, by Type, Value (US$ Bn), 2017‒2031
Table 22: Middle East & Africa Cable Assembly Market Size & Forecast, by Type, Volume (Billion Units), 2017‒2031
Table 23: Middle East & Africa Cable Assembly Market Size & Forecast, by End-use Industry, Value (US$ Bn), 2017‒2031
Table 24: Middle East & Africa Cable Assembly Market Size & Forecast, by Country & Sub-region, Value (US$ Bn), 2017‒2031
Table 25: Middle East & Africa Cable Assembly Market Size & Forecast, by Country & Sub-region, Volume (Billion Units), 2017‒2031
Table 26: South America Cable Assembly Market Size & Forecast, by Type, Value (US$ Bn), 2017‒2031
Table 27: South America Cable Assembly Market Size & Forecast, by Type, Volume (Billion Units), 2017‒2031
Table 28: South America Cable Assembly Market Size & Forecast, by End-use Industry, Value (US$ Bn), 2017‒2031
Table 29: South America Cable Assembly Market Size & Forecast, by Country & Sub-region, Value (US$ Bn), 2017‒2031
Table 30: South America Cable Assembly Market Size & Forecast, by Country & Sub-region, Volume (Billion Units), 2017‒2031
List of Figures
Figure 01: Global Cable Assembly Price Trend Analysis (Average Price, US$)
Figure 02: Global Cable Assembly Market, Value (US$ Bn), 2017‒2031
Figure 03: Global Cable Assembly Market, Value (US$ Bn), 2017‒2031
Figure 04: Global Cable Assembly Market, Volume (Billion Units), 2017‒2031
Figure 05: Global Cable Assembly Market, Volume (Billion Units), 2017‒2031
Figure 06: Global Cable Assembly Market Size & Forecast, by Type, Revenue (US$ Bn), 2017‒2031
Figure 07: Global Cable Assembly Market Attractiveness, by Type, Value (US$ Bn), 2022‒2031
Figure 08: Global Cable Assembly Market Size & Forecast, by Type, Value (US$ Bn), 2022‒2031
Figure 09: Global Cable Assembly Market Attractiveness, by End-use Industry, Revenue (US$ Bn), 2022‒2031
Figure 10: Global Cable Assembly Market Attractiveness, by End-use Industry, Value (US$ Bn), 2022‒2031
Figure 11: Global Cable Assembly Market Size & Forecast, by End-use Industry, Value (US$ Bn), 2022‒2031
Figure 12: Global Cable Assembly Market Size & Forecast, by Region, Revenue (US$ Bn), 2022‒2031
Figure 13: Global Cable Assembly Market Size & Forecast, by Region, Value (US$ Bn), 2022‒2031
Figure 14: Global Cable Assembly Market Size & Forecast, by Region, Value (US$ Bn), 2022‒2031
Figure 15: North America Cable Assembly Market Size & Forecast, by Region, Value (US$ Bn), 2022‒2031
Figure 16: North America Cable Assembly Market, Value (US$ Bn), 2017‒2031
Figure 17: North America Cable Assembly Market, Volume (Billion Units), 2017‒2031
Figure 18: North America Cable Assembly Market, Volume (Billion Units), 2017‒2031
Figure 19: North America Cable Assembly Market Size & Forecast, by Type, Revenue (US$ Bn), 2017‒2031
Figure 20: North America Cable Assembly Market Attractiveness, by Type, Value (US$ Bn), 2022‒2031
Figure 21: North America Cable Assembly Market Size & Forecast, by Type, Value (US$ Bn), 2022‒2031
Figure 22: North America Cable Assembly Market Size & Forecast, by End-use Industry, Revenue (US$ Bn), 2017‒2031
Figure 23: North America Cable Assembly Market Attractiveness, by End-use Industry, Value (US$ Bn), 2022‒2031
Figure 24: North America Cable Assembly Market Size & Forecast, by End-use Industry, Value (US$ Bn), 2022‒2031
Figure 25: North America Cable Assembly Market Size & Forecast, by Country & Sub-region, Revenue (US$ Bn), 2022‒2031
Figure 26: North America Cable Assembly Market Size & Forecast, by Country & Sub-region, Value (US$ Bn), 2022‒2031
Figure 27: North America Cable Assembly Market Size & Forecast, by Country & Sub-region, Value (US$ Bn), 2022‒2031
Figure 28: Europe Cable Assembly Market Size & Forecast, by Region, Value (US$ Bn), 2022‒2031
Figure 29: Europe Cable Assembly Market, Value (US$ Bn), 2017‒2031
Figure 30: Europe Cable Assembly Market, Volume (Billion Units), 2017‒2031
Figure 31: Europe Cable Assembly Market, Volume (Billion Units), 2017‒2031
Figure 32: Europe Cable Assembly Market Size & Forecast, by Type, Revenue (US$ Bn), 2017‒2031
Figure 33: Europe Cable Assembly Market Attractiveness, by Type, Value (US$ Bn), 2022‒2031
Figure 34: Europe Cable Assembly Market Size & Forecast, by Type, Value (US$ Bn), 2022‒2031
Figure 35: Europe Cable Assembly Market Size & Forecast, by End-use Industry, Revenue (US$ Bn), 2017‒2031
Figure 36: Europe Cable Assembly Market Attractiveness, by End-use Industry, Value (US$ Bn), 2022‒2031
Figure 37: Europe Cable Assembly Market Size & Forecast, by End-use Industry, Value (US$ Bn), 2022‒2031
Figure 38: Europe Cable Assembly Market Size & Forecast, by Country & Sub-region, Revenue (US$ Bn), 2017‒2031
Figure 39: Europe Cable Assembly Market Attractiveness, by Country & Sub-region, Value (US$ Bn), 2022‒2031
Figure 40: Europe Cable Assembly Market Size & Forecast, by Country & Sub-region, Revenue (US$ Bn), 2022‒2031
Figure 41: Europe Cable Assembly Market Size & Forecast, by Country & Sub-region, Value (US$ Bn), 2022‒2031
Figure 42: Europe Cable Assembly Market Size & Forecast, by Country & Sub-region, Value (US$ Bn), 2022‒2031
Figure 43: Asia Pacific Cable Assembly Market Size & Forecast, by Region, Value (US$ Bn), 2022‒2031
Figure 44: Asia Pacific Cable Assembly Market, Value (US$ Bn), 2017‒2031
Figure 45: Asia Pacific Cable Assembly Market, Volume (Billion Units), 2017‒2031
Figure 46: Asia Pacific Cable Assembly Market, Volume (Billion Units), 2017‒2031
Figure 47: Asia Pacific Cable Assembly Market Size & Forecast, by Type, Revenue (US$ Bn), 2017‒2031
Figure 48: Asia Pacific Cable Assembly Market Attractiveness, by Type, Value (US$ Bn), 2022‒2031
Figure 49: Asia Pacific Cable Assembly Market Size & Forecast, by Type, Value (US$ Bn), 2022‒2031
Figure 50: Asia Pacific Cable Assembly Market Size & Forecast, by End-use Industry, Value (US$ Bn), 2022‒2031
Figure 51: Asia Pacific Cable Assembly Market Size & Forecast, by End-use Industry, Value (US$ Bn), 2022‒2031
Figure 52: Asia Pacific Cable Assembly Market Size & Forecast, by End-use Industry, Value (US$ Bn), 2022‒2031
Figure 53: Asia Pacific Cable Assembly Market Size & Forecast, by Country & Sub-region, Revenue (US$ Bn), 2017‒2031
Figure 54: Asia Pacific Cable Assembly Market Attractiveness, by Country & Sub-region, Value (US$ Bn), 2022‒2031
Figure 55: Asia Pacific Cable Assembly Market Size & Forecast, by Country & Sub-region, Value (US$ Bn), 2022‒2031
Figure 56: Middle East & Africa Cable Assembly Market Size & Forecast, by Region, Value (US$ Bn), 2022‒2031
Figure 57: Middle East & Africa Cable Assembly Market, Value (US$ Bn), 2017‒2031
Figure 58: Middle East & Africa Cable Assembly Market, Volume (Billion Units), 2017‒2031
Figure 59: Middle East & Africa Cable Assembly Market, Volume (Billion Units), 2017‒2031
Figure 60: Middle East & Africa Cable Assembly Market Size & Forecast, by Type, Revenue (US$ Bn), 2017‒2031
Figure 61: Middle East & Africa Cable Assembly Market Attractiveness, by Type, Value (US$ Bn), 2022‒2031
Figure 62: Middle East & Africa Cable Assembly Market Size & Forecast, by Type, Value (US$ Bn), 2022‒2031
Figure 63: Middle East & Africa Cable Assembly Market Size & Forecast, by End-use Industry, Value (US$ Bn), 2022‒2031
Figure 64: Middle East & Africa Cable Assembly Market Size & Forecast, by End-use Industry, Value (US$ Bn), 2022‒2031
Figure 65: Middle East & Africa Cable Assembly Market Size & Forecast, by End-use Industry, Value (US$ Bn), 2022‒2031
Figure 66: Middle East & Africa Cable Assembly Market Size & Forecast, by Country & Sub-region, Revenue (US$ Bn), 2017‒2031
Figure 67: Middle East & Africa Cable Assembly Market Attractiveness, by Country & Sub-region, Value (US$ Bn), 2022‒2031
Figure 68: Middle East & Africa Cable Assembly Market Size & Forecast, by Country & Sub-region, Value (US$ Bn), 2022‒2031
Figure 69: South America Cable Assembly Market Size & Forecast, by Region, Value (US$ Bn), 2022‒2031
Figure 70: South America Cable Assembly Market, Value (US$ Bn), 2017‒2031
Figure 71: South America Cable Assembly Market, Volume (Billion Units), 2017‒2031
Figure 72: South America Cable Assembly Market, Volume (Billion Units), 2017‒2031
Figure 73: South America Cable Assembly Market Size & Forecast, by Type, Revenue (US$ Bn), 2017‒2031
Figure 74: South America Cable Assembly Market Attractiveness, by Type, Value (US$ Bn), 2022‒2031
Figure 75: South America Cable Assembly Market Size & Forecast, by Type, Value (US$ Bn), 2022‒2031
Figure 76: South America Cable Assembly Market Size & Forecast, by End-use Industry, Value (US$ Bn), 2022‒2031
Figure 77: South America Cable Assembly Market Size & Forecast, by End-use Industry, Value (US$ Bn), 2022‒2031
Figure 78: South America Cable Assembly Market Size & Forecast, by End-use Industry, Value (US$ Bn), 2022‒2031
Figure 79: South America Cable Assembly Market Size & Forecast, by Country & Sub-region, Revenue (US$ Bn), 2017‒2031
Figure 80: South America Cable Assembly Market Attractiveness, by Country & Sub-region, Value (US$ Bn), 2022‒2031
Figure 81: South America Cable Assembly Market Size & Forecast, by Country & Sub-region, Value (US$ Bn), 2022‒2031
Figure 82: Global Cable Assembly Market Share Analysis, by Company
Copyright © Transparency Market Research, Inc. All Rights reserved
Trust Online

Cable Assembly Market