
Reports
Reports
The automotive industry is anticipated to return to its normalcy by the financial year of 2022 after the disruptions caused by the COVID-19 crisis. In a survey conducted by the Economist Intelligence Unit, the automotive sector has been affected due to a shortage of semiconductors, which led to several automakers to cut down production. This chip shortage is a result of the unprecedented demand for personal computers, laptops, and other mobile devices during the pandemic. Nevertheless, manufacturers are focusing on essential applications related to air conditioning and air brakes in buses.
Despite challenges posed by the coronavirus, the automotive industry is witnessing increased investment in electrification. Such trends are generating value-grab opportunities for companies in the bus compressor market. Apart from buses, bus compressor market stakeholders are diversifying the production of electric vehicles (EVs).
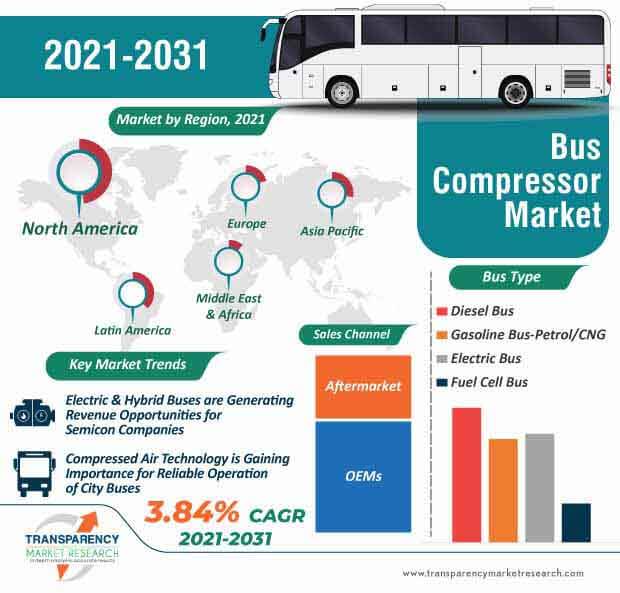
The bus compressor market is projected to reach US$ 208.21 Mn by 2031. Electric and hybrid buses are generating revenue opportunities for market stakeholders. WABCO - a global technology leader in commercial vehicle technology, is publicizing its electric air compressor, which is a standalone system involving a compressor, electrical motor, oil supply, and an oil pump.
Manufacturers are increasing the availability of electric air compressors that are capable of supporting air supply requirements for highly demanding applications such as city buses. They are innovating in electric air compressors that deliver air independently from the combustion engine and provide optimal utilization of the electric drivetrain.
The bus compressor market is expected to clock a CAGR of 3.84% during the forecast period. This is due to lack of R&D investments in bus compressors where automotive giants have an edge over emerging market players. Nevertheless, both emerging and established market players are scaling revenue opportunities in hybrid and electric buses.
Gardner Denver - a global provider of compressors, blowers, and vacuum pumps, is gaining recognition for its one package, one installation, and one solution compressors for hybrid & commercial vehicles such as buses, trains, and coaches.
Companies in the bus compressor market are leveraging the compressed air technology, which is gaining importance for safe and reliable operation of critical applications in city buses. Apart from air conditioning, manufacturers are diversifying in braking systems, air suspensions, and doors to expand revenue streams.
The transition of the mobility sector toward full electric and hybrid power buses is acting as a key driver for the bus compressor market. Atlas Copco - a Swedish multinational industrial company, is boosting the production of bus compressors that have the ability to run from batteries network, provide high air pressures, and a class leading efficiency within compact and lightweight packages.
Companies in the bus compressor market are providing flexible solutions for compressed air needs in buses, coaches, trucks, and custom electric and hybrid vehicles.
Analysts’ Viewpoint
COVID-19 related restrictions are being relaxed, which is helping to generate movement in public transport frequency, thus creating value-grab opportunities for manufacturers in the bus compressor market. It has been found that hybrid and fully electric buses demand much more of their sub-systems than their current diesel counterparts. Hence, companies should increase research expenditure for innovating in compressors that meet demanding applications of city buses in order to redefine weight, size, noise, and fuel-source of buses. Companies in the bus compressor market are increasing the availability of individual solutions for individual requirements. They are bolstering output capacities for compressors that can adapt to different cooling concepts.
|
Attribute |
Detail |
|
Market Size Value in 2020 (Base Year) |
US$ 137.67 Mn |
|
Market Forecast Value in 2031 |
US$ 208.21 Mn |
|
Growth Rate (CAGR) |
3.84% |
|
Forecast Period |
2021-2031 |
|
Quantitative Units |
US$ Mn for Value & ‘000 Units for Volume |
|
Market Analysis |
It includes cross segment analysis at global as well as regional level. Furthermore, qualitative analysis includes drivers, restraints, opportunities, key trends, Porters Five Forces analysis, value chain analysis, maritime industry trend analysis, etc. |
|
Competition Landscape |
|
|
Format |
Electronic (PDF) + Excel |
|
Market Segmentation |
|
|
Regions Covered |
|
|
Countries Covered |
|
|
Companies Profiled |
|
|
Customization Scope |
Available upon Request |
|
Pricing |
Available upon Request |
The global bus compressor market was worth US$ 137.67 Mn and is projected to reach a value of US$ 208.21 Mn by the end of 2025
Bus compressor market is anticipated to grow at a CAGR of 3.84% during the forecast period
North America accounted for a major share of the global bus compressor market
The major factor driving the demand for zero emission vehicles is increasing in order to overcome the issue of deteriorating environmental conditions.
Key players in the global bus compressor market include BorgWarner Inc., Denso Corporation, Hanon Systems, HELLA GmbH & Co. KGaA, Hitachi Automotive Systems, Ltd., MAHLE GmbH, Mitsubishi Electric Corporation, SANDEN HOLDINGS CORPORATION, Subros Limited, T/CCI Manufacturing, Toyota Industries Corporation, Voith GmbH & Co. KGaA, and Valeo SA.
1. Executive Summary
1.1. Global Market Outlook
1.1.1. Market Value US$ Mn, 2017‒2031
1.2. Competitive Dashboard Analysis
2. Market Overview
2.1. TMR Analysis and Recommendations
2.2. Market Coverage / Taxonomy
2.3. Market Definition / Scope / Limitations
2.4. Macro-Economic Factors
2.5. Market Dynamics
2.5.1. Drivers
2.5.2. Restraints
2.5.3. Opportunity
2.6. Market Factor Analysis
2.6.1. Porter’s Five Force Analysis
2.6.2. PESTEL Analysis
2.6.3. SWOT Analysis
2.6.4. Value Chain Analysis
2.6.4.1. Raw Material Supplier
2.6.4.2. Component Manufacturer
2.6.4.3. Sales Channel
2.6.4.4. OEMs/ End-users
2.7. Regulatory Scenario
2.8. Key Trend Analysis
3. COVID-19 Impact Analysis – Bus Compressor Market
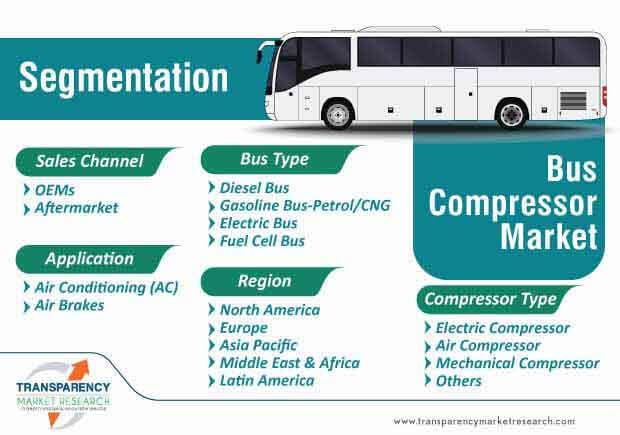
4. Global Bus Compressor Market, by Compressor Type
4.1. Market Snapshot
4.1.1. Introduction, Definition, and Key Findings
4.1.2. Market Growth & Y-o-Y Projections
4.1.3. Base Point Share Analysis
4.2. Global Bus Compressor Market Size Analysis & Forecast, by Compressor Type, 2017‒2031
4.2.1. Electric Compressor
4.2.2. Air Compressor
4.2.2.1. Rotary Screw Compressor
4.2.2.2. Reciprocating Air Compressor
4.2.2.3. Axial Compressor
4.2.2.4. Centrifugal Compressor
4.2.3. Mechanical Compressor
4.2.3.1. Swash Plate Compressor
4.2.3.2. Wobble Plate Compressor
4.2.3.3. Scroll Compressor
4.2.3.4. Others
5. Global Bus Compressor Market, By Bus Type
5.1. Market Snapshot
5.1.1. Introduction, Definition, and Key Findings
5.1.2. Market Growth & Y-o-Y Projections
5.1.3. Base Point Share Analysis
5.2. Global Bus Compressor Market Size Analysis & Forecast, by Bus Type, 2017‒2031
5.2.1. Diesel Bus
5.2.2. Gasoline Bus – Petrol/CNG
5.2.3. Electric Bus
5.2.3.1. Hybrid Electric Bus
5.2.3.2. Full Electric Bus
5.2.4. Fuel Cell Bus
6. Global Bus Compressor Market, By Application
6.1. Market Snapshot
6.1.1. Introduction, Definition, and Key Findings
6.1.2. Market Growth & Y-o-Y Projections
6.1.3. Base Point Share Analysis
6.2. Global Bus Compressor Market Size Analysis & Forecast, by Application, 2017‒2031
6.2.1. Air Conditioning (AC)
6.2.2. Air Brakes
7. Global Bus Compressor Market, By Sales Channel
7.1. Market Snapshot
7.1.1. Introduction, Definition, and Key Findings
7.1.2. Market Growth & Y-o-Y Projections
7.1.3. Base Point Share Analysis
7.2. Global Bus Compressor Market Size Analysis & Forecast, by Sales Channel, 2017‒2031
7.2.1. OEMs
7.2.2. Aftermarket
8. Global Bus Compressor Market, by Region
8.1. Market Snapshot
8.1.1. Introduction, Definition, and Key Findings
8.1.2. Market Growth & Y-o-Y Projections
8.1.3. Base Point Share Analysis
8.2. Global Bus Compressor Market Size Analysis & Forecast, by Region, 2017‒2031
8.2.1. North America
8.2.2. Europe
8.2.3. Asia Pacific
8.2.4. Middle East & Africa
8.2.5. Latin America
9. North America Bus Compressor Market
9.1. Market Snapshot
9.2. North America Bus Compressor Market Size Analysis & Forecast, by Compressor Type, 2017‒2031
9.2.1. Electric Compressor
9.2.2. Air Compressor
9.2.2.1. Rotary Screw Compressor
9.2.2.2. Reciprocating Air Compressor
9.2.2.3. Axial Compressor
9.2.2.4. Centrifugal Compressor
9.2.3. Mechanical Compressor
9.2.3.1. Swash Plate Compressor
9.2.3.2. Wobble Plate Compressor
9.2.3.3. Scroll Compressor
9.2.3.4. Others
9.3. North America Bus Compressor Market Size Analysis & Forecast, by Bus Type, 2017‒2031
9.3.1. Diesel Bus
9.3.2. Gasoline Bus – Petrol/CNG
9.3.3. Electric Bus
9.3.3.1. Hybrid Electric Bus
9.3.3.2. Full Electric Bus
9.3.4. Fuel Cell Bus
9.4. North America Bus Compressor Market Size Analysis & Forecast, by Application, 2017‒2031
9.4.1. Air Conditioning (AC)
9.4.2. Air Brakes
9.5. North America Bus Compressor Market Size Analysis & Forecast, by Sales Channel, 2017‒2031
9.5.1. OEMs
9.5.2. Aftermarket
9.6. Key Country Analysis – North America Bus Compressor Market Size Analysis & Forecast, 2017‒2031
9.6.1. U.S.
9.6.2. Canada
9.7. U.S. Bus Compressor Market
9.7.1. U.S. Bus Compressor Market Size Analysis & Forecast, by Compressor Type, 2017‒2031
9.7.1.1. Electric Compressor
9.7.1.2. Air Compressor
9.7.1.2.1. Rotary Screw Compressor
9.7.1.2.2. Reciprocating Air Compressor
9.7.1.2.3. Axial Compressor
9.7.1.2.4. Centrifugal Compressor
9.7.1.3. Mechanical Compressor
9.7.1.3.1. Swash Plate Compressor
9.7.1.3.2. Wobble Plate Compressor
9.7.1.3.3. Scroll Compressor
9.7.1.3.4. Others
9.7.2. U.S. Bus Compressor Market Size Analysis & Forecast, by Bus Type, 2017‒2031
9.7.2.1. Diesel Bus
9.7.2.2. Gasoline Bus – Petrol/CNG
9.7.2.3. Electric Bus
9.7.2.3.1. Hybrid Electric Bus
9.7.2.3.2. Full Electric Bus
9.7.2.4. Fuel Cell Bus
9.7.3. U.S. Bus Compressor Market Size Analysis & Forecast, by Application, 2017‒2031
9.7.3.1. Air Conditioning (AC)
9.7.3.2. Air Brakes
9.7.4. U.S. Bus Compressor Market Size Analysis & Forecast, by Sales Channel, 2017‒2031
9.7.4.1. OEMs
9.7.4.2. Aftermarket
9.8. Canada Bus Compressor Market
9.8.1. Canada Bus Compressor Market Size Analysis & Forecast, by Compressor Type, 2017‒2031
9.8.1.1. Electric Compressor
9.8.1.2. Air Compressor
9.8.1.2.1. Rotary Screw Compressor
9.8.1.2.2. Reciprocating Air Compressor
9.8.1.2.3. Axial Compressor
9.8.1.2.4. Centrifugal Compressor
9.8.1.3. Mechanical Compressor
9.8.1.3.1. Swash Plate Compressor
9.8.1.3.2. Wobble Plate Compressor
9.8.1.3.3. Scroll Compressor
9.8.1.3.4. Others
9.8.2. Canada Bus Compressor Market Size Analysis & Forecast, by Bus Type, 2017‒2031
9.8.2.1. Diesel Bus
9.8.2.2. Gasoline Bus – Petrol/CNG
9.8.2.3. Electric Bus
9.8.2.3.1. Hybrid Electric Bus
9.8.2.3.2. Full Electric Bus
9.8.2.4. Fuel Cell Bus
9.8.3. Canada Bus Compressor Market Size Analysis & Forecast, by Application, 2017‒2031
9.8.3.1. Air Conditioning (AC)
9.8.3.2. Air Brakes
9.8.4. Canada Bus Compressor Market Size Analysis & Forecast, by Sales Channel, 2017‒2031
9.8.4.1. OEMs
9.8.4.2. Aftermarket
10. Europe Bus Compressor Market
10.1. Market Snapshot
10.2. Europe Bus Compressor Market Size Analysis & Forecast, by Compressor Type, 2017‒2031
10.2.1. Electric Compressor
10.2.2. Air Compressor
10.2.2.1. Rotary Screw Compressor
10.2.2.2. Reciprocating Air Compressor
10.2.2.3. Axial Compressor
10.2.2.4. Centrifugal Compressor
10.2.3. Mechanical Compressor
10.2.3.1. Swash Plate Compressor
10.2.3.2. Wobble Plate Compressor
10.2.3.3. Scroll Compressor
10.2.3.4. Others
10.3. Europe Bus Compressor Market Size Analysis & Forecast, by Bus Type, 2017‒2031
10.3.1. Diesel Bus
10.3.2. Gasoline Bus – Petrol/CNG
10.3.3. Electric Bus
10.3.3.1. Hybrid Electric Bus
10.3.3.2. Full Electric Bus
10.3.4. Fuel Cell Bus
10.4. Europe Bus Compressor Market Size Analysis & Forecast, by Application, 2017‒2031
10.4.1. Air Conditioning (AC)
10.4.2. Air Brakes
10.5. Europe Bus Compressor Market Size Analysis & Forecast, by Sales Channel, 2017‒2031
10.5.1. OEMs
10.5.2. Aftermarket
10.6. Key Country Analysis – Europe Bus Compressor Market Size Analysis & Forecast, 2017‒2031
10.6.1. Germany
10.6.2. U. K.
10.6.3. France
10.6.4. Italy
10.6.5. Spain
10.6.6. Nordic Countries
10.6.7. Russia & CIS
10.6.8. Rest of Europe
10.7. Germany Bus Compressor Market
10.7.1. Germany Bus Compressor Market Size Analysis & Forecast, by Compressor Type, 2017‒2031
10.7.1.1. Electric Compressor
10.7.1.2. Air Compressor
10.7.1.2.1. Rotary Screw Compressor
10.7.1.2.2. Reciprocating Air Compressor
10.7.1.2.3. Axial Compressor
10.7.1.2.4. Centrifugal Compressor
10.7.1.3. Mechanical Compressor
10.7.1.3.1. Swash Plate Compressor
10.7.1.3.2. Wobble Plate Compressor
10.7.1.3.3. Scroll Compressor
10.7.1.3.4. Others
10.7.2. Germany Bus Compressor Market Size Analysis & Forecast, by Bus Type, 2017‒2031
10.7.2.1. Diesel Bus
10.7.2.2. Gasoline Bus – Petrol/CNG
10.7.2.3. Electric Bus
10.7.2.3.1. Hybrid Electric Bus
10.7.2.3.2. Full Electric Bus
10.7.2.4. Fuel Cell Bus
10.7.3. Germany Bus Compressor Market Size Analysis & Forecast, by Application, 2017‒2031
10.7.3.1. Air Conditioning (AC)
10.7.3.2. Air Brakes
10.7.4. Germany Bus Compressor Market Size Analysis & Forecast, by Sales Channel, 2017‒2031
10.7.4.1. OEMs
10.7.4.2. Aftermarket
10.8. U.K. Bus Compressor Market
10.8.1. U.K. Bus Compressor Market Size Analysis & Forecast, by Compressor Type, 2017‒2031
10.8.1.1. Electric Compressor
10.8.1.2. Air Compressor
10.8.1.2.1. Rotary Screw Compressor
10.8.1.2.2. Reciprocating Air Compressor
10.8.1.2.3. Axial Compressor
10.8.1.2.4. Centrifugal Compressor
10.8.1.3. Mechanical Compressor
10.8.1.3.1. Swash Plate Compressor
10.8.1.3.2. Wobble Plate Compressor
10.8.1.3.3. Scroll Compressor
10.8.1.3.4. Others
10.8.2. U.K. Bus Compressor Market Size Analysis & Forecast, by Bus Type, 2017‒2031
10.8.2.1. Diesel Bus
10.8.2.2. Gasoline Bus – Petrol/CNG
10.8.2.3. Electric Bus
10.8.2.3.1. Hybrid Electric Bus
10.8.2.3.2. Full Electric Bus
10.8.2.4. Fuel Cell Bus
10.8.3. U.K. Bus Compressor Market Size Analysis & Forecast, by Application, 2017‒2031
10.8.3.1. Air Conditioning (AC)
10.8.3.2. Air Brakes
10.8.4. U.K. Bus Compressor Market Size Analysis & Forecast, by Sales Channel, 2017‒2031
10.8.4.1. OEMs
10.8.4.2. Aftermarket
10.9. France Bus Compressor Market
10.9.1. France Bus Compressor Market Size Analysis & Forecast, by Compressor Type, 2017‒2031
10.9.1.1. Electric Compressor
10.9.1.2. Air Compressor
10.9.1.2.1. Rotary Screw Compressor
10.9.1.2.2. Reciprocating Air Compressor
10.9.1.2.3. Axial Compressor
10.9.1.2.4. Centrifugal Compressor
10.9.1.3. Mechanical Compressor
10.9.1.3.1. Swash Plate Compressor
10.9.1.3.2. Wobble Plate Compressor
10.9.1.3.3. Scroll Compressor
10.9.1.3.4. Others
10.9.2. France Bus Compressor Market Size Analysis & Forecast, by Bus Type, 2017‒2031
10.9.2.1. Diesel Bus
10.9.2.2. Gasoline Bus – Petrol/CNG
10.9.2.3. Electric Bus
10.9.2.3.1. Hybrid Electric Bus
10.9.2.3.2. Full Electric Bus
10.9.2.4. Fuel Cell Bus
10.9.3. France Bus Compressor Market Size Analysis & Forecast, by Application, 2017‒2031
10.9.3.1. Air Conditioning (AC)
10.9.3.2. Air Brakes
10.9.4. France Bus Compressor Market Size Analysis & Forecast, by Sales Channel, 2017‒2031
10.9.4.1. OEMs
10.9.4.2. Aftermarket
10.10. Italy Bus Compressor Market
10.10.1. Italy Bus Compressor Market Size Analysis & Forecast, by Compressor Type, 2017‒2031
10.10.1.1. Electric Compressor
10.10.1.2. Air Compressor
10.10.1.2.1. Rotary Screw Compressor
10.10.1.2.2. Reciprocating Air Compressor
10.10.1.2.3. Axial Compressor
10.10.1.2.4. Centrifugal Compressor
10.10.1.3. Mechanical Compressor
10.10.1.3.1. Swash Plate Compressor
10.10.1.3.2. Wobble Plate Compressor
10.10.1.3.3. Scroll Compressor
10.10.1.3.4. Others
10.10.2. Italy Bus Compressor Market Size Analysis & Forecast, by Bus Type, 2017‒2031
10.10.2.1. Diesel Bus
10.10.2.2. Gasoline Bus – Petrol/CNG
10.10.2.3. Electric Bus
10.10.2.3.1. Hybrid Electric Bus
10.10.2.3.2. Full Electric Bus
10.10.2.4. Fuel Cell Bus
10.10.3. Italy Bus Compressor Market Size Analysis & Forecast, by Application, 2017‒2031
10.10.3.1. Air Conditioning (AC)
10.10.3.2. Air Brakes
10.10.4. Italy Bus Compressor Market Size Analysis & Forecast, by Sales Channel, 2017‒2031
10.10.4.1. OEMs
10.10.4.2. Aftermarket
10.11. Spain Bus Compressor Market
10.11.1. Spain Bus Compressor Market Size Analysis & Forecast, by Compressor Type, 2017‒2031
10.11.1.1. Electric Compressor
10.11.1.2. Air Compressor
10.11.1.2.1. Rotary Screw Compressor
10.11.1.2.2. Reciprocating Air Compressor
10.11.1.2.3. Axial Compressor
10.11.1.2.4. Centrifugal Compressor
10.11.1.3. Mechanical Compressor
10.11.1.3.1. Swash Plate Compressor
10.11.1.3.2. Wobble Plate Compressor
10.11.1.3.3. Scroll Compressor
10.11.1.3.4. Others
10.11.2. Spain Bus Compressor Market Size Analysis & Forecast, by Bus Type, 2017‒2031
10.11.2.1. Diesel Bus
10.11.2.2. Gasoline Bus – Petrol/CNG
10.11.2.3. Electric Bus
10.11.2.3.1. Hybrid Electric Bus
10.11.2.3.2. Full Electric Bus
10.11.2.4. Fuel Cell Bus
10.11.3. Spain Bus Compressor Market Size Analysis & Forecast, by Application, 2017‒2031
10.11.3.1. Air Conditioning (AC)
10.11.3.2. Air Brakes
10.11.4. Spain Bus Compressor Market Size Analysis & Forecast, by Sales Channel, 2017‒2031
10.11.4.1. OEMs
10.11.4.2. Aftermarket
10.12. Nordic Countries Bus Compressor Market
10.12.1. Nordic Countries Bus Compressor Market Size Analysis & Forecast, by Compressor Type, 2017‒2031
10.12.1.1. Electric Compressor
10.12.1.2. Air Compressor
10.12.1.2.1. Rotary Screw Compressor
10.12.1.2.2. Reciprocating Air Compressor
10.12.1.2.3. Axial Compressor
10.12.1.2.4. Centrifugal Compressor
10.12.1.3. Mechanical Compressor
10.12.1.3.1. Swash Plate Compressor
10.12.1.3.2. Wobble Plate Compressor
10.12.1.3.3. Scroll Compressor
10.12.1.3.4. Others
10.12.2. Nordic Countries Bus Compressor Market Size Analysis & Forecast, by Bus Type, 2017‒2031
10.12.2.1. Diesel Bus
10.12.2.2. Gasoline Bus – Petrol/CNG
10.12.2.3. Electric Bus
10.12.2.3.1. Hybrid Electric Bus
10.12.2.3.2. Full Electric Bus
10.12.2.4. Fuel Cell Bus
10.12.3. Nordic Countries Bus Compressor Market Size Analysis & Forecast, by Application, 2017‒2031
10.12.3.1. Air Conditioning (AC)
10.12.3.2. Air Brakes
10.12.4. Nordic Countries Bus Compressor Market Size Analysis & Forecast, by Sales Channel, 2017‒2031
10.12.4.1. OEMs
10.12.4.2. Aftermarket
10.13. Russia & CIS Bus Compressor Market
10.13.1. Russia & CIS Bus Compressor Market Size Analysis & Forecast, by Compressor Type, 2017‒2031
10.13.1.1. Electric Compressor
10.13.1.2. Air Compressor
10.13.1.2.1. Rotary Screw Compressor
10.13.1.2.2. Reciprocating Air Compressor
10.13.1.2.3. Axial Compressor
10.13.1.2.4. Centrifugal Compressor
10.13.1.3. Mechanical Compressor
10.13.1.3.1. Swash Plate Compressor
10.13.1.3.2. Wobble Plate Compressor
10.13.1.3.3. Scroll Compressor
10.13.1.3.4. Others
10.13.2. Russia & CIS Bus Compressor Market Size Analysis & Forecast, by Bus Type, 2017‒2031
10.13.2.1. Diesel Bus
10.13.2.2. Gasoline Bus – Petrol/CNG
10.13.2.3. Electric Bus
10.13.2.3.1. Hybrid Electric Bus
10.13.2.3.2. Full Electric Bus
10.13.2.4. Fuel Cell Bus
10.13.3. Russia & CIS Bus Compressor Market Size Analysis & Forecast, by Application, 2017‒2031
10.13.3.1. Air Conditioning (AC)
10.13.3.2. Air Brakes
10.13.4. Russia & CIS Bus Compressor Market Size Analysis & Forecast, by Sales Channel, 2017‒2031
10.13.4.1. OEMs
10.13.4.2. Aftermarket
10.14. Rest of Europe Bus Compressor Market
10.14.1. Rest of Europe Bus Compressor Market Size Analysis & Forecast, by Compressor Type, 2017‒2031
10.14.1.1. Electric Compressor
10.14.1.2. Air Compressor
10.14.1.2.1. Rotary Screw Compressor
10.14.1.2.2. Reciprocating Air Compressor
10.14.1.2.3. Axial Compressor
10.14.1.2.4. Centrifugal Compressor
10.14.1.3. Mechanical Compressor
10.14.1.3.1. Swash Plate Compressor
10.14.1.3.2. Wobble Plate Compressor
10.14.1.3.3. Scroll Compressor
10.14.1.3.4. Others
10.14.2. Rest of Europe Bus Compressor Market Size Analysis & Forecast, by Bus Type, 2017‒2031
10.14.2.1. Diesel Bus
10.14.2.2. Gasoline Bus – Petrol/CNG
10.14.2.3. Electric Bus
10.14.2.3.1. Hybrid Electric Bus
10.14.2.3.2. Full Electric Bus
10.14.2.4. Fuel Cell Bus
10.14.3. Rest of Europe Bus Compressor Market Size Analysis & Forecast, by Application, 2017‒2031
10.14.3.1. Air Conditioning (AC)
10.14.3.2. Air Brakes
10.14.4. Rest of Europe Bus Compressor Market Size Analysis & Forecast, by Sales Channel, 2017‒2031
10.14.4.1. OEMs
10.14.4.2. Aftermarket
11. Asia Pacific Bus Compressor Market
11.1. Market Snapshot
11.2. Asia Pacific Bus Compressor Market Size Analysis & Forecast, by Compressor Type, 2017‒2031
11.2.1. Electric Compressor
11.2.2. Air Compressor
11.2.2.1. Rotary Screw Compressor
11.2.2.2. Reciprocating Air Compressor
11.2.2.3. Axial Compressor
11.2.2.4. Centrifugal Compressor
11.2.3. Mechanical Compressor
11.2.3.1. Swash Plate Compressor
11.2.3.2. Wobble Plate Compressor
11.2.3.3. Scroll Compressor
11.2.3.4. Others
11.3. Asia Pacific Bus Compressor Market Size Analysis & Forecast, by Bus Type, 2017‒2031
11.3.1. Diesel Bus
11.3.2. Gasoline Bus – Petrol/CNG
11.3.3. Electric Bus
11.3.3.1. Hybrid Electric Bus
11.3.3.2. Full Electric Bus
11.3.4. Fuel Cell Bus
11.4. Asia Pacific Bus Compressor Market Size Analysis & Forecast, by Application, 2017‒2031
11.4.1. Air Conditioning (AC)
11.4.2. Air Brakes
11.5. Asia Pacific Bus Compressor Market Size Analysis & Forecast, by Sales Channel, 2017‒2031
11.5.1. OEMs
11.5.2. Aftermarket
11.6. Key Country Analysis – Asia Pacific Bus Compressor Market Size Analysis & Forecast, 2017‒2031
11.6.1. China
11.6.2. India
11.6.3. Japan
11.6.4. ASEAN Countries
11.6.5. South Korea
11.6.6. ANZ
11.6.7. Rest of Asia Pacific
11.7. China Bus Compressor Market
11.7.1. China Bus Compressor Market Size Analysis & Forecast, by Compressor Type, 2017‒2031
11.7.1.1. Electric Compressor
11.7.1.2. Air Compressor
11.7.1.2.1. Rotary Screw Compressor
11.7.1.2.2. Reciprocating Air Compressor
11.7.1.2.3. Axial Compressor
11.7.1.2.4. Centrifugal Compressor
11.7.1.3. Mechanical Compressor
11.7.1.3.1. Swash Plate Compressor
11.7.1.3.2. Wobble Plate Compressor
11.7.1.3.3. Scroll Compressor
11.7.1.3.4. Others
11.7.2. China Bus Compressor Market Size Analysis & Forecast, by Bus Type, 2017‒2031
11.7.2.1. Diesel Bus
11.7.2.2. Gasoline Bus – Petrol/CNG
11.7.2.3. Electric Bus
11.7.2.3.1. Hybrid Electric Bus
11.7.2.3.2. Full Electric Bus
11.7.2.4. Fuel Cell Bus
11.7.3. China Bus Compressor Market Size Analysis & Forecast, by Application, 2017‒2031
11.7.3.1. Air Conditioning (AC)
11.7.3.2. Air Brakes
11.7.4. China Bus Compressor Market Size Analysis & Forecast, by Sales Channel, 2017‒2031
11.7.4.1. OEMs
11.7.4.2. Aftermarket
11.8. India Bus Compressor Market
11.8.1. India Bus Compressor Market Size Analysis & Forecast, by Compressor Type, 2017‒2031
11.8.1.1. Electric Compressor
11.8.1.2. Air Compressor
11.8.1.2.1. Rotary Screw Compressor
11.8.1.2.2. Reciprocating Air Compressor
11.8.1.2.3. Axial Compressor
11.8.1.2.4. Centrifugal Compressor
11.8.1.3. Mechanical Compressor
11.8.1.3.1. Swash Plate Compressor
11.8.1.3.2. Wobble Plate Compressor
11.8.1.3.3. Scroll Compressor
11.8.1.3.4. Others
11.8.2. India Bus Compressor Market Size Analysis & Forecast, by Bus Type, 2017‒2031
11.8.2.1. Diesel Bus
11.8.2.2. Gasoline Bus – Petrol/CNG
11.8.2.3. Electric Bus
11.8.2.3.1. Hybrid Electric Bus
11.8.2.3.2. Full Electric Bus
11.8.2.4. Fuel Cell Bus
11.8.3. India Bus Compressor Market Size Analysis & Forecast, by Application, 2017‒2031
11.8.3.1. Air Conditioning (AC)
11.8.3.2. Air Brakes
11.8.4. India Bus Compressor Market Size Analysis & Forecast, by Sales Channel, 2017‒2031
11.8.4.1. OEMs
11.8.4.2. Aftermarket
11.9. Japan Bus Compressor Market
11.9.1. Japan Bus Compressor Market Size Analysis & Forecast, by Compressor Type, 2017‒2031
11.9.1.1. Electric Compressor
11.9.1.2. Air Compressor
11.9.1.2.1. Rotary Screw Compressor
11.9.1.2.2. Reciprocating Air Compressor
11.9.1.2.3. Axial Compressor
11.9.1.2.4. Centrifugal Compressor
11.9.1.3. Mechanical Compressor
11.9.1.3.1. Swash Plate Compressor
11.9.1.3.2. Wobble Plate Compressor
11.9.1.3.3. Scroll Compressor
11.9.1.3.4. Others
11.9.2. Japan Bus Compressor Market Size Analysis & Forecast, by Bus Type, 2017‒2031
11.9.2.1. Diesel Bus
11.9.2.2. Gasoline Bus – Petrol/CNG
11.9.2.3. Electric Bus
11.9.2.3.1. Hybrid Electric Bus
11.9.2.3.2. Full Electric Bus
11.9.2.4. Fuel Cell Bus
11.9.3. Japan Bus Compressor Market Size Analysis & Forecast, by Application, 2017‒2031
11.9.3.1. Air Conditioning (AC)
11.9.3.2. Air Brakes
11.9.4. Japan Bus Compressor Market Size Analysis & Forecast, by Sales Channel, 2017‒2031
11.9.4.1. OEMs
11.9.4.2. Aftermarket
11.10. ASEAN Bus Compressor Market
11.10.1. ASEAN Bus Compressor Market Size Analysis & Forecast, by Compressor Type, 2017‒2031
11.10.1.1. Electric Compressor
11.10.1.2. Air Compressor
11.10.1.2.1. Rotary Screw Compressor
11.10.1.2.2. Reciprocating Air Compressor
11.10.1.2.3. Axial Compressor
11.10.1.2.4. Centrifugal Compressor
11.10.1.3. Mechanical Compressor
11.10.1.3.1. Swash Plate Compressor
11.10.1.3.2. Wobble Plate Compressor
11.10.1.3.3. Scroll Compressor
11.10.1.3.4. Others
11.10.2. ASEAN Bus Compressor Market Size Analysis & Forecast, by Bus Type, 2017‒2031
11.10.2.1. Diesel Bus
11.10.2.2. Gasoline Bus – Petrol/CNG
11.10.2.3. Electric Bus
11.10.2.3.1. Hybrid Electric Bus
11.10.2.3.2. Full Electric Bus
11.10.2.4. Fuel Cell Bus
11.10.3. ASEAN Bus Compressor Market Size Analysis & Forecast, by Application, 2017‒2031
11.10.3.1. Air Conditioning (AC)
11.10.3.2. Air Brakes
11.10.4. ASEAN Bus Compressor Market Size Analysis & Forecast, by Sales Channel, 2017‒2031
11.10.4.1. OEMs
11.10.4.2. Aftermarket
11.11. ANZ Bus Compressor Market
11.11.1. ANZ Bus Compressor Market Size Analysis & Forecast, by Compressor Type, 2017‒2031
11.11.1.1. Electric Compressor
11.11.1.2. Air Compressor
11.11.1.2.1. Rotary Screw Compressor
11.11.1.2.2. Reciprocating Air Compressor
11.11.1.2.3. Axial Compressor
11.11.1.2.4. Centrifugal Compressor
11.11.1.3. Mechanical Compressor
11.11.1.3.1. Swash Plate Compressor
11.11.1.3.2. Wobble Plate Compressor
11.11.1.3.3. Scroll Compressor
11.11.1.3.4. Others
11.11.2. ANZ Bus Compressor Market Size Analysis & Forecast, by Bus Type, 2017‒2031
11.11.2.1. Diesel Bus
11.11.2.2. Gasoline Bus – Petrol/CNG
11.11.2.3. Electric Bus
11.11.2.3.1. Hybrid Electric Bus
11.11.2.3.2. Full Electric Bus
11.11.2.4. Fuel Cell Bus
11.11.3. ANZ Bus Compressor Market Size Analysis & Forecast, by Application, 2017‒2031
11.11.3.1. Air Conditioning (AC)
11.11.3.2. Air Brakes
11.11.4. ANZ Bus Compressor Market Size Analysis & Forecast, by Sales Channel, 2017‒2031
11.11.4.1. OEMs
11.11.4.2. Aftermarket
11.12. South Korea Bus Compressor Market
11.12.1. South Korea Bus Compressor Market Size Analysis & Forecast, by Compressor Type, 2017‒2031
11.12.1.1. Electric Compressor
11.12.1.2. Air Compressor
11.12.1.2.1. Rotary Screw Compressor
11.12.1.2.2. Reciprocating Air Compressor
11.12.1.2.3. Axial Compressor
11.12.1.2.4. Centrifugal Compressor
11.12.1.3. Mechanical Compressor
11.12.1.3.1. Swash Plate Compressor
11.12.1.3.2. Wobble Plate Compressor
11.12.1.3.3. Scroll Compressor
11.12.1.3.4. Others
11.12.2. South Korea Bus Compressor Market Size Analysis & Forecast, by Bus Type, 2017‒2031
11.12.2.1. Diesel Bus
11.12.2.2. Gasoline Bus – Petrol/CNG
11.12.2.3. Electric Bus
11.12.2.3.1. Hybrid Electric Bus
11.12.2.3.2. Full Electric Bus
11.12.2.4. Fuel Cell Bus
11.12.3. South Korea Bus Compressor Market Size Analysis & Forecast, by Application, 2017‒2031
11.12.3.1. Air Conditioning (AC)
11.12.3.2. Air Brakes
11.12.4. South Korea Bus Compressor Market Size Analysis & Forecast, by Sales Channel, 2017‒2031
11.12.4.1. OEMs
11.12.4.2. Aftermarket
11.13. Rest of Asia Pacific Bus Compressor Market
11.13.1. Rest of Asia Pacific Bus Compressor Market Size Analysis & Forecast, by Compressor Type, 2017‒2031
11.13.1.1. Electric Compressor
11.13.1.2. Air Compressor
11.13.1.2.1. Rotary Screw Compressor
11.13.1.2.2. Reciprocating Air Compressor
11.13.1.2.3. Axial Compressor
11.13.1.2.4. Centrifugal Compressor
11.13.1.3. Mechanical Compressor
11.13.1.3.1. Swash Plate Compressor
11.13.1.3.2. Wobble Plate Compressor
11.13.1.3.3. Scroll Compressor
11.13.1.3.4. Others
11.13.2. Rest of Asia Pacific Bus Compressor Market Size Analysis & Forecast, by Bus Type, 2017‒2031
11.13.2.1. Diesel Bus
11.13.2.2. Gasoline Bus – Petrol/CNG
11.13.2.3. Electric Bus
11.13.2.3.1. Hybrid Electric Bus
11.13.2.3.2. Full Electric Bus
11.13.2.4. Fuel Cell Bus
11.13.3. Rest of Asia Pacific Bus Compressor Market Size Analysis & Forecast, by Application, 2017‒2031
11.13.3.1. Air Conditioning (AC)
11.13.3.2. Air Brakes
11.13.4. Rest of Asia Pacific Bus Compressor Market Size Analysis & Forecast, by Sales Channel, 2017‒2031
11.13.4.1. OEMs
11.13.4.2. Aftermarket
12. Middle East & Africa Bus Compressor Market
12.1. Market Snapshot
12.2. Middle East & Africa Bus Compressor Market Size Analysis & Forecast, by Compressor Type, 2017‒2031
12.2.1. Electric Compressor
12.2.2. Air Compressor
12.2.2.1. Rotary Screw Compressor
12.2.2.2. Reciprocating Air Compressor
12.2.2.3. Axial Compressor
12.2.2.4. Centrifugal Compressor
12.2.3. Mechanical Compressor
12.2.3.1. Swash Plate Compressor
12.2.3.2. Wobble Plate Compressor
12.2.3.3. Scroll Compressor
12.2.3.4. Others
12.3. Middle East & Africa Bus Compressor Market Size Analysis & Forecast, by Bus Type, 2017‒2031
12.3.1. Diesel Bus
12.3.2. Gasoline Bus – Petrol/CNG
12.3.3. Electric Bus
12.3.3.1. Hybrid Electric Bus
12.3.3.2. Full Electric Bus
12.3.4. Fuel Cell Bus
12.4. Middle East & Africa Bus Compressor Market Size Analysis & Forecast, by Application, 2017‒2031
12.4.1. Air Conditioning (AC)
12.4.2. Air Brakes
12.5. Middle East & Africa Bus Compressor Market Size Analysis & Forecast, by Sales Channel, 2017‒2031
12.5.1. OEMs
12.5.2. Aftermarket
12.6. Key Country Analysis – Middle East & Africa Bus Compressor Market Size Analysis & Forecast, 2017‒2031
12.6.1. GCC
12.6.2. South Africa
12.6.3. Turkey
12.6.4. Rest of Middle East & Africa
12.7. GCC Bus Compressor Market
12.7.1. GCC Bus Compressor Market Size Analysis & Forecast, by Compressor Type, 2017‒2031
12.7.1.1. Electric Compressor
12.7.1.2. Air Compressor
12.7.1.2.1. Rotary Screw Compressor
12.7.1.2.2. Reciprocating Air Compressor
12.7.1.2.3. Axial Compressor
12.7.1.2.4. Centrifugal Compressor
12.7.1.3. Mechanical Compressor
12.7.1.3.1. Swash Plate Compressor
12.7.1.3.2. Wobble Plate Compressor
12.7.1.3.3. Scroll Compressor
12.7.1.3.4. Others
12.7.2. GCC Bus Compressor Market Size Analysis & Forecast, by Bus Type, 2017‒2031
12.7.2.1. Diesel Bus
12.7.2.2. Gasoline Bus – Petrol/CNG
12.7.2.3. Electric Bus
12.7.2.3.1. Hybrid Electric Bus
12.7.2.3.2. Full Electric Bus
12.7.2.4. Fuel Cell Bus
12.7.3. GCC Bus Compressor Market Size Analysis & Forecast, by Application, 2017‒2031
12.7.3.1. Air Conditioning (AC)
12.7.3.2. Air Brakes
12.7.4. GCC Bus Compressor Market Size Analysis & Forecast, by Sales Channel, 2017‒2031
12.7.4.1. OEMs
12.7.4.2. Aftermarket
12.8. South Africa Bus Compressor Market
12.8.1. South Africa Bus Compressor Market Size Analysis & Forecast, by Compressor Type, 2017‒2031
12.8.1.1. Electric Compressor
12.8.1.2. Air Compressor
12.8.1.2.1. Rotary Screw Compressor
12.8.1.2.2. Reciprocating Air Compressor
12.8.1.2.3. Axial Compressor
12.8.1.2.4. Centrifugal Compressor
12.8.1.3. Mechanical Compressor
12.8.1.3.1. Swash Plate Compressor
12.8.1.3.2. Wobble Plate Compressor
12.8.1.3.3. Scroll Compressor
12.8.1.3.4. Others
12.8.2. South Africa Bus Compressor Market Size Analysis & Forecast, by Bus Type, 2017‒2031
12.8.2.1. Diesel Bus
12.8.2.2. Gasoline Bus – Petrol/CNG
12.8.2.3. Electric Bus
12.8.2.3.1. Hybrid Electric Bus
12.8.2.3.2. Full Electric Bus
12.8.2.4. Fuel Cell Bus
12.8.3. South Africa Bus Compressor Market Size Analysis & Forecast, by Application, 2017‒2031
12.8.3.1. Air Conditioning (AC)
12.8.3.2. Air Brakes
12.8.4. South Africa Bus Compressor Market Size Analysis & Forecast, by Sales Channel, 2017‒2031
12.8.4.1. OEMs
12.8.4.2. Aftermarket
12.9. Turkey Bus Compressor Market
12.9.1. Turkey Bus Compressor Market Size Analysis & Forecast, by Compressor Type, 2017‒2031
12.9.1.1. Electric Compressor
12.9.1.2. Air Compressor
12.9.1.2.1. Rotary Screw Compressor
12.9.1.2.2. Reciprocating Air Compressor
12.9.1.2.3. Axial Compressor
12.9.1.2.4. Centrifugal Compressor
12.9.1.3. Mechanical Compressor
12.9.1.3.1. Swash Plate Compressor
12.9.1.3.2. Wobble Plate Compressor
12.9.1.3.3. Scroll Compressor
12.9.1.3.4. Others
12.9.2. Turkey Bus Compressor Market Size Analysis & Forecast, by Bus Type, 2017‒2031
12.9.2.1. Diesel Bus
12.9.2.2. Gasoline Bus – Petrol/CNG
12.9.2.3. Electric Bus
12.9.2.3.1. Hybrid Electric Bus
12.9.2.3.2. Full Electric Bus
12.9.2.4. Fuel Cell Bus
12.9.3. Turkey Bus Compressor Market Size Analysis & Forecast, by Application, 2017‒2031
12.9.3.1. Air Conditioning (AC)
12.9.3.2. Air Brakes
12.9.4. Turkey Bus Compressor Market Size Analysis & Forecast, by Sales Channel, 2017‒2031
12.9.4.1. OEMs
12.9.4.2. Aftermarket
12.10. Rest of Middle East & Africa Bus Compressor Market
12.10.1. Rest of Middle East & Africa Bus Compressor Market Size Analysis & Forecast, by Compressor Type, 2017‒2031
12.10.1.1. Electric Compressor
12.10.1.2. Air Compressor
12.10.1.2.1. Rotary Screw Compressor
12.10.1.2.2. Reciprocating Air Compressor
12.10.1.2.3. Axial Compressor
12.10.1.2.4. Centrifugal Compressor
12.10.1.3. Mechanical Compressor
12.10.1.3.1. Swash Plate Compressor
12.10.1.3.2. Wobble Plate Compressor
12.10.1.3.3. Scroll Compressor
12.10.1.3.4. Others
12.10.2. Rest of Middle East & Africa Bus Compressor Market Size Analysis & Forecast, by Bus Type, 2017‒2031
12.10.2.1. Diesel Bus
12.10.2.2. Gasoline Bus – Petrol/CNG
12.10.2.3. Electric Bus
12.10.2.3.1. Hybrid Electric Bus
12.10.2.3.2. Full Electric Bus
12.10.2.4. Fuel Cell Bus
12.10.3. Rest of Middle East & Africa Bus Compressor Market Size Analysis & Forecast, by Application, 2017‒2031
12.10.3.1. Air Conditioning (AC)
12.10.3.2. Air Brakes
12.10.4. Rest of Middle East & Africa Bus Compressor Market Size Analysis & Forecast, by Sales Channel, 2017‒2031
12.10.4.1. OEMs
12.10.4.2. Aftermarket
13. Latin America Bus Compressor Market
13.1. Market Snapshot
13.2. Latin America Bus Compressor Market Size Analysis & Forecast, by Compressor Type, 2017‒2031
13.2.1. Electric Compressor
13.2.2. Air Compressor
13.2.2.1. Rotary Screw Compressor
13.2.2.2. Reciprocating Air Compressor
13.2.2.3. Axial Compressor
13.2.2.4. Centrifugal Compressor
13.2.3. Mechanical Compressor
13.2.3.1. Swash Plate Compressor
13.2.3.2. Wobble Plate Compressor
13.2.3.3. Scroll Compressor
13.2.3.4. Others
13.3. Latin America Bus Compressor Market Size Analysis & Forecast, by Bus Type, 2017‒2031
13.3.1. Diesel Bus
13.3.2. Gasoline Bus – Petrol/CNG
13.3.3. Electric Bus
13.3.3.1. Hybrid Electric Bus
13.3.3.2. Full Electric Bus
13.3.4. Fuel Cell Bus
13.4. Latin America Bus Compressor Market Size Analysis & Forecast, by Application, 2017‒2031
13.4.1. Air Conditioning (AC)
13.4.2. Air Brakes
13.5. Latin America Bus Compressor Market Size Analysis & Forecast, by Sales Channel, 2017‒2031
13.5.1. OEMs
13.5.2. Aftermarket
13.6. Key Country Analysis – Latin America Bus Compressor Market Size Analysis & Forecast, 2017‒2031
13.6.1. Brazil
13.6.2. Mexico
13.6.3. Argentina
13.6.4. Rest of Latin America
13.7. Brazil Bus Compressor Market
13.7.1. Brazil Bus Compressor Market Size Analysis & Forecast, by Compressor Type, 2017‒2031
13.7.1.1. Electric Compressor
13.7.1.2. Air Compressor
13.7.1.2.1. Rotary Screw Compressor
13.7.1.2.2. Reciprocating Air Compressor
13.7.1.2.3. Axial Compressor
13.7.1.2.4. Centrifugal Compressor
13.7.1.3. Mechanical Compressor
13.7.1.3.1. Swash Plate Compressor
13.7.1.3.2. Wobble Plate Compressor
13.7.1.3.3. Scroll Compressor
13.7.1.3.4. Others
13.7.2. Brazil Bus Compressor Market Size Analysis & Forecast, by Bus Type, 2017‒2031
13.7.2.1. Diesel Bus
13.7.2.2. Gasoline Bus – Petrol/CNG
13.7.2.3. Electric Bus
13.7.2.3.1. Hybrid Electric Bus
13.7.2.3.2. Full Electric Bus
13.7.2.4. Fuel Cell Bus
13.7.3. Brazil Bus Compressor Market Size Analysis & Forecast, by Application, 2017‒2031
13.7.3.1. Air Conditioning (AC)
13.7.3.2. Air Brakes
13.7.4. Brazil Bus Compressor Market Size Analysis & Forecast, by Sales Channel, 2017‒2031
13.7.4.1. OEMs
13.7.4.2. Aftermarket
13.8. Mexico Bus Compressor Market
13.8.1. Mexico Bus Compressor Market Size Analysis & Forecast, by Compressor Type, 2017‒2031
13.8.1.1. Electric Compressor
13.8.1.2. Air Compressor
13.8.1.2.1. Rotary Screw Compressor
13.8.1.2.2. Reciprocating Air Compressor
13.8.1.2.3. Axial Compressor
13.8.1.2.4. Centrifugal Compressor
13.8.1.3. Mechanical Compressor
13.8.1.3.1. Swash Plate Compressor
13.8.1.3.2. Wobble Plate Compressor
13.8.1.3.3. Scroll Compressor
13.8.1.3.4. Others
13.8.2. Mexico Bus Compressor Market Size Analysis & Forecast, by Bus Type, 2017‒2031
13.8.2.1. Diesel Bus
13.8.2.2. Gasoline Bus – Petrol/CNG
13.8.2.3. Electric Bus
13.8.2.3.1. Hybrid Electric Bus
13.8.2.3.2. Full Electric Bus
13.8.2.4. Fuel Cell Bus
13.8.3. Mexico Bus Compressor Market Size Analysis & Forecast, by Application, 2017‒2031
13.8.3.1. Air Conditioning (AC)
13.8.3.2. Air Brakes
13.8.4. Mexico Bus Compressor Market Size Analysis & Forecast, by Sales Channel, 2017‒2031
13.8.4.1. OEMs
13.8.4.2. Aftermarket
13.9. Argentina Bus Compressor Market
13.9.1. Argentina Bus Compressor Market Size Analysis & Forecast, by Compressor Type, 2017‒2031
13.9.1.1. Electric Compressor
13.9.1.2. Air Compressor
13.9.1.2.1. Rotary Screw Compressor
13.9.1.2.2. Reciprocating Air Compressor
13.9.1.2.3. Axial Compressor
13.9.1.2.4. Centrifugal Compressor
13.9.1.3. Mechanical Compressor
13.9.1.3.1. Swash Plate Compressor
13.9.1.3.2. Wobble Plate Compressor
13.9.1.3.3. Scroll Compressor
13.9.1.3.4. Others
13.9.2. Argentina Bus Compressor Market Size Analysis & Forecast, by Bus Type, 2017‒2031
13.9.2.1. Diesel Bus
13.9.2.2. Gasoline Bus – Petrol/CNG
13.9.2.3. Electric Bus
13.9.2.3.1. Hybrid Electric Bus
13.9.2.3.2. Full Electric Bus
13.9.2.4. Fuel Cell Bus
13.9.3. Argentina Bus Compressor Market Size Analysis & Forecast, by Application, 2017‒2031
13.9.3.1. Air Conditioning (AC)
13.9.3.2. Air Brakes
13.9.4. Argentina Bus Compressor Market Size Analysis & Forecast, by Sales Channel, 2017‒2031
13.9.4.1. OEMs
13.9.4.2. Aftermarket
13.10. Rest of Latin America Bus Compressor Market
13.10.1. Rest of Latin America Bus Compressor Market Size Analysis & Forecast, by Compressor Type, 2017‒2031
13.10.1.1. Electric Compressor
13.10.1.2. Air Compressor
13.10.1.2.1. Rotary Screw Compressor
13.10.1.2.2. Reciprocating Air Compressor
13.10.1.2.3. Axial Compressor
13.10.1.3.Centrifugal Compressor
13.10.1.4. Mechanical Compressor
13.10.1.4.1. Swash Plate Compressor
13.10.1.4.2. Wobble Plate Compressor
13.10.1.4.3. Scroll Compressor
13.10.1.4.4. Others
13.10.2. Rest of Latin America Bus Compressor Market Size Analysis & Forecast, by Bus Type, 2017‒2031
13.10.2.1. Diesel Bus
13.10.2.2. Gasoline Bus – Petrol/CNG
13.10.2.3. Electric Bus
13.10.2.3.1. Hybrid Electric Bus
13.10.2.3.2. Full Electric Bus
13.10.2.4. Fuel Cell Bus
13.10.3. Rest of Latin America Bus Compressor Market Size Analysis & Forecast, by Application, 2017‒2031
13.10.3.1. Air Conditioning (AC)
13.10.3.2. Air Brakes
13.10.4. Rest of Latin America Bus Compressor Market Size Analysis & Forecast, by Sales Channel, 2017‒2031
13.10.4.1. OEMs
13.10.4.2. Aftermarket
14. Competitive Landscape
14.1. Company Share Analysis/ Brand Share Analysis, 2020
14.2. Pricing comparison among key players
14.3. Company Analysis for each player (Company Overview, Company Footprints, Production Locations, Product Portfolio, Competitors & Customers, Subsidiaries & Parent Organization, Recent Developments, Financial Analysis, Profitability, Revenue Share)
15. Company Profile/ Key Players
15.1.1. BorgWarner Inc.
15.1.1.1. Company Overview
15.1.1.2. Company Footprints
15.1.1.3. Production Locations
15.1.1.4. Product Portfolio
15.1.1.5. Competitors & Customers
15.1.1.6. Subsidiaries & Parent Organization
15.1.1.7. Recent Developments
15.1.1.8. Financial Analysis
15.1.1.9. Profitability
15.1.1.10. Revenue Share
15.1.2. Denso Corporation
15.1.2.1. Company Overview
15.1.2.2. Company Footprints
15.1.2.3. Production Locations
15.1.2.4. Product Portfolio
15.1.2.5. Competitors & Customers
15.1.2.6. Subsidiaries & Parent Organization
15.1.2.7. Recent Developments
15.1.2.8. Financial Analysis
15.1.2.9. Profitability
15.1.2.10. Revenue Share
15.1.3. Hanon Systems
15.1.3.1. Company Overview
15.1.3.2. Company Footprints
15.1.3.3. Production Locations
15.1.3.4. Product Portfolio
15.1.3.5. Competitors & Customers
15.1.3.6. Subsidiaries & Parent Organization
15.1.3.7. Recent Developments
15.1.3.8. Financial Analysis
15.1.3.9. Profitability
15.1.3.10. Revenue Share
15.1.4. HELLA GmbH & Co. KGaA
15.1.4.1. Company Overview
15.1.4.2. Company Footprints
15.1.4.3. Production Locations
15.1.4.4. Product Portfolio
15.1.4.5. Competitors & Customers
15.1.4.6. Subsidiaries & Parent Organization
15.1.4.7. Recent Developments
15.1.4.8. Financial Analysis
15.1.4.9. Profitability
15.1.4.10. Revenue Share
15.1.5. Hitachi Industrial Equipment Systems Co.
15.1.5.1. Company Overview
15.1.5.2. Company Footprints
15.1.5.3. Production Locations
15.1.5.4. Product Portfolio
15.1.5.5. Competitors & Customers
15.1.5.6. Subsidiaries & Parent Organization
15.1.5.7. Recent Developments
15.1.5.8. Financial Analysis
15.1.5.9. Profitability
15.1.5.10. Revenue Share
15.1.6. Marelli Holdings Co., Ltd.
15.1.6.1. Company Overview
15.1.6.2. Company Footprints
15.1.6.3. Production Locations
15.1.6.4. Product Portfolio
15.1.6.5. Competitors & Customers
15.1.6.6. Subsidiaries & Parent Organization
15.1.6.7. Recent Developments
15.1.6.8. Financial Analysis
15.1.6.9. Profitability
15.1.6.10. Revenue Share
15.1.7. MAHLE GmbH
15.1.7.1. Company Overview
15.1.7.2. Company Footprints
15.1.7.3. Production Locations
15.1.7.4. Product Portfolio
15.1.7.5. Competitors & Customers
15.1.7.6. Subsidiaries & Parent Organization
15.1.7.7. Recent Developments
15.1.7.8. Financial Analysis
15.1.7.9. Profitability
15.1.7.10. Revenue Share
15.1.8. MITSUBISHI HEAVY INDUSTRIES, LTD.
15.1.8.1. Company Overview
15.1.8.2. Company Footprints
15.1.8.3. Production Locations
15.1.8.4. Product Portfolio
15.1.8.5. Competitors & Customers
15.1.8.6. Subsidiaries & Parent Organization
15.1.8.7. Recent Developments
15.1.8.8. Financial Analysis
15.1.8.9. Profitability
15.1.8.10. Revenue Share
15.1.9. Rheinmetall AG
15.1.9.1. Company Overview
15.1.9.2. Company Footprints
15.1.9.3. Production Locations
15.1.9.4. Product Portfolio
15.1.9.5. Competitors & Customers
15.1.9.6. Subsidiaries & Parent Organization
15.1.9.7. Recent Developments
15.1.9.8. Financial Analysis
15.1.9.9. Profitability
15.1.9.10. Revenue Share
15.1.10. SANDEN HOLDINGS CORPORATION
15.1.10.1. Company Overview
15.1.10.2. Company Footprints
15.1.10.3. Production Locations
15.1.10.4. Product Portfolio
15.1.10.5. Competitors & Customers
15.1.10.6. Subsidiaries & Parent Organization
15.1.10.7. Recent Developments
15.1.10.8. Financial Analysis
15.1.10.9. Profitability
15.1.10.10. Revenue Share
15.1.11. Subros Limited.
15.1.11.1. Company Overview
15.1.11.2. Company Footprints
15.1.11.3. Production Locations
15.1.11.4. Product Portfolio
15.1.11.5. Competitors & Customers
15.1.11.6. Subsidiaries & Parent Organization
15.1.11.7. Recent Developments
15.1.11.8. Financial Analysis
15.1.11.9. Profitability
15.1.11.10. Revenue Share
15.1.12. T/CCI Manufacturing
15.1.12.1. Company Overview
15.1.12.2. Company Footprints
15.1.12.3. Production Locations
15.1.12.4. Product Portfolio
15.1.12.5. Competitors & Customers
15.1.12.6. Subsidiaries & Parent Organization
15.1.12.7. Recent Developments
15.1.12.8. Financial Analysis
15.1.12.9. Profitability
15.1.12.10. Revenue Share
15.1.13. TOYOTA INDUSTRIES CORPORATION
15.1.13.1. Company Overview
15.1.13.2. Company Footprints
15.1.13.3. Production Locations
15.1.13.4. Product Portfolio
15.1.13.5. Competitors & Customers
15.1.13.6. Subsidiaries & Parent Organization
15.1.13.7. Recent Developments
15.1.13.8. Financial Analysis
15.1.13.9. Profitability
15.1.13.10. Revenue Share
15.1.14. Valeo SA
15.1.14.1. Company Overview
15.1.14.2. Company Footprints
15.1.14.3. Production Locations
15.1.14.4. Product Portfolio
15.1.14.5. Competitors & Customers
15.1.14.6. Subsidiaries & Parent Organization
15.1.14.7. Recent Developments
15.1.14.8. Financial Analysis
15.1.14.9. Profitability
15.1.14.10. Revenue Share
15.1.15. Voith GmbH & Co. KGaA
15.1.15.1. Company Overview
15.1.15.2. Company Footprints
15.1.15.3. Production Locations
15.1.15.4. Product Portfolio
15.1.15.5. Competitors & Customers
15.1.15.6. Subsidiaries & Parent Organization
15.1.15.7. Recent Developments
15.1.15.8. Financial Analysis
15.1.15.9. Profitability
15.1.15.10. Revenue Share
15.1.16. Other Key Players
15.1.16.1. Company Overview
15.1.16.2. Company Footprints
15.1.16.3. Production Locations
15.1.16.4. Product Portfolio
15.1.16.5. Competitors & Customers
15.1.16.6. Subsidiaries & Parent Organization
15.1.16.7. Recent Developments
15.1.16.8. Financial Analysis
15.1.16.9. Profitability
15.1.16.10. Revenue Share
List Of Tables
Table 1: Global Bus Compressor Market Volume (Thousand Units) Forecast, by Compressor Type, 2017‒2031
Table 2: Global Bus Compressor Market Value (US$ Mn) Forecast, by Compressor Type, 2017‒2031
Table 3: Global Bus Compressor Market Volume (Thousand Units) Forecast, by Bus Type, 2017‒2031
Table 4: Global Bus Compressor Market Value (US$ Mn) Forecast, by Bus Type, 2017‒2031
Table 5: Global Bus Compressor Market Volume (Thousand Units) Forecast, by Application, 2017‒2031
Table 6: Global Bus Compressor Market Value (US$ Mn) Forecast, by Application, 2017‒2031
Table 7: Global Bus Compressor Market Volume (Thousand Units) Forecast, by Sales Channel, 2017‒2031
Table 8: Global Bus Compressor Market Value (US$ Mn) Forecast, by Sales Channel, 2017‒2031
Table 9: Global Bus Compressor Market Volume (Thousand Units) Forecast, by Region, 2017‒2031
Table 10: Global Bus Compressor Market Value (US$ Mn) Forecast, by Region, 2017‒2031
Table 11: North America Bus Compressor Market Volume (Thousand Units) Forecast, by Compressor Type, 2017‒2031
Table 12: North America Bus Compressor Market Value (US$ Mn) Forecast, by Compressor Type, 2017‒2031
Table 13: North America Bus Compressor Market Volume (Thousand Units) Forecast, by Bus Type, 2017‒2031
Table 14: North America Bus Compressor Market Value (US$ Mn) Forecast, by Bus Type, 2017‒2031
Table 15: North America Bus Compressor Market Volume (Thousand Units) Forecast, by Application, 2017‒2031
Table 16: North America Bus Compressor Market Value (US$ Mn) Forecast, by Application, 2017‒2031
Table 17: North America Bus Compressor Market Volume (Thousand Units) Forecast, by Sales Channel, 2017‒2031
Table 18: North America Bus Compressor Market Value (US$ Mn) Forecast, by Sales Channel, 2017‒2031
Table 19: North America Bus Compressor Market Volume (Thousand Units) Forecast, by Country, 2017‒2031
Table 20: North America Bus Compressor Market Value (US$ Mn) Forecast, by Country, 2017‒2031
Table 21: U.S. Bus Compressor Market Volume (Thousand Units) Forecast, by Compressor Type, 2017‒2031
Table 22: U.S. Bus Compressor Market Value (US$ Mn) Forecast, by Compressor Type, 2017‒2031
Table 23: U.S. Bus Compressor Market Volume (Thousand Units) Forecast, by Bus Type, 2017‒2031
Table 24: U.S. Bus Compressor Market Value (US$ Mn) Forecast, by Bus Type, 2017‒2031
Table 25: U.S. Bus Compressor Market Volume (Thousand Units) Forecast, by Application, 2017‒2031
Table 26: U.S. Bus Compressor Market Value (US$ Mn) Forecast, by Application, 2017‒2031
Table 27: U.S. Bus Compressor Market Volume (Thousand Units) Forecast, by Sales Channel, 2017‒2031
Table 28: U.S. Bus Compressor Market Value (US$ Mn) Forecast, by Sales Channel, 2017‒2031
Table 29: Canada Bus Compressor Market Volume (Thousand Units) Forecast, by Compressor Type, 2017‒2031
Table 30: Canada Bus Compressor Market Value (US$ Mn) Forecast, by Compressor Type, 2017‒2031
Table 31: Canada Bus Compressor Market Volume (Thousand Units) Forecast, by Bus Type, 2017‒2031
Table 32: Canada Bus Compressor Market Value (US$ Mn) Forecast, by Bus Type, 2017‒2031
Table 33: Canada Bus Compressor Market Volume (Thousand Units) Forecast, by Application, 2017‒2031
Table 34: Canada Bus Compressor Market Value (US$ Mn) Forecast, by Application, 2017‒2031
Table 35: Canada Bus Compressor Market Volume (Thousand Units) Forecast, by Sales Channel, 2017‒2031
Table 36: Canada Bus Compressor Market Value (US$ Mn) Forecast, by Sales Channel, 2017‒2031
Table 37: Europe Bus Compressor Market Volume (Thousand Units) Forecast, by Compressor Type, 2017‒2031
Table 38: Europe Bus Compressor Market Value (US$ Mn) Forecast, by Compressor Type, 2017‒2031
Table 39: Europe Bus Compressor Market Volume (Thousand Units) Forecast, by Bus Type, 2017‒2031
Table 40: Europe Bus Compressor Market Value (US$ Mn) Forecast, by Bus Type, 2017‒2031
Table 41: Europe Bus Compressor Market Volume (Thousand Units) Forecast, by Application, 2017‒2031
Table 42: Europe Bus Compressor Market Value (US$ Mn) Forecast, by Application, 2017‒2031
Table 43: Europe Bus Compressor Market Volume (Thousand Units) Forecast, by Sales Channel, 2017‒2031
Table 44: Europe Bus Compressor Market Value (US$ Mn) Forecast, by Sales Channel, 2017‒2031
Table 45: Europe Bus Compressor Market Volume (Thousand Units) Forecast, by Country & Sub-region, 2017‒2031
Table 46: Europe Bus Compressor Market Value (US$ Mn) Forecast, by Country & Sub-region, 2017‒2031
Table 47: Germany Bus Compressor Market Volume (Thousand Units) Forecast, by Compressor Type, 2017‒2031
Table 48: Germany Bus Compressor Market Value (US$ Mn) Forecast, by Compressor Type, 2017‒2031
Table 49: Germany Bus Compressor Market Volume (Thousand Units) Forecast, by Bus Type, 2017‒2031
Table 50: Germany Bus Compressor Market Value (US$ Mn) Forecast, by Bus Type, 2017‒2031
Table 51: Germany Bus Compressor Market Volume (Thousand Units) Forecast, by Application, 2017‒2031
Table 52: Germany Bus Compressor Market Value (US$ Mn) Forecast, by Application, 2017‒2031
Table 53: Germany Bus Compressor Market Volume (Thousand Units) Forecast, by Sales Channel, 2017‒2031
Table 54: Germany Bus Compressor Market Value (US$ Mn) Forecast, by Sales Channel, 2017‒2031
Table 55: U.K. Bus Compressor Market Volume (Thousand Units) Forecast, by Compressor Type, 2017‒2031
Table 56: U.K. Bus Compressor Market Value (US$ Mn) Forecast, by Compressor Type, 2017‒2031
Table 57: U.K. Bus Compressor Market Volume (Thousand Units) Forecast, by Bus Type, 2017‒2031
Table 58: U.K. Bus Compressor Market Value (US$ Mn) Forecast, by Bus Type, 2017‒2031
Table 59: U.K. Bus Compressor Market Volume (Thousand Units) Forecast, by Application, 2017‒2031
Table 60: U.K. Bus Compressor Market Value (US$ Mn) Forecast, by Application, 2017‒2031
Table 61: U.K. Bus Compressor Market Volume (Thousand Units) Forecast, by Sales Channel, 2017‒2031
Table 62: U.K. Bus Compressor Market Value (US$ Mn) Forecast, by Sales Channel, 2017‒2031
Table 63: France Bus Compressor Market Volume (Thousand Units) Forecast, by Compressor Type, 2017‒2031
Table 64: France Bus Compressor Market Value (US$ Mn) Forecast, by Compressor Type, 2017‒2031
Table 65: France Bus Compressor Market Volume (Thousand Units) Forecast, by Bus Type, 2017‒2031
Table 66: France Bus Compressor Market Value (US$ Mn) Forecast, by Bus Type, 2017‒2031
Table 67: France Bus Compressor Market Volume (Thousand Units) Forecast, by Application, 2017‒2031
Table 68: France Bus Compressor Market Value (US$ Mn) Forecast, by Application, 2017‒2031
Table 69: France Bus Compressor Market Volume (Thousand Units) Forecast, by Sales Channel, 2017‒2031
Table 70: France Bus Compressor Market Value (US$ Mn) Forecast, by Sales Channel, 2017‒2031
Table 71: Italy Bus Compressor Market Volume (Thousand Units) Forecast, by Compressor Type, 2017‒2031
Table 72: Italy Bus Compressor Market Value (US$ Mn) Forecast, by Compressor Type, 2017‒2031
Table 73: Italy Bus Compressor Market Volume (Thousand Units) Forecast, by Bus Type, 2017‒2031
Table 74: Italy Bus Compressor Market Value (US$ Mn) Forecast, by Bus Type, 2017‒2031
Table 75: Italy Bus Compressor Market Volume (Thousand Units) Forecast, by Application, 2017‒2031
Table 76: Italy Bus Compressor Market Value (US$ Mn) Forecast, by Application, 2017‒2031
Table 77: Italy Bus Compressor Market Volume (Thousand Units) Forecast, by Sales Channel, 2017‒2031
Table 78: Italy Bus Compressor Market Value (US$ Mn) Forecast, by Sales Channel, 2017‒2031
Table 79: Spain Bus Compressor Market Volume (Thousand Units) Forecast, by Compressor Type, 2017‒2031
Table 80: Spain Bus Compressor Market Value (US$ Mn) Forecast, by Compressor Type, 2017‒2031
Table 81: Spain Bus Compressor Market Volume (Thousand Units) Forecast, by Bus Type, 2017‒2031
Table 82: Spain Bus Compressor Market Value (US$ Mn) Forecast, by Bus Type, 2017‒2031
Table 83: Spain Bus Compressor Market Volume (Thousand Units) Forecast, by Application, 2017‒2031
Table 84: Spain Bus Compressor Market Value (US$ Mn) Forecast, by Application, 2017‒2031
Table 85: Spain Bus Compressor Market Volume (Thousand Units) Forecast, by Sales Channel, 2017‒2031
Table 86: Spain Bus Compressor Market Value (US$ Mn) Forecast, by Sales Channel, 2017‒2031
Table 87: Nordic Countries Bus Compressor Market Volume (Thousand Units) Forecast, by Compressor Type, 2017‒2031
Table 88: Nordic Countries Bus Compressor Market Value (US$ Mn) Forecast, by Compressor Type, 2017‒2031
Table 89: Nordic Countries Bus Compressor Market Volume (Thousand Units) Forecast, by Bus Type, 2017‒2031
Table 90: Nordic Countries Bus Compressor Market Value (US$ Mn) Forecast, by Bus Type, 2017‒2031
Table 91: Nordic Countries Bus Compressor Market Volume (Thousand Units) Forecast, by Application, 2017‒2031
Table 92: Nordic Countries Bus Compressor Market Value (US$ Mn) Forecast, by Application, 2017‒2031
Table 93: Nordic Countries Bus Compressor Market Volume (Thousand Units) Forecast, by Sales Channel, 2017‒2031
Table 94: Nordic Countries Bus Compressor Market Value (US$ Mn) Forecast, by Sales Channel, 2017‒2031
Table 95: Russia & CIS Bus Compressor Market Volume (Thousand Units) Forecast, by Compressor Type, 2017‒2031
Table 96: Russia & CIS Bus Compressor Market Value (US$ Mn) Forecast, by Compressor Type, 2017‒2031
Table 97: Russia & CIS Bus Compressor Market Volume (Thousand Units) Forecast, by Bus Type, 2017‒2031
Table 98: Russia & CIS Bus Compressor Market Value (US$ Mn) Forecast, by Bus Type, 2017‒2031
Table 99: Russia & CIS Bus Compressor Market Volume (Thousand Units) Forecast, by Application, 2017‒2031
Table 100: Russia & CIS Bus Compressor Market Value (US$ Mn) Forecast, by Application, 2017‒2031
Table 101: Russia & CIS Bus Compressor Market Volume (Thousand Units) Forecast, by Sales Channel, 2017‒2031
Table 102: Russia & CIS Bus Compressor Market Value (US$ Mn) Forecast, by Sales Channel, 2017‒2031
Table 103: Rest of Europe Bus Compressor Market Volume (Thousand Units) Forecast, by Compressor Type, 2017‒2031
Table 104: Rest of Europe Bus Compressor Market Value (US$ Mn) Forecast, by Compressor Type, 2017‒2031
Table 105: Rest of Europe Bus Compressor Market Volume (Thousand Units) Forecast, by Bus Type, 2017‒2031
Table 106: Rest of Europe Bus Compressor Market Value (US$ Mn) Forecast, by Bus Type, 2017‒2031
Table 107: Rest of Europe Bus Compressor Market Volume (Thousand Units) Forecast, by Application, 2017‒2031
Table 108: Rest of Europe Bus Compressor Market Value (US$ Mn) Forecast, by Application, 2017‒2031
Table 109: Rest of Europe Bus Compressor Market Volume (Thousand Units) Forecast, by Sales Channel, 2017‒2031
Table 110: Rest of Europe Bus Compressor Market Value (US$ Mn) Forecast, by Sales Channel, 2017‒2031
Table 111: Asia Pacific Bus Compressor Market Volume (Thousand Units) Forecast, by Compressor Type, 2017‒2031
Table 112: Asia Pacific Bus Compressor Market Value (US$ Mn) Forecast, by Compressor Type, 2017‒2031
Table 113: Asia Pacific Bus Compressor Market Volume (Thousand Units) Forecast, by Bus Type, 2017‒2031
Table 114: Asia Pacific Bus Compressor Market Value (US$ Mn) Forecast, by Bus Type, 2017‒2031
Table 115: Asia Pacific Bus Compressor Market Volume (Thousand Units) Forecast, by Application, 2017‒2031
Table 116: Asia Pacific Bus Compressor Market Value (US$ Mn) Forecast, by Application, 2017‒2031
Table 117: Asia Pacific Bus Compressor Market Volume (Thousand Units) Forecast, by Sales Channel, 2017‒2031
Table 118: Asia Pacific Bus Compressor Market Value (US$ Mn) Forecast, by Sales Channel, 2017‒2031
Table 119: Asia Pacific Bus Compressor Market Volume (Thousand Units) Forecast, by Country & Sub-region, 2017‒2031
Table 120: Asia Pacific Bus Compressor Market Value (US$ Mn) Forecast, by Country & Sub-region, 2017‒2031
Table 121: China Bus Compressor Market Volume (Thousand Units) Forecast, by Compressor Type, 2017‒2031
Table 122: China Bus Compressor Market Value (US$ Mn) Forecast, by Compressor Type, 2017‒2031
Table 123: China Bus Compressor Market Volume (Thousand Units) Forecast, by Bus Type, 2017‒2031
Table 124: China Bus Compressor Market Value (US$ Mn) Forecast, by Bus Type, 2017‒2031
Table 125: China Bus Compressor Market Volume (Thousand Units) Forecast, by Application, 2017‒2031
Table 126: China Bus Compressor Market Value (US$ Mn) Forecast, by Application, 2017‒2031
Table 127: China Bus Compressor Market Volume (Thousand Units) Forecast, by Sales Channel, 2017‒2031
Table 128: China Bus Compressor Market Value (US$ Mn) Forecast, by Sales Channel, 2017‒2031
Table 129: India Bus Compressor Market Volume (Thousand Units) Forecast, by Compressor Type, 2017‒2031
Table 130: India Bus Compressor Market Value (US$ Mn) Forecast, by Compressor Type, 2017‒2031
Table 131: India Bus Compressor Market Volume (Thousand Units) Forecast, by Bus Type, 2017‒2031
Table 132: India Bus Compressor Market Value (US$ Mn) Forecast, by Bus Type, 2017‒2031
Table 133: India Bus Compressor Market Volume (Thousand Units) Forecast, by Application, 2017‒2031
Table 134: India Bus Compressor Market Value (US$ Mn) Forecast, by Application, 2017‒2031
Table 135: India Bus Compressor Market Volume (Thousand Units) Forecast, by Sales Channel, 2017‒2031
Table 136: India Bus Compressor Market Value (US$ Mn) Forecast, by Sales Channel, 2017‒2031
Table 137: Japan Bus Compressor Market Volume (Thousand Units) Forecast, by Compressor Type, 2017‒2031
Table 138: Japan Bus Compressor Market Value (US$ Mn) Forecast, by Compressor Type, 2017‒2031
Table 139: Japan Bus Compressor Market Volume (Thousand Units) Forecast, by Bus Type, 2017‒2031
Table 140: Japan Bus Compressor Market Value (US$ Mn) Forecast, by Bus Type, 2017‒2031
Table 141: Japan Bus Compressor Market Volume (Thousand Units) Forecast, by Application, 2017‒2031
Table 142: Japan Bus Compressor Market Value (US$ Mn) Forecast, by Application, 2017‒2031
Table 143: Japan Bus Compressor Market Volume (Thousand Units) Forecast, by Sales Channel, 2017‒2031
Table 144: Japan Bus Compressor Market Value (US$ Mn) Forecast, by Sales Channel, 2017‒2031
Table 145: ASEAN Bus Compressor Market Volume (Thousand Units) Forecast, by Compressor Type, 2017‒2031
Table 146: ASEAN Bus Compressor Market Value (US$ Mn) Forecast, by Compressor Type, 2017‒2031
Table 147: ASEAN Bus Compressor Market Volume (Thousand Units) Forecast, by Bus Type, 2017‒2031
Table 148: ASEAN Bus Compressor Market Value (US$ Mn) Forecast, by Bus Type, 2017‒2031
Table 149: ASEAN Bus Compressor Market Volume (Thousand Units) Forecast, by Application, 2017‒2031
Table 150: ASEAN Bus Compressor Market Value (US$ Mn) Forecast, by Application, 2017‒2031
Table 151: ASEAN Bus Compressor Market Volume (Thousand Units) Forecast, by Sales Channel, 2017‒2031
Table 152: ASEAN Bus Compressor Market Value (US$ Mn) Forecast, by Sales Channel, 2017‒2031
Table 153: South Korea Bus Compressor Market Volume (Thousand Units) Forecast, by Compressor Type, 2017‒2031
Table 154: South Korea Bus Compressor Market Value (US$ Mn) Forecast, by Compressor Type, 2017‒2031
Table 155: South Korea Bus Compressor Market Volume (Thousand Units) Forecast, by Bus Type, 2017‒2031
Table 156: South Korea Bus Compressor Market Value (US$ Mn) Forecast, by Bus Type, 2017‒2031
Table 157: South Korea Bus Compressor Market Volume (Thousand Units) Forecast, by Application, 2017‒2031
Table 158: South Korea Bus Compressor Market Value (US$ Mn) Forecast, by Application, 2017‒2031
Table 159: South Korea Bus Compressor Market Volume (Thousand Units) Forecast, by Sales Channel, 2017‒2031
Table 160: South Korea Bus Compressor Market Value (US$ Mn) Forecast, by Sales Channel, 2017‒2031
Table 161: ANZ Bus Compressor Market Volume (Thousand Units) Forecast, by Compressor Type, 2017‒2031
Table 162: ANZ Bus Compressor Market Value (US$ Mn) Forecast, by Compressor Type, 2017‒2031
Table 163: ANZ Bus Compressor Market Volume (Thousand Units) Forecast, by Bus Type, 2017‒2031
Table 164: ANZ Bus Compressor Market Value (US$ Mn) Forecast, by Bus Type, 2017‒2031
Table 165: ANZ Bus Compressor Market Volume (Thousand Units) Forecast, by Application, 2017‒2031
Table 166: ANZ Bus Compressor Market Value (US$ Mn) Forecast, by Application, 2017‒2031
Table 167: ANZ Bus Compressor Market Volume (Thousand Units) Forecast, by Sales Channel, 2017‒2031
Table 168: ANZ Bus Compressor Market Value (US$ Mn) Forecast, by Sales Channel, 2017‒2031
Table 169: Rest of Asia Pacific Bus Compressor Market Volume (Thousand Units) Forecast, by Compressor Type, 2017‒2031
Table 170: Rest of Asia Pacific Bus Compressor Market Value (US$ Mn) Forecast, by Compressor Type, 2017‒2031
Table 171: Rest of Asia Pacific Bus Compressor Market Volume (Thousand Units) Forecast, by Bus Type, 2017‒2031
Table 172: Rest of Asia Pacific Bus Compressor Market Value (US$ Mn) Forecast, by Bus Type, 2017‒2031
Table 173: Rest of Asia Pacific Bus Compressor Market Volume (Thousand Units) Forecast, by Application, 2017‒2031
Table 174: Rest of Asia Pacific Bus Compressor Market Value (US$ Mn) Forecast, by Application, 2017‒2031
Table 175: Rest of Asia Pacific Bus Compressor Market Volume (Thousand Units) Forecast, by Sales Channel, 2017‒2031
Table 176: Rest of Asia Pacific Bus Compressor Market Value (US$ Mn) Forecast, by Sales Channel, 2017‒2031
Table 177: Middle East & Africa Bus Compressor Market Volume (Thousand Units) Forecast, by Compressor Type, 2017‒2031
Table 178: Middle East & Africa Bus Compressor Market Value (US$ Mn) Forecast, by Compressor Type, 2017‒2031
Table 179: Middle East & Africa Bus Compressor Market Volume (Thousand Units) Forecast, by Bus Type, 2017‒2031
Table 180: Middle East & Africa Bus Compressor Market Value (US$ Mn) Forecast, by Bus Type, 2017‒2031
Table 181: Middle East & Africa Bus Compressor Market Volume (Thousand Units) Forecast, by Application, 2017‒2031
Table 182: Middle East & Africa Bus Compressor Market Value (US$ Mn) Forecast, by Application, 2017‒2031
Table 183: Middle East & Africa Bus Compressor Market Volume (Thousand Units) Forecast, by Sales Channel, 2017‒2031
Table 184: Middle East & Africa Bus Compressor Market Value (US$ Mn) Forecast, by Sales Channel, 2017‒2031
Table 185: Middle East & Africa Bus Compressor Market Volume (Thousand Units) Forecast, by Country & Sub-region, 2017‒2031
Table 186: Middle East & Africa Bus Compressor Market Value (US$ Mn) Forecast, by Country & Sub-region, 2017‒2031
Table 187: GCC Bus Compressor Market Volume (Thousand Units) Forecast, by Compressor Type, 2017‒2031
Table 188: GCC Bus Compressor Market Value (US$ Mn) Forecast, by Compressor Type, 2017‒2031
Table 189: GCC Bus Compressor Market Volume (Thousand Units) Forecast, by Bus Type, 2017‒2031
Table 190: GCC Bus Compressor Market Value (US$ Mn) Forecast, by Bus Type, 2017‒2031
Table 191: GCC Bus Compressor Market Volume (Thousand Units) Forecast, by Application, 2017‒2031
Table 192: GCC Bus Compressor Market Value (US$ Mn) Forecast, by Application, 2017‒2031
Table 193: GCC Bus Compressor Market Volume (Thousand Units) Forecast, by Sales Channel, 2017‒2031
Table 194: GCC Bus Compressor Market Value (US$ Mn) Forecast, by Sales Channel, 2017‒2031
Table 195: South Africa Bus Compressor Market Volume (Thousand Units) Forecast, by Compressor Type, 2017‒2031
Table 196: South Africa Bus Compressor Market Value (US$ Mn) Forecast, by Compressor Type, 2017‒2031
Table 197: South Africa Bus Compressor Market Volume (Thousand Units) Forecast, by Bus Type, 2017‒2031
Table 198: South Africa Bus Compressor Market Value (US$ Mn) Forecast, by Bus Type, 2017‒2031
Table 199: South Africa Bus Compressor Market Volume (Thousand Units) Forecast, by Application, 2017‒2031
Table 200: South Africa Bus Compressor Market Value (US$ Mn) Forecast, by Application, 2017‒2031
Table 201: South Africa Bus Compressor Market Volume (Thousand Units) Forecast, by Sales Channel, 2017‒2031
Table 202: South Africa Bus Compressor Market Value (US$ Mn) Forecast, by Sales Channel, 2017‒2031
Table 203: Turkey Bus Compressor Market Volume (Thousand Units) Forecast, by Compressor Type, 2017‒2031
Table 204: Turkey Bus Compressor Market Value (US$ Mn) Forecast, by Compressor Type, 2017‒2031
Table 205: Turkey Bus Compressor Market Volume (Thousand Units) Forecast, by Bus Type, 2017‒2031
Table 206: Turkey Bus Compressor Market Value (US$ Mn) Forecast, by Bus Type, 2017‒2031
Table 207: Turkey Bus Compressor Market Volume (Thousand Units) Forecast, by Application, 2017‒2031
Table 208: Turkey Bus Compressor Market Value (US$ Mn) Forecast, by Application, 2017‒2031
Table 209: Turkey Bus Compressor Market Volume (Thousand Units) Forecast, by Sales Channel, 2017‒2031
Table 210: Turkey Bus Compressor Market Value (US$ Mn) Forecast, by Sales Channel, 2017‒2031
Table 211: Rest of Middle East & Africa Bus Compressor Market Volume (Thousand Units) Forecast, by Compressor Type, 2017‒2031
Table 212: Rest of Middle East & Africa Bus Compressor Market Value (US$ Mn) Forecast, by Compressor Type, 2017‒2031
Table 213: Rest of Middle East & Africa Bus Compressor Market Volume (Thousand Units) Forecast, by Bus Type, 2017‒2031
Table 214: Rest of Middle East & Africa Bus Compressor Market Value (US$ Mn) Forecast, by Bus Type, 2017‒2031
Table 215: Rest of Middle East & Africa Bus Compressor Market Volume (Thousand Units) Forecast, by Application, 2017‒2031
Table 216: Rest of Middle East & Africa Bus Compressor Market Value (US$ Mn) Forecast, by Application, 2017‒2031
Table 217: Rest of Middle East & Africa Bus Compressor Market Volume (Thousand Units) Forecast, by Sales Channel, 2017‒2031
Table 218: Rest of Middle East & Africa Bus Compressor Market Value (US$ Mn) Forecast, by Sales Channel, 2017‒2031
Table 219: Latin America Bus Compressor Market Volume (Thousand Units) Forecast, by Compressor Type, 2017‒2031
Table 220: Latin America Bus Compressor Market Value (US$ Mn) Forecast, by Compressor Type, 2017‒2031
Table 221: Latin America Bus Compressor Market Volume (Thousand Units) Forecast, by Bus Type, 2017‒2031
Table 222: Latin America Bus Compressor Market Value (US$ Mn) Forecast, by Bus Type, 2017‒2031
Table 223: Latin America Bus Compressor Market Volume (Thousand Units) Forecast, by Application, 2017‒2031
Table 224: Latin America Bus Compressor Market Value (US$ Mn) Forecast, by Application, 2017‒2031
Table 225: Latin America Bus Compressor Market Volume (Thousand Units) Forecast, by Sales Channel, 2017‒2031
Table 226: Latin America Bus Compressor Market Value (US$ Mn) Forecast, by Sales Channel, 2017‒2031
Table 227: Latin America Bus Compressor Market Volume (Thousand Units) Forecast, by Country & Sub-region, 2017‒2031
Table 228: Latin America Bus Compressor Market Value (US$ Mn) Forecast, by Country & Sub-region, 2017‒2031
Table 229: Brazil Bus Compressor Market Volume (Thousand Units) Forecast, by Compressor Type, 2017‒2031
Table 230: Brazil Bus Compressor Market Value (US$ Mn) Forecast, by Compressor Type, 2017‒2031
Table 231: Brazil Bus Compressor Market Volume (Thousand Units) Forecast, by Bus Type, 2017‒2031
Table 232: Brazil Bus Compressor Market Value (US$ Mn) Forecast, by Bus Type, 2017‒2031
Table 233: Brazil Bus Compressor Market Volume (Thousand Units) Forecast, by Application, 2017‒2031
Table 234: Brazil Bus Compressor Market Value (US$ Mn) Forecast, by Application, 2017‒2031
Table 235: Brazil Bus Compressor Market Volume (Thousand Units) Forecast, by Sales Channel, 2017‒2031
Table 236: Brazil Bus Compressor Market Value (US$ Mn) Forecast, by Sales Channel, 2017‒2031
Table 237: Mexico Bus Compressor Market Volume (Thousand Units) Forecast, by Compressor Type, 2017‒2031
Table 238: Mexico Bus Compressor Market Value (US$ Mn) Forecast, by Compressor Type, 2017‒2031
Table 239: Mexico Bus Compressor Market Volume (Thousand Units) Forecast, by Bus Type, 2017‒2031
Table 240: Mexico Bus Compressor Market Value (US$ Mn) Forecast, by Bus Type, 2017‒2031
Table 241: Mexico Bus Compressor Market Volume (Thousand Units) Forecast, by Application, 2017‒2031
Table 242: Mexico Bus Compressor Market Value (US$ Mn) Forecast, by Application, 2017‒2031
Table 243: Mexico Bus Compressor Market Volume (Thousand Units) Forecast, by Sales Channel, 2017‒2031
Table 244: Mexico Bus Compressor Market Value (US$ Mn) Forecast, by Sales Channel, 2017‒2031
Table 245: Argentina Bus Compressor Market Volume (Thousand Units) Forecast, by Compressor Type, 2017‒2031
Table 246: Argentina Bus Compressor Market Value (US$ Mn) Forecast, by Compressor Type, 2017‒2031
Table 247: Argentina Bus Compressor Market Volume (Thousand Units) Forecast, by Bus Type, 2017‒2031
Table 248: Argentina Bus Compressor Market Value (US$ Mn) Forecast, by Bus Type, 2017‒2031
Table 249: Argentina Bus Compressor Market Volume (Thousand Units) Forecast, by Application, 2017‒2031
Table 250: Argentina Bus Compressor Market Value (US$ Mn) Forecast, by Application, 2017‒2031
Table 251: Argentina Bus Compressor Market Volume (Thousand Units) Forecast, by Sales Channel, 2017‒2031
Table 252: Argentina Bus Compressor Market Value (US$ Mn) Forecast, by Sales Channel, 2017‒2031
Table 253: Rest of Latin America Bus Compressor Market Volume (Thousand Units) Forecast, by Compressor Type, 2017‒2031
Table 254: Rest of Latin America Bus Compressor Market Value (US$ Mn) Forecast, by Compressor Type, 2017‒2031
Table 255: Rest of Latin America Bus Compressor Market Volume (Thousand Units) Forecast, by Bus Type, 2017‒2031
Table 256: Rest of Latin America Bus Compressor Market Value (US$ Mn) Forecast, by Bus Type, 2017‒2031
Table 257: Rest of Latin America Bus Compressor Market Volume (Thousand Units) Forecast, by Application, 2017‒2031
Table 258: Rest of Latin America Bus Compressor Market Value (US$ Mn) Forecast, by Application, 2017‒2031
Table 259: Rest of Latin America Bus Compressor Market Volume (Thousand Units) Forecast, by Sales Channel, 2017‒2031
Table 260: Rest of Latin America Bus Compressor Market Value (US$ Mn) Forecast, by Sales Channel, 2017‒2031
List of Figures
Figure 1: Global Bus Compressor Market Volume (Thousand Units) Forecast, by Compressor Type, 2017‒2031
Figure 2: Global Bus Compressor Market Value (U$ Mn) Forecast, by Compressor Type, 2017‒2031
Figure 3: Global Bus Compressor Market, Incremental Opportunity, by Compressor Type, Value (US$ Mn), 2021‒2031
Figure 4: Global Bus Compressor Market Volume (Thousand Units) Forecast, by Bus Type, 2017‒2031
Figure 5: Global Bus Compressor Market Value (U$ Mn) Forecast, by Bus Type, 2017‒2031
Figure 6: Global Bus Compressor Market, Incremental Opportunity, by Bus Type, Value (US$ Mn), 2021‒2031
Figure 7: Global Bus Compressor Market Volume (Thousand Units) Forecast, by Application, 2017‒2031
Figure 8: Global Bus Compressor Market Value (U$ Mn) Forecast, by Application, 2017‒2031
Figure 9: Global Bus Compressor Market, Incremental Opportunity, by Application, Value (US$ Mn), 2021‒2031
Figure 10: Global Bus Compressor Market Volume (Thousand Units) Forecast, by Sales Channel, 2017‒2031
Figure 11: Global Bus Compressor Market Value (U$ Mn) Forecast, by Sales Channel, 2017‒2031
Figure 12: Global Bus Compressor Market, Incremental Opportunity, by Sales Channel, Value (US$ Mn), 2021‒2031
Figure 13: Global Bus Compressor Market Volume (Thousand Units) Forecast, by Region, 2017‒2031
Figure 14: Global Bus Compressor Market Value (U$ Mn) Forecast, by Region, 2017‒2031
Figure 15: Global Bus Compressor Market, Incremental Opportunity, by Region, Value (US$ Mn), 2021‒2031
Figure 16: North America Bus Compressor Market Volume (Thousand Units) Forecast, by Compressor Type, 2017‒2031
Figure 17: North America Bus Compressor Market Value (U$ Mn) Forecast, by Compressor Type, 2017‒2031
Figure 18: North America Bus Compressor Market, Incremental Opportunity, by Compressor Type, Value (US$ Mn), 2021‒2031
Figure 19: North America Bus Compressor Market Volume (Thousand Units) Forecast, by Bus Type, 2017‒2031
Figure 20: North America Bus Compressor Market Value (U$ Mn) Forecast, by Bus Type, 2017‒2031
Figure 21: North America Bus Compressor Market, Incremental Opportunity, by Bus Type, Value (US$ Mn), 2021‒2031
Figure 22: North America Bus Compressor Market Volume (Thousand Units) Forecast, by Application, 2017‒2031
Figure 23: North America Bus Compressor Market Value (U$ Mn) Forecast, by Application, 2017‒2031
Figure 24: North America Bus Compressor Market, Incremental Opportunity, by Application, Value (US$ Mn), 2021‒2031
Figure 25: North America Bus Compressor Market Volume (Thousand Units) Forecast, by Sales Channel, 2017‒2031
Figure 26: North America Bus Compressor Market Value (U$ Mn) Forecast, by Sales Channel, 2017‒2031
Figure 27: North America Bus Compressor Market, Incremental Opportunity, by Sales Channel, Value (US$ Mn), 2021‒2031
Figure 28: North America Bus Compressor Market Volume (Thousand Units) Forecast, by Country, 2017‒2031
Figure 29: North America Bus Compressor Market Value (U$ Mn) Forecast, by Country, 2017‒2031
Figure 30: North America Bus Compressor Market, Incremental Opportunity, by Country, Value (US$ Mn), 2021‒2031
Figure 31: U.S. Bus Compressor Market Size & Forecast, Revenue (US$ Mn), 2017‒2031
Figure 32: U.S. Bus Compressor Market Share 2020
Figure 33: Canada Bus Compressor Market Size & Forecast, Revenue (US$ Mn), 2017‒2031
Figure 34: Canada Bus Compressor Market Share 2020
Figure 35: Europe Bus Compressor Market Volume (Thousand Units) Forecast, by Compressor Type, 2017‒2031
Figure 36: Europe Bus Compressor Market Value (U$ Mn) Forecast, by Compressor Type, 2017‒2031
Figure 37: Europe Bus Compressor Market, Incremental Opportunity, by Compressor Type, Value (US$ Mn), 2021‒2031
Figure 38: Europe Bus Compressor Market Volume (Thousand Units) Forecast, by Bus Type, 2017‒2031
Figure 39: Europe Bus Compressor Market Value (U$ Mn) Forecast, by Bus Type, 2017‒2031
Figure 40: Europe Bus Compressor Market, Incremental Opportunity, by Bus Type, Value (US$ Mn), 2021‒2031
Figure 41: Europe Bus Compressor Market Volume (Thousand Units) Forecast, by Application, 2017‒2031
Figure 42: Europe Bus Compressor Market Value (U$ Mn) Forecast, by Application, 2017‒2031
Figure 43: Europe Bus Compressor Market, Incremental Opportunity, by Application, Value (US$ Mn), 2021‒2031
Figure 44: Europe Bus Compressor Market Volume (Thousand Units) Forecast, by Sales Channel, 2017‒2031
Figure 45: Europe Bus Compressor Market Value (U$ Mn) Forecast, by Sales Channel, 2017‒2031
Figure 46: Europe Bus Compressor Market, Incremental Opportunity, by Sales Channel, Value (US$ Mn), 2021‒2031
Figure 47: Europe Bus Compressor Market Volume (Thousand Units) Forecast, by Country & Sub-region, 2017‒2031
Figure 48: Europe Bus Compressor Market Value (U$ Mn) Forecast, by Country & Sub-region, 2017‒2031
Figure 49: Europe Bus Compressor Market, Incremental Opportunity, by Country & Sub-region, Value (US$ Mn), 2021‒2031
Figure 50: Germany Bus Compressor Market Size & Forecast, Revenue (US$ Mn), 2017‒2031
Figure 51: Germany Bus Compressor Market Share 2020
Figure 52: U.K. Bus Compressor Market Size & Forecast, Revenue (US$ Mn), 2017‒2031
Figure 53: U.K. Bus Compressor Market Share 2020
Figure 54: France Bus Compressor Market Size & Forecast, Revenue (US$ Mn), 2017‒2031
Figure 55: France Bus Compressor Market Share 2020
Figure 56: Italy Bus Compressor Market Size & Forecast, Revenue (US$ Mn), 2017‒2031
Figure 57: Italy Bus Compressor Market Share 2020
Figure 58: Spain Bus Compressor Market Size & Forecast, Revenue (US$ Mn), 2017‒2031
Figure 59: Spain Bus Compressor Market Share 2020
Figure 60: Nordic Countries Bus Compressor Market Size & Forecast, Revenue (US$ Mn), 2017‒2031
Figure 61: Nordic Countries Bus Compressor Market Share 2020
Figure 62: Russia & CIS Bus Compressor Market Size & Forecast, Revenue (US$ Mn), 2017‒2031
Figure 63: Russia & CIS Bus Compressor Market Share 2020
Figure 64: Rest of Europe Bus Compressor Market Size & Forecast, Revenue (US$ Mn), 2017‒2031
Figure 65: Rest of Europe Bus Compressor Market Share 2020
Figure 66: Asia Pacific Bus Compressor Market Volume (Thousand Units) Forecast, by Compressor Type, 2017‒2031
Figure 67: Asia Pacific Bus Compressor Market Value (U$ Mn) Forecast, by Compressor Type, 2017‒2031
Figure 68: Asia Pacific Bus Compressor Market, Incremental Opportunity, by Compressor Type, Value (US$ Mn), 2021‒2031
Figure 69: Asia Pacific Bus Compressor Market Volume (Thousand Units) Forecast, by Bus Type, 2017‒2031
Figure 70: Asia Pacific Bus Compressor Market Value (U$ Mn) Forecast, by Bus Type, 2017‒2031
Figure 71: Asia Pacific Bus Compressor Market, Incremental Opportunity, by Bus Type, Value (US$ Mn), 2021‒2031
Figure 72: Asia Pacific Bus Compressor Market Volume (Thousand Units) Forecast, by Application, 2017‒2031
Figure 73: Asia Pacific Bus Compressor Market Value (U$ Mn) Forecast, by Application, 2017‒2031
Figure 74: Asia Pacific Bus Compressor Market, Incremental Opportunity, by Application, Value (US$ Mn), 2021‒2031
Figure 75: Asia Pacific Bus Compressor Market Volume (Thousand Units) Forecast, by Sales Channel, 2017‒2031
Figure 76: Asia Pacific Bus Compressor Market Value (U$ Mn) Forecast, by Sales Channel, 2017‒2031
Figure 77: Asia Pacific Bus Compressor Market, Incremental Opportunity, by Sales Channel, Value (US$ Mn), 2021‒2031
Figure 78: Asia Pacific Bus Compressor Market Volume (Thousand Units) Forecast, by Country & Sub-region, 2017‒2031
Figure 79: Asia Pacific Bus Compressor Market Value (U$ Mn) Forecast, by Country & Sub-region, 2017‒2031
Figure 80: Asia Pacific Bus Compressor Market, Incremental Opportunity, by Country & Sub-region, Value (US$ Mn), 2021‒2031
Figure 81: China Bus Compressor Market Value (US$ Mn) Forecast, 2017‒2031
Figure 82: China Bus Compressor Market Share 2020
Figure 83: India Bus Compressor Market Value (US$ Mn) Forecast, 2017‒2031
Figure 84: India Bus Compressor Market Share 2020
Figure 85: Japan Bus Compressor Market Value (US$ Mn) Forecast, 2017‒2031
Figure 86: Japan Bus Compressor Market Share 2020
Figure 87: ASEAN Bus Compressor Market Value (US$ Mn) Forecast, 2017‒2031
Figure 88: ASEAN Bus Compressor Market Share 2020
Figure 89: South Korea Bus Compressor Market Value (US$ Mn) Forecast, 2017‒2031
Figure 90: South Korea Bus Compressor Market Share 2020
Figure 91: ANZ Bus Compressor Market Value (US$ Mn) Forecast, 2017‒2031
Figure 92: ANZ Bus Compressor Market Share 2020
Figure 93: Rest of Asia Pacific Bus Compressor Market Value (US$ Mn) Forecast, 2017‒2031
Figure 94: Rest of Asia Pacific Bus Compressor Market Share 2020
Figure 95: Middle East & Africa Bus Compressor Market, Incremental Opportunity, by Compressor Type, Value (US$ Mn), 2021‒2031
Figure 96: Middle East & Africa Bus Compressor Market Volume (Thousand Units) Forecast, by Bus Type, 2017‒2031
Figure 97: Middle East & Africa Bus Compressor Market Value (U$ Mn) Forecast, by Bus Type, 2017‒2031
Figure 98: Middle East & Africa Bus Compressor Market, Incremental Opportunity, by Bus Type, Value (US$ Mn), 2021‒2031
Figure 99: Middle East & Africa Bus Compressor Market Volume (Thousand Units) Forecast, by Application, 2017‒2031
Figure 100: Middle East & Africa Bus Compressor Market Value (U$ Mn) Forecast, by Application, 2017‒2031
Figure 101: Middle East & Africa Bus Compressor Market, Incremental Opportunity, by Application, Value (US$ Mn), 2021‒2031
Figure 102: Middle East & Africa Bus Compressor Market Volume (Thousand Units) Forecast, by Sales Channel, 2017‒2031
Figure 103: Middle East & Africa Bus Compressor Market Value (U$ Mn) Forecast, by Sales Channel, 2017‒2031
Figure 104: Middle East & Africa Bus Compressor Market, Incremental Opportunity, by Sales Channel, Value (US$ Mn), 2021‒2031
Figure 105: Middle East & Africa Bus Compressor Market Volume (Thousand Units) Forecast, by Country & Sub-region, 2017‒2031
Figure 106: Middle East & Africa Bus Compressor Market Value (U$ Mn) Forecast, by Country & Sub-region, 2017‒2031
Figure 107: Middle East & Africa Bus Compressor Market, Incremental Opportunity, by Country & Sub-region, Value (US$ Mn), 2021‒2031
Figure 108: GCC Bus Compressor Market Value (US$ Mn) Forecast, 2017‒2031
Figure 109: GCC Bus Compressor Market Share 2020
Figure 110: South Africa Bus Compressor Market Value (US$ Mn) Forecast, 2017‒2031
Figure 111: South Africa Bus Compressor Market Share 2020
Figure 112: Turkey Bus Compressor Market Value (US$ Mn) Forecast, 2017‒2031
Figure 113: Turkey Bus Compressor Market Share 2020
Figure 114: Rest of Middle East & Africa Bus Compressor Market Value (US$ Mn) Forecast, 2017‒2031
Figure 115: Rest of Middle East & Africa Bus Compressor Market Share 2020
Figure 116: Latin America Bus Compressor Market, Incremental Opportunity, by Compressor Type, Value (US$ Mn), 2021‒2031
Figure 117: Latin America Bus Compressor Market Volume (Thousand Units) Forecast, by Bus Type, 2017‒2031
Figure 118: Latin America Bus Compressor Market Value (U$ Mn) Forecast, by Bus Type, 2017‒2031
Figure 119: Latin America Bus Compressor Market, Incremental Opportunity, by Bus Type, Value (US$ Mn), 2021‒2031
Figure 120: Latin America Bus Compressor Market Volume (Thousand Units) Forecast, by Application, 2017‒2031
Figure 121: Latin America Bus Compressor Market Value (U$ Mn) Forecast, by Application, 2017‒2031
Figure 122: Latin America Bus Compressor Market, Incremental Opportunity, by Application, Value (US$ Mn), 2021‒2031
Figure 123: Latin America Bus Compressor Market Volume (Thousand Units) Forecast, by Sales Channel, 2017‒2031
Figure 124: Latin America Bus Compressor Market Value (U$ Mn) Forecast, by Sales Channel, 2017‒2031
Figure 125: Latin America Bus Compressor Market, Incremental Opportunity, by Sales Channel, Value (US$ Mn), 2021‒2031
Figure 126: Latin America Bus Compressor Market Volume (Thousand Units) Forecast, by Country & Sub-region, 2017‒2031
Figure 127: Latin America Bus Compressor Market Value (U$ Mn) Forecast, by Country & Sub-region, 2017‒2031
Figure 128: Latin America Bus Compressor Market, Incremental Opportunity, by Country & Sub-region, Value (US$ Mn), 2021‒2031
Figure 129: Brazil Bus Compressor Market Value (US$ Mn) Forecast, 2017‒2031
Figure 130: Brazil Bus Compressor Market Share 2020
Figure 131: Mexico Bus Compressor Market Value (US$ Mn) Forecast, 2017‒2031
Figure 132: Mexico Bus Compressor Market Share 2020
Figure 133: Argentina Bus Compressor Market Value (US$ Mn) Forecast, 2017‒2031
Figure 134: Argentina Bus Compressor Market Share 2020
Figure 135: Rest of Latin America Bus Compressor Market Value (US$ Mn) Forecast, 2017‒2031
Figure 136: Rest of Latin America Bus Compressor Market Share 2020
Copyright © Transparency Market Research, Inc. All Rights reserved
Trust Online

Bus Compressor Market