
Reports
Reports
Brazil Flavored and Functional Water Market: Snapshot
The growing focus on health and wellness among consumers across Brazil has elevated the demand for clean, flavored, and hygienic drinking water. This, in turn, has resulted in a significant rise in the per capita consumption of flavored and functional water in the country. The Brazil flavored and functional water market is projected to exhibit a strong growth rate over the coming years, thanks to the increasing demand for convenient, healthy, and energizing beverages.
Dietary and lifestyle changes have led to an alarming rise in the rate of obesity and diabetes in Brazil. According to a study published by the country’s Ministry of Health, Brazil has the third largest overweight population in the world. The International Diabetes Federation states that Brazil is likely to exhibit the fourth highest increase in the prevalence of diabetes between 2012 and 2030. These factors are driving consumers to choose healthier dietary alternatives, with flavored and functional water on the list.
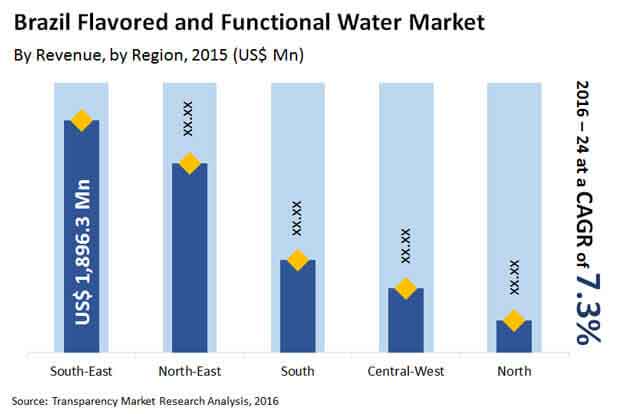
The opportunity in the Brazil flavored and functional water market is expected to rise at a 7.3% CAGR from 2016 to 2024. In 2015, the market was valued at US$5.0 bn and is expected to reach US$9.4 bn by 2024.
Non-carbonated Beverages Preferred over Carbonated Drinks
By ingredients, vitamins and minerals are expected to witness significant growth over the duration of the forecast period. This can be attributed to the rise in consumer awareness regarding the health benefits of vitamins and minerals and the growing consumption of vitamin-fortified beverages in Brazil. The segment is also projected to exhibit strong growth in terms of value as well as volume.
Based on nature, the Brazil flavored and functional water market is bifurcated into carbonated and non-carbonated drinks. The non-carbonated segment is expected to retain its dominance through 2024, fueled primarily by the shift in preference from synthetic ingredients and high-sugar beverages to healthy, zero-calorie drinks. “Growing health consciousness among consumers in the country is a key factor driving this segment,” the lead analyst reports.
Retail Stores Providing Increased Opportunity for Sales of Flavored and Functional Water
From a geographical standpoint, the Brazil flavored and functional water market is segmented into south east, north east, south, central west, and north. South-east Brazil is expected to hold a relatively high revenue share in the Brazil flavored and functional water market over the forecast period, accounting for a 38.2% share by 2024. Increasing population coupled with growing awareness regarding the benefits of flavored and functional water is expected to have a positive impact on the revenue growth of the south-east region. In terms of value, the north east will register a 7.8% CAGR through the course of the forecast period.
By distribution channel, the retail stores segment accounted for a share of over 35% in terms of revenue in 2015 and is expected to expand at a CAGR of 5.9% from 2016 to 2024. The rapid expansion of retail chains in Brazil has positively impacted the growth of this segment. Furthermore, factors such as convenient locations, one-stop shopping, grab-and-go services, variety of merchandises, and speedy transactions are expected to boost the retail stores segment of the Brazil flavored and functional water market.
Key players in the Brazil flavored and functional water market include Groupe Danone, The Coca Cola Company, PepsiCo Inc., Hint Water, Mountain Valley Spring Company, LLC, Suntory Beverage & Food Ltd, Grupo Vichy Catalan, Unicer - Bebidas SA, Icelandic Water Holdings ehf., CG Roxane, LLC, and Ambev.
Growing Popularity of Low-calorie Refreshments will Augment Flavored and Functional Water Market Growth-
The developing spotlight on wellbeing and health among purchasers across Brazil has raised the demand for clean, flavored, and sterile drinking water. This, thus, has brought about a huge ascent in the per capita utilization of flavored and functional water in the country. The Brazil flavored and functional water market is projected to display a solid development rate throughout the next few years, because of the expanding demand for advantageous, sound, and empowering drinks.
At present, the development of the Brazil flavored functional market has been fleeting. One of the key driving variables for the market development has been the expanding inclination of the clients towards better and low-calorie refreshments. What's more, disappearing revenue in the unhealthy sugar improved circulated air through drinks has additionally helped in the development of the market in the country. Moreover, there has been a developing mindfulness about the evil impacts of devouring fatty circulated air through drinks among individuals. It has additionally worked for the market advancement.
On the contrary, a few factors that may contrarily affect the improvement of the flavored functional water market in Brazil. One of the major limiting variables for the market development has been rigid bundling guidelines. Also, the monotonous interaction of reusing and arranging the bundles and holders separately has been hindering the market development. Despite this, Regardless, the developing demand for sound, advantageous, and empowering drinks combined with fortifying monetary state of the general population is assisting with inspiring the development of the flavored functional water market in the coming years.
At present, the development of the Brazil flavored functional market has been fleeting. One of the key driving variables for the market development has been the expanding inclination of the clients towards better and low-calorie refreshments. What's more, disappearing revenue in the unhealthy sugar improved circulated air through drinks has additionally helped in the development of the market in the country. Moreover, there has been a developing mindfulness about the evil impacts of devouring fatty circulated air through drinks among individuals. It has additionally worked for the market advancement.
1. Executive Summary
2. Market Introduction
2.1. Market Definition
2.2. Market Taxonomy
3. Brazil Flavored and Functional Water Market Analysis Scenario
3.1. Market Trends
3.2. Porter's Five Forces Analysis
3.3 Cost Analysis
3.4. Market Size (US$ Bn) and Forecast
3.4.1. Market Size and Y-o-Y Growth
3.4.2. Absolute $ Opportunity
3.5. Industry Supply Chain Analysis
4. Market Dynamics
4.1. Drivers
4.2. Restraints
4.3. Opportunity
4.4. Market Regulations
4.5. Packaging Overview
4.5.1. Metal Can
4.5.2. Glass Bottle
4.5.3. Paper & Cardboard
4.5.4. PET
4.6. Forecast Factors – Relevance and Impact
5. Brazil Flavored and Functional Water Market Analysis and Forecast, By Nature
5.1. Introduction
5.1.1. Basis Point Share (BPS) Analysis By Nature
5.1.2. Y-o-Y Growth Projections By Nature
5.2. Market Size and Forecast By Nature
5.2.1. Non-Carbonated Drinks
5.2.2. Carbonated Drinks
5.3. Market Attractiveness Analysis By Nature
5.4. Prominent Trends
6. Brazil Flavored and Functional Water Market Analysis and Forecast, By Ingredients
6.1. Introduction
6.1.1. Basis Point Share (BPS) Analysis By Ingredients
6.1.2. Y-o-Y Growth Projections By Ingredients
6.2. Market Size and Forecast By Ingredients
6.2.1. Vitamins and Minerals
6.2.2. Botanical Ingredients
6.2.3. Amino Acids
6.2.4. Other Active Ingredients (Proteins, Calcium etc.)
6.3. Market Attractiveness Analysis By Ingredients
6.4. Prominent Trends
7. Brazil Flavored and Functional Water Market Analysis and Forecast, By Distribution Channel
7.1. Introduction
7.1.1. Basis Point Share (BPS) Analysis By Distribution Channel
7.1.2. Y-o-Y Growth Projections By Distribution Channel
7.2. Market Size and Forecast By Distribution Channel
7.2.1. Hypermarket/Supermarket
7.2.2. Retail Stores
7.2.3. Departmental/Speciality Outlets
7.2.4. E-Commerce
7.3. Market Attractiveness Analysis By Distribution Channel
7.4. Prominent Trends
8. Brazil Flavored and Functional Water Market Analysis and Forecast, By Region
8.1. Introduction
8.1.1. Basis Point Share (BPS) Analysis By Region
8.1.2. Y-o-Y Growth Projections By Region
8.2. Market Size and Forecast By Region
8.2.1. South-East
8.2.2. North-East
8.2.3. South
8.2.4. Central West
8.2.5. North
8.3. Market Attractiveness Analysis By Region
8.4. Prominent Trends
9. Competitive Landscape
9.1. Competition Dashboard
9.2. Market Structure
9.3. Company Profiles
9.4. Global Players
9.4.1. Nestle Waters
9.4.1.1. Product Offerings
9.4.1.2. Financials
9.4.1.3. Key Developments
9.4.1.4. Strategic Overview
9.4.1.5. SWOT Analysis
9.4.2. Groupe Danone
9.4.2.1. Product Offerings
9.4.2.2. Financials
9.4.2.3. Key Developments
9.4.2.4. Strategic Overview
9.4.2.5. SWOT Analysis
9.4.3. PepsiCo Inc
9.4.3.1. Product Offerings
9.4.3.2. Financials
9.4.3.3. Key Developments
9.4.3.4. Strategic Overview
9.4.3.5. SWOT Analysis
9.4.4. The Coca Cola Company
9.4.4.1. Product Offerings
9.4.4.2. Financials
9.4.4.3. Key Developments
9.4.4.4. Strategic Overview
9.4.4.5. SWOT Analysis
9.4.5. Mountain Valley Spring Company, LLC.
9.4.5.1. Product Offerings
9.4.5.2. Financials
9.4.5.3. Key Developments
9.4.5.4. Strategic Overview
9.4.5.5. SWOT Analysis
9.4.6. Suntory Beverage & Food Ltd
9.4.6.1. Product Offerings
9.4.6.2. Financials
9.4.6.3. Key Developments
9.4.6.4. Strategic Overview
9.4.6.5. SWOT Analysis
9.4.7. Unicer - Bebidas SA
9.4.7.1. Product Offerings
9.4.7.2. Financials
9.4.7.3. Key Developments
9.4.7.4. Strategic Overview
9.4.7.5. SWOT Analysis
9.4.8. Grupo Vichy Catalan
9.4.8.1. Product Offerings
9.4.8.2. Financials
9.4.8.3. Key Developments
9.4.8.4. Strategic Overview
9.4.8.5. SWOT Analysis
9.4.9. Icelandic Water Holdings ehf.
9.4.9.1. Product Offerings
9.4.9.2. Financials
9.4.9.3. Key Developments
9.4.9.4. Strategic Overview
9.4.9.5. SWOT Analysis
9.4.10. CG Roxane, LLC
9.4.10.1. Product Offerings
9.4.10.2. Financials
9.4.10.3. Key Developments
9.4.10.4. Strategic Overview
9.4.10.5. SWOT Analysis
10 Local Players
10.1 Grupo Petrópolis
10.1.1. Company Overview
10.1.2. Product Offerings
10.1.3. SWOT Analysis
10.1.4. Key Strategies
10.2. Comexim Ltda.
10.2.1. Company Overview
10.2.2. Product Offerings
10.2.3. SWOT Analysis
10.2.4. Key Strategies
10.3. Agua Via Natural
10.3.1. Company Overview
10.3.2. Product Offerings
10.3.3. SWOT Analysis
10.3.4. Key Strategies
10.4. Eklo Water
10.4.1. Company Overview
10.4.2. Product Offerings
10.4.3. SWOT Analysis
10.4.4. Key Strategies
10.5. Amazon Spring Water S/A
10.5.1. Company Overview
10.5.2. Product Offerings
10.5.3. SWOT Analysis
10.5.4. Key Strategies
10.6. Brasil Kirin
10.6.1. Company Overview
10.6.2. Product Offerings
10.6.3. SWOT Analysis
10.6.4. Key Strategies
11. Assumptions and Acronyms Used
12. Research Methodology
List of Tables
Table 1: Brazil Flavored and Functional Water Market Value (US$ Bn) and Volume (Bn Ltrs) Forecast
Table 2: Brazil Flavored and Functional Water Market Value (US$ Bn) and Volume (Bn Ltrs) Forecast By Nature
Table 3: Brazil Flavored and Functional Water Market Value (US$ Bn) and Volume (Bn Ltrs) Forecast By Ingredient
Table 4: Brazil Flavored and Functional Water Market Value (US$ Bn) and Volume (Bn Ltrs) Forecast By Distribution Channel
Table 5: Brazil Flavored and Functional Water Market Value (US$ Bn) and Volume (Bn Ltrs) Forecast By Region
List of Figures
Figure 1: Brazil Flavored and Functional Water Market Value (US$ Bn) & Volume (Bn Ltrs) 2015-2024
Figure 2: Brazil Flavored and Functional Water Market Absolute $ Opportunity, 2015-2024
Figure 3: Brazil Flavored and Functional Water Market Y-o-Y Growth, By Nature, 2016–2024
Figure 4: Brazil Flavored and Functional Water Market Value Share and BPS Analysis, by Nature, 2016 & 2024
Figure 5: Brazil Flavored and Functional Water Market Value (US$ Bn) & Volume (Bn Ltrs), by Non-Carbonated Drinks Segment, 2015–2024
Figure 6: Brazil Flavored and Functional Water Market Absolute $ Opportunity, by Non-Carbonated Drinks Segment, 2015–2024
Figure 7: Brazil Flavored and Functional Water Market Value (US$ Bn) & Volume (Bn Ltrs), by Carbonated Drinks Segment, 2015–2024
Figure 8: Brazil Flavored and Functional Water Market Absolute $ Opportunity, by Carbonated Drinks Segment, 2015–2024
Figure 9: Brazil Flavored and Functional Water Market Attractiveness Analysis, by Nature, 2016–2024
Figure 10: Brazil Flavored and Functional Water Market Y-o-Y Growth, By Ingredient, 2016–2024
Figure 11: Brazil Flavored and Functional Water Market Value Share and BPS Analysis, by Ingredient, 2016 & 2024
Figure 12: Brazil Flavored and Functional Water Market Value (US$ Bn) & Volume (Bn Ltrs), by Vitamins and Minerals Segment, 2015–2024
Figure 13: Brazil Flavored and Functional Water Market Absolute $ Opportunity, by Vitamins and Minerals Segment, 2015–2024
Figure 14: Brazil Flavored and Functional Water Market Value (US$ Bn) & Volume (Bn Ltrs), by Botanical Ingredients Segment, 2015–2024
Figure 15: Brazil Flavored and Functional Water Market Absolute $ Opportunity, by Botanical Ingredients Segment, 2015–2024
Figure 16: Brazil Flavored and Functional Water Market Value (US$ Bn) & Volume (Bn Ltrs), by Amino Acids Segment, 2015–2024
Figure 17: Brazil Flavored and Functional Water Market Absolute $ Opportunity, by Amino Acids Segment, 2015–2024
Figure 18: Brazil Flavored and Functional Water Market Value (US$ Bn) & Volume (Bn Ltrs), by Other Active Ingredients Segment, 2015–2024
Figure 19: Brazil Flavored and Functional Water Market Absolute $ Opportunity, by Other Active Ingredients Segment, 2015–2024
Figure 20: Brazil Flavored and Functional Water Market Attractiveness Analysis, by Ingredient, 2016–2024
Figure 21: Brazil Flavored and Functional Water Market Y-o-Y Growth, By Distribution Channel, 2016–2024
Figure 22: Brazil Flavored and Functional Water Market Value Share and BPS Analysis, by Distribution Channel, 2016 & 2024
Figure 23: Brazil Flavored and Functional Water Market Value (US$ Bn) & Volume (Bn Ltrs), by Hypermarket/Supermarket Segment, 2015–2024
Figure 24: Brazil Flavored and Functional Water Market Absolute $ Opportunity, by Hypermarket/Supermarket Segment, 2015–2024
Figure 25: Brazil Flavored and Functional Water Market Value (US$ Bn) & Volume (Bn Ltrs), by Retail Store Segment, 2015–2024
Figure 26: Brazil Flavored and Functional Water Market Absolute $ Opportunity, by Retail Store Segment, 2015–2024
Figure 27: Brazil Flavored and Functional Water Market Value (US$ Bn) & Volume (Bn Ltrs), by Departmental/Speciality Outlet Segment, 2015–2024
Figure 28: Brazil Flavored and Functional Water Market Absolute $ Opportunity, by Departmental/Speciality Outlet Segment, 2015–2024
Figure 29: Brazil Flavored and Functional Water Market Value (US$ Bn) & Volume (Bn Ltrs), by e-Commerce Segment, 2015–2024
Figure 30: Brazil Flavored and Functional Water Market Absolute $ Opportunity, by e-Commerce Segment, 2015–2024
Figure 31: Brazil Flavored and Functional Water Market Attractiveness Analysis, by Distribution Channel, 2016–2024
Figure 32: Brazil Flavored and Functional Water Market Y-o-Y Growth, By Region, 2016–2024
Figure 33: Brazil Flavored and Functional Water Market Value Share and BPS Analysis, by Region, 2016 & 2024
Figure 34: South-East Brazil Flavored and Functional Water Market Value (US$ Bn) & Volume (Bn Ltrs), 2015–2024
Figure 35: South-east Brazil Flavored and Functional Water Market Absolute $ Opportunity, 2015–2024
Figure 36: North-East Brazil Flavored and Functional Water Market Value (US$ Bn) & Volume (Bn Ltrs), 2015–2024
Figure 37: North-East Brazil Flavored and Functional Water Market Absolute $ Opportunity, 2015–2024
Figure 38: South Brazil Flavored and Functional Water Market Value (US$ Bn) & Volume (Bn Ltrs), 2015–2024
Figure 39: South Brazil Flavored and Functional Water Market Absolute $ Opportunity, 2015–2024
Figure 40: Central West Brazil Flavored and Functional Water Market Value (US$ Bn) & Volume (Bn Ltrs), 2015–2024
Figure 41: Central West Brazil Flavored and Functional Water Market Absolute $ Opportunity, 2015–2024
Figure 42: North Brazil Flavored and Functional Water Market Value (US$ Bn) & Volume (Bn Ltrs), 2015–2024
Figure 43: North Brazil Flavored and Functional Water Market Absolute $ Opportunity, 2015–2024
Figure 44: Brazil Flavored and Functional Water Market Attractiveness Analysis, by Region, 2016–2024
Copyright © Transparency Market Research, Inc. All Rights reserved
Trust Online

Brazil Flavored and Functional Water Market