
Reports
Reports
Analysts’ Viewpoint on Bio-based Phenol Market Scenario
Rapid depletion of fossil fuels that are used in the manufacture of various products, including phenol, is leading to global energy crisis. Consequently, the cost of petroleum-based phenol is increasing. Petroleum-based phenol also negatively affects the environment. Therefore, companies need to focus on alternative feedstock for petroleum-derived products. Plant phenol, also called bio-based phenol, is produced from renewable lignocellulosic biomass including wood, straw, and grass. This is a key feedstock of second-generation biofuels. Manufacturers should tap into opportunities in lignin, which is a primary source of bio-based phenol, in order to broaden their revenue streams. Companies are increasingly making data-driven decisions before investing in new manufacturing technologies. They are investing in R&D of bio-based waste and residue oils to innovate in bio-based phenols.
Depletion of fossil resources and rise in environmental issues in the petroleum refining industry have been driving the search for a renewable resource to replace petroleum. Phenol is a crucial intermediate in the chemical industry. The cumene process, which accounts for nearly 20% of global demand for benzene, produces nearly all phenol from petroleum-derived benzene. Considering the drawbacks of high energy intensity and acetone coproduction, there is growing interest in replacing petroleum as a feedstock with renewable biomass.
As a clean and renewable energy resource, biomass has become a renewable and alternative source for the production of low sulfur and low nitrogen-containing fuels and chemicals in the last few decades. The pyrolysis of biomass produces bio-oil, which primarily consists of oxygenous compounds such as phenols, aldehydes, acids, ketones, and esters. The industrial production of bio-oil focuses on the production of valuable oxygenated chemicals such as phenols.
Increase in environmental pollution and depletion of fossil fuel are boosting the demand for bio-based chemical intermediates in various industries such as automotive & transportation, medical, and electrical. Petroleum is currently the main source of raw material for many chemical compounds such as olefins and aromatics. However, petroleum is a non-renewable natural resource. Its continuous usage as a source of bulk chemical for manufacturing is not sustainable in the long term. Replacement of petroleum-based products with inexpensive, bio-renewable, natural materials is important for sustainable development. This is expected to have a significant impact on the chemical industry and the environment.
Bio-refineries play a vital role in converting biomass into value-added products. Compounds of lignocellulosic biomass include lignin, cellulose, and hemicellulose, which are potential eco-friendly substitutes for phenol. Lignin has phenolic structure. Currently, it is extensively used in the production of bio-based phenolic resin. Lignocellulose has several key advantages. These include abundant availability and renewability. It is also freely available as a waste product of the food industry. Therefore, there is a need to shift the focus toward biomass as a renewable source of carbon-based reagents to produce bio-based chemicals.
Phenol is primarily produced through the ‘cumene process.’ The process typically includes three steps: production of cumene by the alkylation reaction of benzene with propene using acid catalysts, production of cumene hydroperoxide by the oxidation of cumene, and decomposition of cumene hydroperoxide to phenol in sulfuric acid. Apart from its multistep nature, the process has a low yield of phenol and produces a substantial amount of acetone as a byproduct. It has the potential to pollute the environment and poses a safety risk, as sulfuric acid is used in conjunction with the synthesis of explosive intermediates (such as cumene hydroperoxide) during the cumene process.
Other than fuels, industrial bio-oil production focuses on using phenol to make higher-value products such as renewable phenols. Some phenols, when separated and purified, can be used as valuable and useful chemical feedstock, while others can be employed as intermediates in the manufacture of medicinal goods, specialized polymers, adhesives, and food additives. Therefore, making phenol from bio-oils is a green method, which is driving the demand for bio-based phenol.
The usage of bio-based phenol is rising in lignin, which holds potential as a source of lignocellulosic biomass. Based on source, the global bio-based phenol market has been segmented into lignin, cellulose, hemicellulose, and others. The lignin segment accounted for 44.5% share of the market in 2021. It is expected to grow at a CAGR of 6.7% by 2031.
Lignin is the second most abundant and naturally synthesized compound from lignocellulosic biomass. It is a three-dimensional amorphous polymer consisting of methoxylated phenyl-propane structures. Lignin has been traditionally regarded as low-grade fuel or used as a low-value product; hence, it cannot be fully utilized. However, lignin can be a promising alternative source for high value-added chemicals due to its unique structure that is composed of phenyl-propane units. Lignin is recognized as a promising source of bio-aromatics, as it is accessible as a byproduct of the pulp and paper industry. Lignin's polyphenolic network is converted into useful aromatics such as BTX (benzene, toluene, and xylenes) and phenol. Therefore, lignin is a promising source of bio-based phenol.
In terms of value, Asia Pacific is expected to hold major share of the global bio-based phenol market, followed by North America and Europe, during the forecast period. This can be ascribed to the easy availability of raw materials at competitive prices in the region as well as rapid diversification of building and construction and automotive industries in China, India, Japan, and South Korea.
The bio-based renewable phenol market in North America and Europe is projected to grow at a rapid pace in the near future. Recent developments in the bio-based phenol market in these regions include increase in availability of certified bio-based phenols in accordance with the ISCC [International Sustainability and Carbon Certification] for plastic and chemical derivatives.
Current strategies for the production of bio-based phenol include the use of activated carbon as catalyst to convert oxygenated compounds generated from pyrolysis into high value and high purity phenols. Demand analysis of the bio-based phenol market is inclining toward carbon catalysts that can effectively catalyze lignocellulose biomass conversion into renewable phenols.
The global bio-based phenol market is anticipated to grow at a CAGR of 5.5% by 2031 owing to the numerous applications of bio-based phenol in various industries such as automotive, medical, and electrical. Thus, companies need to increase their R&D in renewable phenol, as it is a diverse class of chemical with industrial significance, unique structure, and high abundance.
Production of bio-based phenol is rising in key revenue generating industries such as agrochemicals, personal care, and cosmetics. Various types of bio-based phenol are gaining prominence in diverse applications such as solvents, dietary supplements, and cosmetic formulations. The usage of bio-based phenol is also increasing in bio-pesticides, resin production, and fuel additives.
The global bio-based phenol market is consolidated, with a small number of large-scale vendors controlling a majority of the share. Most of the firms are investing substantially in comprehensive research and development activities, primarily to introduce environment-friendly products. Diversification of product portfolios and mergers & acquisitions are prominent strategies adopted by key players. Leading producers of bio-based phenol across the globe include DSM Company, Borealis, Mitsui Chemicals, UPM Bio-chemicals, and Lanxess Deutschland GmbH.
Each of these players has been profiled in the bio-based phenol market report based on parameters such as company overview, financial overview, business strategies, product portfolio, business segments, and recent developments.
|
Attribute |
Detail |
|
Market Forecast Value in 2021 |
US$ 12.5 Bn |
|
Market Forecast Value in 2031 |
US$ 21.3 Bn |
|
Growth Rate (CAGR) |
5.5% |
|
Forecast Period |
2022–2031 |
|
Historical Data |
2020 |
|
Quantitative Units |
US$ Bn for Value & Kilo Tons for Volume |
|
Market Analysis |
It includes cross segment analysis at global as well as regional level. Furthermore, qualitative analysis includes drivers, restraints, opportunities, key trends, Porter’s Five Forces analysis, value chain analysis, and key trend analysis. |
|
Competition Landscape |
|
|
Format |
Electronic (PDF) + Excel |
|
Market Segmentation |
|
|
Regions Covered |
|
|
Countries Covered |
|
|
Companies Profiled |
|
|
Customization Scope |
Available upon request |
|
Pricing |
Available upon request |
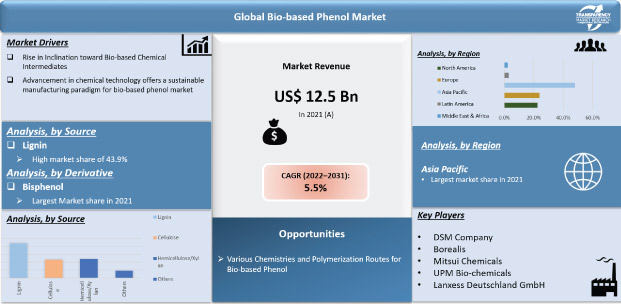
The market stood at US$ 12.5 Bn in 2021.
The market is expected to grow at a CAGR of 5.5% from 2022 to 2031.
Rise in inclination toward bio-based chemical intermediates and advancement in chemical technology are the key drivers of the market
Lignin was the largest source segment that held 43.9% share in 2021.
Asia Pacific was the most lucrative region of the bio-based phenol market in 2021.
DSM Company, Borealis, Mitsui Chemicals, UPM Bio-chemicals, and Lanxess Deutschland GmbH are the prominent players operating in the market.
1. Executive Summary
1.1. Bio-based Phenol Market Snapshot
1.2. Current Market and Future Potential
2. Market Overview
2.1. Market Segmentation
2.2. Market Trends
2.3. Market Dynamics
2.3.1. Drivers
2.3.2. Restraints
2.3.3. Opportunities
2.4. Porter’s Five Forces Analysis
2.5. Regulatory Analysis
2.6. Value Chain Analysis
2.6.1. List of Bio-based Phenol Manufacturers
2.6.2. List of Dealers/Distributors
2.6.3. List of Potential Customers
3. COVID-19 Impact Analysis
4. Global Bio-based Phenol Market Analysis and Forecast, by Derivative, 2022–2031
4.1. Introduction and Definitions
4.2. Global Bio-based Phenol Market Volume (Kilo Tons) and Value (US$ Bn) Forecast, by Derivative, 2022–2031
4.2.1. Phenol
4.2.1.1. Catechols
4.2.1.2. Cresols
4.2.1.3. Resorcinols
4.2.1.4. Eugenols
4.2.1.5. Syringols
4.2.1.6. Coniferols
4.2.1.7. Guaiacols
4.2.1.8. Others
4.2.2. Bisphenol
4.2.2.1. Bisphenol A
4.2.2.2. Bisphenol F
4.2.2.3. Others
4.3. Global Bio-based Phenol Market Attractiveness, by Derivative
5. Global Bio-based Phenol Market Analysis and Forecast, by Source, 2022–2031
5.1. Introduction and Definitions
5.2. Global Bio-based Phenol Market Volume (Kilo Tons) and Value (US$ Bn) Forecast, by Source, 2022–2031
5.2.1. Lignin
5.2.2. Cellulose
5.2.3. Hemicellulose
5.2.4. Others
5.3. Global Bio-based Phenol Market Attractiveness, by Source
6. Global Bio-based Phenol Market Analysis and Forecast, Application, 2022–2031
6.1. Introduction and Definitions
6.2. Global Bio-based Phenol Market Volume (Kilo Tons) and Value (US$ Bn) Forecast, by Application, 2022–2031
6.2.1. Solvent
6.2.2. Fuel Additives
6.2.3. Bio-pesticides and Insecticides
6.2.4. Dietary Supplements
6.2.5. Polyurethane Foams
6.2.6. Polymers and Resins Production
6.2.7. Cosmetics Formulation
6.2.8. Others
6.3. Global Bio-based Phenol Market Attractiveness, by Application
7. Global Bio-based Phenol Market Analysis and Forecast, End-use, 2022–2031
7.1. Introduction and Definitions
7.2. Global Bio-based Phenol Market Volume (Kilo Tons) and Value (US$ Bn) Forecast, by End-use, 2022–2031
7.2.1. Agrochemicals
7.2.2. Plastics
7.2.3. Automotive
7.2.4. Personal Care
7.2.5. Food and Beverage
7.2.6. Chemical and Petrochemical
7.2.7. Others
7.3. Global Bio-based Phenol Market Attractiveness, by End-use
8. Global Bio-based Phenol Market Analysis and Forecast, by Region, 2022–2031
8.1. Key Findings
8.2. Global Bio-based Phenol Market Volume (Kilo Tons) and Value (US$ Bn) Forecast, by Region, 2022–2031
8.2.1. North America
8.2.2. Europe
8.2.3. Asia Pacific
8.2.4. Latin America
8.2.5. Middle East & Africa
8.3. Global Bio-based Phenol Market Attractiveness, by Region
9. North America Bio-based Phenol Market Analysis and Forecast, 2022–2031
9.1. Key Findings
9.2. North America Bio-based Phenol Market Volume (Kilo Tons) and Value (US$ Bn) Forecast, by Derivative, 2022–2031
9.3. North America Bio-based Phenol Market Volume (Kilo Tons) and Value (US$ Bn) Forecast, by Source, 2022–2031
9.4. North America Bio-based Phenol Market Volume (Kilo Tons) and Value (US$ Bn) Forecast, by Application, 2022–2031
9.5. North America Bio-based Phenol Market Volume (Kilo Tons) and Value (US$ Bn) Forecast, by End-use, 2022–2031
9.6. North America Bio-based Phenol Market Volume (Kilo Tons) and Value (US$ Bn) Forecast, by Country, 2022–2031
9.6.1. U.S. Bio-based Phenol Market Volume (Kilo Tons) and Value (US$ Bn) Forecast, by Derivative, 2022–2031
9.6.2. U.S. Bio-based Phenol Market Volume (Kilo Tons) and Value (US$ Bn) Forecast, by Source, 2022–2031
9.6.3. U.S. Bio-based Phenol Market Volume (Kilo Tons) and Value (US$ Bn) Forecast, by Application, 2022–2031
9.6.4. U.S. Bio-based Phenol Market Volume (Kilo Tons) and Value (US$ Bn) Forecast, End-use, 2022–2031
9.6.5. Canada Bio-based Phenol Market Volume (Kilo Tons) and Value (US$ Bn) Forecast, by Derivative, 2022–2031
9.6.6. Canada Bio-based Phenol Market Volume (Kilo Tons) and Value (US$ Bn) Forecast, by Source, 2022–2031
9.6.7. Canada Bio-based Phenol Market Volume (Kilo Tons) and Value (US$ Bn) Forecast, by Application, 2022–2031
9.6.8. Canada Bio-based Phenol Market Volume (Kilo Tons) and Value (US$ Bn) Forecast, End-use, 2022–2031
9.7. North America Bio-based Phenol Market Attractiveness Analysis
10. Europe Bio-based Phenol Market Analysis and Forecast, 2022–2031
10.1. Key Findings
10.2. Europe Bio-based Phenol Market Volume (Kilo Tons) and Value (US$ Bn) Forecast, by Derivative, 2022–2031
10.3. Europe Bio-based Phenol Market Volume (Kilo Tons) and Value (US$ Bn) Forecast, by Source, 2022–2031
10.4. Europe Bio-based Phenol Market Volume (Kilo Tons) and Value (US$ Bn) Forecast, by Application, 2022–2031
10.5. Europe Bio-based Phenol Market Volume (Kilo Tons) and Value (US$ Bn) Forecast, by End-use, 2022–2031
10.6. Europe Bio-based Phenol Market Volume (Kilo Tons) and Value (US$ Bn) Forecast, by Country and Sub-region, 2021-2031
10.6.1. Germany Bio-based Phenol Market Volume (Kilo Tons) and Value (US$ Bn) Forecast, by Derivative, 2022–2031
10.6.2. Germany Bio-based Phenol Market Volume (Kilo Tons) and Value (US$ Bn) Forecast, by Source, 2022–2031
10.6.3. Germany Bio-based Phenol Market Volume (Kilo Tons) and Value (US$ Bn) Forecast, by Application, 2022–2031
10.6.4. Germany. Bio-based Phenol Market Volume (Kilo Tons) and Value (US$ Bn) Forecast, End-use, 2022–2031
10.6.5. France Bio-based Phenol Market Volume (Kilo Tons) and Value (US$ Bn) Forecast, by Derivative, 2022–2031
10.6.6. France Bio-based Phenol Market Volume (Kilo Tons) and Value (US$ Bn) Forecast, by Source, 2022–2031
10.6.7. France Bio-based Phenol Market Volume (Kilo Tons) and Value (US$ Bn) Forecast, by Application, 2022–2031
10.6.8. France. Bio-based Phenol Market Volume (Kilo Tons) and Value (US$ Bn) Forecast, End-use, 2022–2031
10.6.9. U.K. Bio-based Phenol Market Volume (Kilo Tons) and Value (US$ Bn) Forecast, by Derivative, 2022–2031
10.6.10. U.K. Bio-based Phenol Market Volume (Kilo Tons) and Value (US$ Bn) Forecast, by Source, 2022–2031
10.6.11. U.K. Bio-based Phenol Market Volume (Kilo Tons) and Value (US$ Bn) Forecast, by Application, 2022–2031
10.6.12. U.K. Bio-based Phenol Market Volume (Kilo Tons) and Value (US$ Bn) Forecast, End-use, 2022–2031
10.6.13. Italy Bio-based Phenol Market Volume (Kilo Tons) and Value (US$ Bn) Forecast, by Derivative, 2022–2031
10.6.14. Italy. Bio-based Phenol Market Volume (Kilo Tons) and Value (US$ Bn) Forecast, by Source, 2022–2031
10.6.15. Italy Bio-based Phenol Market Volume (Kilo Tons) and Value (US$ Bn) Forecast, by Application, 2022–2031
10.6.16. Italy Bio-based Phenol Market Volume (Kilo Tons) and Value (US$ Bn) Forecast, End-use, 2022–2031
10.6.17. Spain Bio-based Phenol Market Volume (Kilo Tons) and Value (US$ Bn) Forecast, by Derivative, 2022–2031
10.6.18. Spain. Bio-based Phenol Market Volume (Kilo Tons) and Value (US$ Bn) Forecast, by Source, 2022–2031
10.6.19. Italy Bio-based Phenol Market Volume (Kilo Tons) and Value (US$ Bn) Forecast, by Application, 2021– Spain
10.6.20. Spain Bio-based Phenol Market Volume (Kilo Tons) and Value (US$ Bn) Forecast, End-use, 2022–2031
10.6.21. Russia & CIS Bio-based Phenol Market Volume (Kilo Tons) and Value (US$ Bn) Forecast, by Derivative, 2022–2031
10.6.22. Russia & CIS Bio-based Phenol Market Volume (Kilo Tons) and Value (US$ Bn) Forecast, by Source, 2022–2031
10.6.23. Russia & CIS Bio-based Phenol Market Volume (Kilo Tons) and Value (US$ Bn) Forecast, by Application, 2022–2031
10.6.24. Russia & CIS Bio-based Phenol Market Volume (Kilo Tons) and Value (US$ Bn) Forecast, End-use, 2022–2031
10.6.25. Rest of Europe Bio-based Phenol Market Volume (Kilo Tons) and Value (US$ Bn) Forecast, by Derivative, 2022–2031
10.6.26. Rest of Europe Bio-based Phenol Market Volume (Kilo Tons) and Value (US$ Bn) Forecast, by Source, 2022–2031
10.6.27. Rest of Europe Bio-based Phenol Market Volume (Kilo Tons) and Value (US$ Bn) Forecast, by Application, 2022–2031
10.6.28. Rest of Europe Bio-based Phenol Market Volume (Kilo Tons) and Value (US$ Bn) Forecast, End-use, 2022–2031
10.7. Europe Bio-based Phenol Market Attractiveness Analysis
11. Asia Pacific Bio-based Phenol Market Analysis and Forecast, 2022–2031
11.1. Key Findings
11.2. Asia Pacific Bio-based Phenol Market Volume (Kilo Tons) and Value (US$ Bn) Forecast, by Derivative
11.3. Asia Pacific Bio-based Phenol Market Volume (Kilo Tons) and Value (US$ Bn) Forecast, by Source, 2022–2031
11.4. Asia Pacific Bio-based Phenol Market Volume (Kilo Tons) and Value (US$ Bn) Forecast, by Application, 2022–2031
11.5. Asia Pacific Bio-based Phenol Market Volume (Kilo Tons) and Value (US$ Bn) Forecast, by End-use, 2022–2031
11.6. Asia Pacific Bio-based Phenol Market Volume (Kilo Tons) and Value (US$ Bn) Forecast, by Country and Sub-region, 2021-2031
11.6.1. China Bio-based Phenol Market Volume (Kilo Tons) and Value (US$ Bn) Forecast, by Derivative, 2022–2031
11.6.2. China Bio-based Phenol Market Volume (Kilo Tons) and Value (US$ Bn) Forecast, by Source, 2022–2031
11.6.3. China Bio-based Phenol Market Volume (Kilo Tons) and Value (US$ Bn) Forecast, by Application, 2022–2031
11.6.4. China Bio-based Phenol Market Volume (Kilo Tons) and Value (US$ Bn) Forecast, End-use, 2022–2031
11.6.5. Japan Bio-based Phenol Market Volume (Kilo Tons) and Value (US$ Bn) Forecast, by Derivative, 2022–2031
11.6.6. Japan Bio-based Phenol Market Volume (Kilo Tons) and Value (US$ Bn) Forecast, by Source, 2022–2031
11.6.7. Japan Bio-based Phenol Market Volume (Kilo Tons) and Value (US$ Bn) Forecast, by Application, 2022–2031
11.6.8. Japan Bio-based Phenol Market Volume (Kilo Tons) and Value (US$ Bn) Forecast, End-use, 2022–2031
11.6.9. India Bio-based Phenol Market Volume (Kilo Tons) and Value (US$ Bn) Forecast, by Derivative, 2022–2031
11.6.10. India Bio-based Phenol Market Volume (Kilo Tons) and Value (US$ Bn) Forecast, by Source, 2022–2031
11.6.11. India Bio-based Phenol Market Volume (Kilo Tons) and Value (US$ Bn) Forecast, by Application, 2022–2031
11.6.12. India Bio-based Phenol Market Volume (Kilo Tons) and Value (US$ Bn) Forecast, End-use, 2022–2031
11.6.13. ASEAN Bio-based Phenol Market Volume (Kilo Tons) and Value (US$ Bn) Forecast, by Derivative, 2022–2031
11.6.14. ASEAN Bio-based Phenol Market Volume (Kilo Tons) and Value (US$ Bn) Forecast, by Source, 2022–2031
11.6.15. ASEAN Bio-based Phenol Market Volume (Kilo Tons) and Value (US$ Bn) Forecast, by Application, 2022–2031
11.6.16. ASEAN Bio-based Phenol Market Volume (Kilo Tons) and Value (US$ Bn) Forecast, End-use, 2022–2031
11.6.17. Rest of Asia Pacific Bio-based Phenol Market Volume (Kilo Tons) and Value (US$ Bn) Forecast, by Derivative, 2022–2031
11.6.18. Rest of Asia Pacific Bio-based Phenol Market Volume (Kilo Tons) and Value (US$ Bn) Forecast, by Source, 2022–2031
11.6.19. Rest of Asia Pacific Bio-based Phenol Market Volume (Kilo Tons) and Value (US$ Bn) Forecast, by Application, 2022–2031
11.6.20. Rest of Asia Pacific Bio-based Phenol Market Volume (Kilo Tons) and Value (US$ Bn) Forecast, End-use, 2022–2031
11.7. Asia Pacific Bio-based Phenol Market Attractiveness Analysis
12. Latin America Bio-based Phenol Market Analysis and Forecast, 2022–2031
12.1. Key Findings
12.2. Latin America Bio-based Phenol Market Volume (Kilo Tons) and Value (US$ Bn) Forecast, by Derivative, 2022–2031
12.3. Latin America Bio-based Phenol Market Volume (Kilo Tons) and Value (US$ Bn) Forecast, by Source, 2022–2031
12.4. Latin America Bio-based Phenol Market Volume (Kilo Tons) and Value (US$ Bn) Forecast, by Application, 2022–2031
12.5. Latin America Bio-based Phenol Market Volume (Kilo Tons) and Value (US$ Bn) Forecast, by End-use, 2022–2031
12.6. Latin America Bio-based Phenol Market Volume (Kilo Tons) and Value (US$ Bn) Forecast, by Country and Sub-region, 2021-2031
12.6.1. Brazil Bio-based Phenol Market Volume (Kilo Tons) and Value (US$ Bn) Forecast, by Derivative, 2022–2031
12.6.2. Brazil Bio-based Phenol Market Volume (Kilo Tons) and Value (US$ Bn) Forecast, by Source, 2022–2031
12.6.3. Brazil Bio-based Phenol Market Volume (Kilo Tons) and Value (US$ Bn) Forecast, by Application, 2022–2031
12.6.4. Brazil Bio-based Phenol Market Volume (Kilo Tons) and Value (US$ Bn) Forecast, End-use, 2022–2031
12.6.5. Mexico Bio-based Phenol Market Volume (Kilo Tons) and Value (US$ Bn) Forecast, by Derivative, 2022–2031
12.6.6. Mexico Bio-based Phenol Market Volume (Kilo Tons) and Value (US$ Bn) Forecast, by Source, 2022–2031
12.6.7. Mexico Bio-based Phenol Market Volume (Kilo Tons) and Value (US$ Bn) Forecast, by Application, 2022–2031
12.6.8. Mexico Bio-based Phenol Market Volume (Kilo Tons) and Value (US$ Bn) Forecast, End-use, 2022–2031
12.6.9. Rest of Latin America Bio-based Phenol Market Volume (Kilo Tons) and Value (US$ Bn) Forecast, by Derivative, 2022–2031
12.6.10. Rest of Latin America Bio-based Phenol Market Volume (Kilo Tons) and Value (US$ Bn) Forecast, by Source, 2022–2031
12.6.11. Rest of Latin America Bio-based Phenol Market Volume (Kilo Tons) and Value (US$ Bn) Forecast, by Application, 2022–2031
12.6.12. Rest of Latin America Bio-based Phenol Market Volume (Kilo Tons) and Value (US$ Bn) Forecast, End-use, 2022–2031
12.7. Latin America Bio-based Phenol Market Attractiveness Analysis
13. Middle East & Africa Bio-based Phenol Market Analysis and Forecast, 2022–2031
13.1. Key Findings
13.2. Middle East & Africa Bio-based Phenol Market Volume (Kilo Tons) and Value (US$ Bn) Forecast, by Derivative, 2022–2031
13.3. Middle East & Africa Bio-based Phenol Market Volume (Kilo Tons) and Value (US$ Bn) Forecast, by Source, 2022–2031
13.4. Middle East & Africa Bio-based Phenol Market Volume (Kilo Tons) and Value (US$ Bn) Forecast, by Application, 2022–2031
13.5. Middle East & Africa Bio-based Phenol Market Volume (Kilo Tons) and Value (US$ Bn) Forecast, by End-use, 2022–2031
13.6. Middle East & Africa Bio-based Phenol Market Volume (Kilo Tons) and Value (US$ Bn) Forecast, by Country and Sub-region, 2021-2031
13.6.1. GCC Bio-based Phenol Market Volume (Kilo Tons) and Value (US$ Bn) Forecast, by Derivative, 2022–2031
13.6.2. GCC Bio-based Phenol Market Volume (Kilo Tons) and Value (US$ Bn) Forecast, by Source, 2022–2031
13.6.3. GCC Bio-based Phenol Market Volume (Kilo Tons) and Value (US$ Bn) Forecast, by Application, 2022–2031
13.6.4. GCC Bio-based Phenol Market Volume (Kilo Tons) and Value (US$ Bn) Forecast, End-use, 2022–2031
13.6.5. South Africa Bio-based Phenol Market Volume (Kilo Tons) and Value (US$ Bn) Forecast, by Derivative, 2022–2031
13.6.6. South Africa Bio-based Phenol Market Volume (Kilo Tons) and Value (US$ Bn) Forecast, by Source, 2022–2031
13.6.7. South Africa Bio-based Phenol Market Volume (Kilo Tons) and Value (US$ Bn) Forecast, by Application, 2022–2031
13.6.8. South Africa Bio-based Phenol Market Volume (Kilo Tons) and Value (US$ Bn) Forecast, End-use, 2022–2031
13.6.9. Rest of Middle East & Africa Bio-based Phenol Market Volume (Kilo Tons) and Value (US$ Bn) Forecast, by Derivative, 2022–2031
13.6.10. Rest of Middle East & Africa Bio-based Phenol Market Volume (Kilo Tons) and Value (US$ Bn) Forecast, by Source, 2022–2031
13.6.11. Rest of Middle East & Africa Bio-based Phenol Market Volume (Kilo Tons) and Value (US$ Bn) Forecast, by Application, 2022–2031
13.6.12. Rest of Middle East & Africa Bio-based Phenol Market Volume (Kilo Tons) and Value (US$ Bn) Forecast, End-use, 2022–2031
13.7. Middle East & Africa Bio-based Phenol Market Attractiveness Analysis
14. Competition Landscape
14.1. Competition Matrix
14.2. Bio-based Phenol Market Share Analysis, by Company (2020)
14.3. Source Mapping
14.4. Company Profiles
14.4.1. DSM Company
14.4.1.1. Company Details (HQ, Foundation Year, Revenue, Employee Strength)
14.4.1.2. Business Overview
14.4.1.3. Source/Services, Key End-user Industries
14.4.1.4. Financial Overview
14.4.1.5. Business Strategy
14.4.1.6. Recent Developments
14.4.2. EUCLID
14.4.2.1. Company Details (HQ, Foundation Year, Revenue, Employee Strength)
14.4.2.2. Business Overview
14.4.2.3. Source/Services, Key End-user Industries
14.4.2.4. Business Strategy
14.4.3. AB Enterprises
14.4.3.1. Company Details (HQ, Foundation Year, Revenue, Employee Strength)
14.4.3.2. Business Overview
14.4.3.3. Source/Services, Key End-user Industries
14.4.3.4. Business Strategy
14.4.4. Borealis
14.4.4.1. Company Details (HQ, Foundation Year, Revenue, Employee Strength)
14.4.4.2. Business Overview
14.4.4.3. Source/Services, Key End-user Industries
14.4.4.4. Business Strategy
14.4.4.5. Recent Development
14.4.5. Mitsui Chemicals
14.4.5.1. Company Details (HQ, Foundation Year, Revenue, Employee Strength)
14.4.5.2. Business Overview
14.4.5.3. Source/Services, Key End-user Industries
14.4.5.4. Business Strategy
14.4.5.5. Recent Developments
14.4.6. Lanxess Deutschland GmbH
14.4.6.1. Company Details (HQ, Foundation Year, Revenue, Employee Strength)
14.4.6.2. Business Overview
14.4.6.3. Source/Services, Key End-user Industries
14.4.7. Technon OrbiChem
14.4.7.1. Company Details (HQ, Foundation Year, Revenue, Employee Strength)
14.4.7.2. Business Overview
14.4.7.3. Source/Services, Key End-user Industries
14.4.8. UPM Biochemicals
14.4.8.1. Company Details (HQ, Foundation Year, Revenue, Employee Strength)
14.4.8.2. Business Overview
14.4.8.3. Source/Services, Key End-user Industries
15. Primary Research: Key Insights
16. Appendix
List of Tables
Table 1: Global Bio-based Phenol Market Volume (Kilo Tons) Forecast, by Derivative, 2022–2031
Table 2: Global Bio-based Phenol Market Value (US$ Bn) Forecast, by Derivative, 2022–2031
Table 3: Global Bio-based Phenol Market Volume (Kilo Tons) Forecast, by Source, 2022–2031
Table 4: Global Bio-based Phenol Market Value (US$ Bn) Forecast, by Source, 2022–2031
Table 5: Global Bio-based Phenol Market Volume (Kilo Tons) Forecast, by Application, 2022–2031
Table 6: Global Bio-based Phenol Market Value (US$ Bn) Forecast, by Application, 2022–2031
Table 7: Global Bio-based Phenol Market Volume (Kilo Tons) Forecast, by End-use, 2022–2031
Table 8: Global Bio-based Phenol Market Value (US$ Bn) Forecast, by End-use, 2022–2031
Table 9: Global Bio-based Phenol Market Volume (Kilo Tons) Forecast, by Region, 2022–2031
Table 10: Global Bio-based Phenol Market Value (US$ Bn) Forecast, by Region, 2022–2031
Table 11: North America Bio-based Phenol Market Volume (Kilo Tons) Forecast, by Derivative, 2022–2031
Table 12: North America Bio-based Phenol Market Value (US$ Bn) Forecast, by Derivative, 2022–2031
Table 13: North America Bio-based Phenol Market Volume (Kilo Tons) Forecast, by Source, 2022–2031
Table 14: North America Bio-based Phenol Market Value (US$ Bn) Forecast, by Source, 2022–2031
Table 15: North America Bio-based Phenol Market Volume (Kilo Tons) Forecast, by Application, 2022–2031
Table 16: North America Bio-based Phenol Market Value (US$ Bn) Forecast, by Application, 2022–2031
Table 17: North America Bio-based Phenol Market Volume (Kilo Tons) Forecast, by End-use, 2022–2031
Table 18: North America Bio-based Phenol Market Value (US$ Bn) Forecast, by End-use, 2022–2031
Table 19: North America Bio-based Phenol Market Volume (Kilo Tons) Forecast, by Country, 2022–2031
Table 20: North America Bio-based Phenol Market Value (US$ Bn) Forecast, by Country, 2022–2031
Table 21: U.S. Bio-based Phenol Market Volume (Kilo Tons) Forecast, by Derivative, 2022–2031
Table 22: U.S. Bio-based Phenol Market Value (US$ Bn) Forecast, by Derivative, 2022–2031
Table 23: U.S. Bio-based Phenol Market Volume (Kilo Tons) Forecast, by Source, 2022–2031
Table 24: U.S. Bio-based Phenol Market Value (US$ Bn) Forecast, by Source, 2022–2031
Table 25: U.S. Bio-based Phenol Market Volume (Kilo Tons) Forecast, by Application, 2022–2031
Table 26: U.S. Bio-based Phenol Market Value (US$ Bn) Forecast, by Application, 2022–2031
Table 27: U.S. Bio-based Phenol Market Volume (Kilo Tons) Forecast, by End-use, 2022–2031
Table 28: U.S. Bio-based Phenol Market Value (US$ Bn) Forecast, by End-use, 2022–2031
Table 29: Canada Bio-based Phenol Market Volume (Kilo Tons) Forecast, by Derivative, 2022–2031
Table 30: Canada Bio-based Phenol Market Value (US$ Bn) Forecast, by Derivative, 2022–2031
Table 31: Canada Bio-based Phenol Market Volume (Kilo Tons) Forecast, by Source, 2022–2031
Table 32: Canada Bio-based Phenol Market Value (US$ Bn) Forecast, by Source, 2022–2031
Table 33: Canada Bio-based Phenol Market Volume (Kilo Tons) Forecast, by Application, 2022–2031
Table 34: Canada Bio-based Phenol Market Value (US$ Bn) Forecast, by Application, 2022–2031
Table 35: Canada Bio-based Phenol Market Volume (Kilo Tons) Forecast, by End-use, 2022–2031
Table 36: Canada Bio-based Phenol Market Value (US$ Bn) Forecast, by End-use 2022–2031
Table 37: Europe Bio-based Phenol Market Volume (Kilo Tons) Forecast, by Derivative, 2022–2031
Table 38: Europe Bio-based Phenol Market Value (US$ Bn) Forecast, by Derivative, 2022–2031
Table 39: Europe Bio-based Phenol Market Volume (Kilo Tons) Forecast, by Source, 2022–2031
Table 40: Europe Bio-based Phenol Market Value (US$ Bn) Forecast, by Source, 2022–2031
Table 41: Europe Bio-based Phenol Market Volume (Kilo Tons) Forecast, by Application, 2022–2031
Table 42: Europe Bio-based Phenol Market Value (US$ Bn) Forecast, by Application, 2022–2031
Table 43: Europe Bio-based Phenol Market Volume (Kilo Tons) Forecast, by End-use, 2022–2031
Table 44: Europe Bio-based Phenol Market Value (US$ Bn) Forecast, by End-use 2022–2031
Table 45: Europe Bio-based Phenol Market Volume (Kilo Tons) Forecast, by Country and Sub-region, 2022–2031
Table 46: Europe Bio-based Phenol Market Value (US$ Bn) Forecast, by Country and Sub-region, 2022–2031
Table 47: Germany Bio-based Phenol Market Volume (Kilo Tons) Forecast, by Derivative, 2022–2031
Table 48: Germany Bio-based Phenol Market Value (US$ Bn) Forecast, by Derivative, 2022–2031
Table 49: Germany Bio-based Phenol Market Volume (Kilo Tons) Forecast, by Source, 2022–2031
Table 50: Germany Bio-based Phenol Market Value (US$ Bn) Forecast, by Source, 2022–2031
Table 51: Germany Bio-based Phenol Market Volume (Kilo Tons) Forecast, by Application, 2022–2031
Table 52: Germany Bio-based Phenol Market Value (US$ Bn) Forecast, by Application, 2022–2031
Table 53: Germany Bio-based Phenol Market Volume (Kilo Tons) Forecast, by End-use, 2022–2031
Table 54: Germany Bio-based Phenol Market Value (US$ Bn) Forecast, by End-use 2022–2031
Table 55: France Bio-based Phenol Market Volume (Kilo Tons) Forecast, by Derivative, 2022–2031
Table 56: France Bio-based Phenol Market Value (US$ Bn) Forecast, by Derivative, 2022–2031
Table 57: France Bio-based Phenol Market Volume (Kilo Tons) Forecast, by Source, 2022–2031
Table 58: France Bio-based Phenol Market Value (US$ Bn) Forecast, by Source, 2022–2031
Table 59: France Bio-based Phenol Market Volume (Kilo Tons) Forecast, by Application, 2022–2031
Table 60: France Bio-based Phenol Market Value (US$ Bn) Forecast, by Application, 2022–2031
Table 61: France Bio-based Phenol Market Volume (Kilo Tons) Forecast, by End-use, 2022–2031
Table 62: France Bio-based Phenol Market Value (US$ Bn) Forecast, by End-use 2022–2031
Table 63: U.K. Bio-based Phenol Market Volume (Kilo Tons) Forecast, by Derivative, 2022–2031
Table 64: U.K. Bio-based Phenol Market Value (US$ Bn) Forecast, by Derivative, 2022–2031
Table 65: U.K. Bio-based Phenol Market Volume (Kilo Tons) Forecast, by Source, 2022–2031
Table 66: U.K. Bio-based Phenol Market Value (US$ Bn) Forecast, by Source, 2022–2031
Table 67: U.K. Bio-based Phenol Market Volume (Kilo Tons) Forecast, by Application, 2022–2031
Table 68: U.K. Bio-based Phenol Market Value (US$ Bn) Forecast, by Application, 2022–2031
Table 69: U.K. Bio-based Phenol Market Volume (Kilo Tons) Forecast, by End-use, 2022–2031
Table 70: U.K. Bio-based Phenol Market Value (US$ Bn) Forecast, by End-use 2022–2031
Table 71: Italy Bio-based Phenol Market Volume (Kilo Tons) Forecast, by Derivative, 2022–2031
Table 72: Italy Bio-based Phenol Market Value (US$ Bn) Forecast, by Derivative, 2022–2031
Table 73: Italy Bio-based Phenol Market Volume (Kilo Tons) Forecast, by Source, 2022–2031
Table 74: Italy Bio-based Phenol Market Value (US$ Bn) Forecast, by Source, 2022–2031
Table 75: Italy Bio-based Phenol Market Volume (Kilo Tons) Forecast, by Application, 2022–2031
Table 76: Italy Bio-based Phenol Market Value (US$ Bn) Forecast, by Application, 2022–2031
Table 77: Italy Bio-based Phenol Market Volume (Kilo Tons) Forecast, by End-use, 2022–2031
Table 78: Italy Bio-based Phenol Market Value (US$ Bn) Forecast, by End-use 2022–2031
Table 79: Spain Bio-based Phenol Market Volume (Kilo Tons) Forecast, by Derivative, 2022–2031
Table 80: Spain Bio-based Phenol Market Value (US$ Bn) Forecast, by Derivative, 2022–2031
Table 81: Spain Bio-based Phenol Market Volume (Kilo Tons) Forecast, by Source, 2022–2031
Table 82: Spain Bio-based Phenol Market Value (US$ Bn) Forecast, by Source, 2022–2031
Table 83: Spain Bio-based Phenol Market Volume (Kilo Tons) Forecast, by Application, 2022–2031
Table 84: Spain Bio-based Phenol Market Value (US$ Bn) Forecast, by Application, 2022–2031
Table 85: Spain Bio-based Phenol Market Volume (Kilo Tons) Forecast, by End-use, 2022–2031
Table 86: Spain Bio-based Phenol Market Value (US$ Bn) Forecast, by End-use 2022–2031
Table 87: Russia & CIS Bio-based Phenol Market Volume (Kilo Tons) Forecast, by Derivative, 2022–2031
Table 88: Russia & CIS Bio-based Phenol Market Value (US$ Bn) Forecast, by Derivative, 2022–2031
Table 89: Russia & CIS Bio-based Phenol Market Volume (Kilo Tons) Forecast, by Source, 2022–2031
Table 90: Russia & CIS Bio-based Phenol Market Value (US$ Bn) Forecast, by Source, 2022–2031
Table 91: Russia & CIS Bio-based Phenol Market Volume (Kilo Tons) Forecast, by Application, 2022–2031
Table 92: Russia & CIS Bio-based Phenol Market Value (US$ Bn) Forecast, by Application, 2022–2031
Table 93: Russia & CIS Bio-based Phenol Market Volume (Kilo Tons) Forecast, by End-use, 2022–2031
Table 94: Russia & CIS Bio-based Phenol Market Value (US$ Bn) Forecast, by End-use 2022–2031
Table 95: Rest of Europe Bio-based Phenol Market Volume (Kilo Tons) Forecast, by Derivative, 2022–2031
Table 96: Rest of Europe Bio-based Phenol Market Value (US$ Bn) Forecast, by Derivative, 2022–2031
Table 97: Rest of Europe Bio-based Phenol Market Volume (Kilo Tons) Forecast, by Source, 2022–2031
Table 98: Rest of Europe Bio-based Phenol Market Value (US$ Bn) Forecast, by Source, 2022–2031
Table 99: Rest of Europe Bio-based Phenol Market Volume (Kilo Tons) Forecast, by Application, 2022–2031
Table 100: Rest of Europe Bio-based Phenol Market Value (US$ Bn) Forecast, by Application, 2022–2031
Table 101: Rest of Europe Bio-based Phenol Market Volume (Kilo Tons) Forecast, by End-use, 2022–2031
Table 102: Rest of Europe Bio-based Phenol Market Value (US$ Bn) Forecast, by End-use 2022–2031
Table 103: Asia Pacific Bio-based Phenol Market Volume (Kilo Tons) Forecast, by Derivative, 2022–2031
Table 104: Asia Pacific Bio-based Phenol Market Value (US$ Bn) Forecast, by Derivative, 2022–2031
Table 105: Asia Pacific Bio-based Phenol Market Volume (Kilo Tons) Forecast, by Source, 2022–2031
Table 106: Asia Pacific Bio-based Phenol Market Value (US$ Bn) Forecast, by Source, 2022–2031
Table 107: Asia Pacific Bio-based Phenol Market Volume (Kilo Tons) Forecast, by Application, 2022–2031
Table 108: Asia Pacific Bio-based Phenol Market Value (US$ Bn) Forecast, by Application, 2022–2031
Table 109: Asia Pacific Bio-based Phenol Market Volume (Kilo Tons) Forecast, by End-use, 2022–2031
Table 110: Asia Pacific Bio-based Phenol Market Value (US$ Bn) Forecast, by End-use 2022–2031
Table 111: Asia Pacific Bio-based Phenol Market Volume (Kilo Tons) Forecast, by Country and Sub-region, 2022–2031
Table 112: Asia Pacific Bio-based Phenol Market Value (US$ Bn) Forecast, by Country and Sub-region, 2022–2031
Table 113: China Bio-based Phenol Market Volume (Kilo Tons) Forecast, by Derivative, 2022–2031
Table 114: China Bio-based Phenol Market Value (US$ Bn) Forecast, by Derivative 2022–2031
Table 115: China Bio-based Phenol Market Volume (Kilo Tons) Forecast, by Source, 2022–2031
Table 116: China Bio-based Phenol Market Value (US$ Bn) Forecast, by Source, 2022–2031
Table 117: China Bio-based Phenol Market Volume (Kilo Tons) Forecast, by Application, 2022–2031
Table 118: China Bio-based Phenol Market Value (US$ Bn) Forecast, by Application, 2022–2031
Table 119: China Bio-based Phenol Market Volume (Kilo Tons) Forecast, by End-use, 2022–2031
Table 120: China Bio-based Phenol Market Value (US$ Bn) Forecast, by End-use 2022–2031
Table 121: Japan Bio-based Phenol Market Volume (Kilo Tons) Forecast, by Derivative, 2022–2031
Table 122: Japan Bio-based Phenol Market Value (US$ Bn) Forecast, by Derivative, 2022–2031
Table 123: Japan Bio-based Phenol Market Volume (Kilo Tons) Forecast, by Source, 2022–2031
Table 124: Japan Bio-based Phenol Market Value (US$ Bn) Forecast, by Source, 2022–2031
Table 125: Japan Bio-based Phenol Market Volume (Kilo Tons) Forecast, by Application, 2022–2031
Table 126: Japan Bio-based Phenol Market Value (US$ Bn) Forecast, by Application, 2022–2031
Table 127: Japan Bio-based Phenol Market Volume (Kilo Tons) Forecast, by End-use, 2022–2031
Table 128: Japan Bio-based Phenol Market Value (US$ Bn) Forecast, by End-use 2022–2031
Table 129: India Bio-based Phenol Market Volume (Kilo Tons) Forecast, by Derivative, 2022–2031
Table 130: India Bio-based Phenol Market Value (US$ Bn) Forecast, by Derivative, 2022–2031
Table 131: India Bio-based Phenol Market Volume (Kilo Tons) Forecast, by Source, 2022–2031
Table 132: India Bio-based Phenol Market Value (US$ Bn) Forecast, by Source, 2022–2031
Table 133: India Bio-based Phenol Market Volume (Kilo Tons) Forecast, by Application, 2022–2031
Table 134: India Bio-based Phenol Market Value (US$ Bn) Forecast, by Application, 2022–2031
Table 135: India Bio-based Phenol Market Volume (Kilo Tons) Forecast, by End-use, 2022–2031
Table 136: India Bio-based Phenol Market Value (US$ Bn) Forecast, by End-use 2022–2031
Table 137: ASEAN Bio-based Phenol Market Volume (Kilo Tons) Forecast, by Derivative, 2022–2031
Table 138: ASEAN Bio-based Phenol Market Value (US$ Bn) Forecast, by Derivative, 2022–2031
Table 139: ASEAN Bio-based Phenol Market Volume (Kilo Tons) Forecast, by Source, 2022–2031
Table 140: ASEAN Bio-based Phenol Market Value (US$ Bn) Forecast, by Source, 2022–2031
Table 141: ASEAN Bio-based Phenol Market Volume (Kilo Tons) Forecast, by Application, 2022–2031
Table 142: ASEAN Bio-based Phenol Market Value (US$ Bn) Forecast, by Application, 2022–2031
Table 143: ASEAN Bio-based Phenol Market Volume (Kilo Tons) Forecast, by End-use, 2022–2031
Table 144: ASEAN Bio-based Phenol Market Value (US$ Bn) Forecast, by End-use 2022–2031
Table 145: Rest of Asia Pacific Bio-based Phenol Market Volume (Kilo Tons) Forecast, by Derivative, 2022–2031
Table 146: Rest of Asia Pacific Bio-based Phenol Market Value (US$ Bn) Forecast, by Derivative, 2022–2031
Table 147: Rest of Asia Pacific Bio-based Phenol Market Volume (Kilo Tons) Forecast, by Source, 2022–2031
Table 148: Rest of Asia Pacific Bio-based Phenol Market Value (US$ Bn) Forecast, by Source, 2022–2031
Table 149: Rest of Asia Pacific Bio-based Phenol Market Volume (Kilo Tons) Forecast, by Application, 2022–2031
Table 150: Rest of Asia Pacific Bio-based Phenol Market Value (US$ Bn) Forecast, by Application, 2022–2031
Table 151: Rest of Asia Pacific Bio-based Phenol Market Volume (Kilo Tons) Forecast, by End-use, 2022–2031
Table 152: Rest of Asia Pacific Bio-based Phenol Market Value (US$ Bn) Forecast, by End-use 2022–2031
Table 153: Latin America Bio-based Phenol Market Volume (Kilo Tons) Forecast, by Derivative, 2022–2031
Table 154: Latin America Bio-based Phenol Market Value (US$ Bn) Forecast, by Derivative, 2022–2031
Table 155: Latin America Bio-based Phenol Market Volume (Kilo Tons) Forecast, by Source, 2022–2031
Table 156: Latin America Bio-based Phenol Market Value (US$ Bn) Forecast, by Source, 2022–2031
Table 157: Latin America Bio-based Phenol Market Volume (Kilo Tons) Forecast, by Application, 2022–2031
Table 158: Latin America Bio-based Phenol Market Value (US$ Bn) Forecast, by Application, 2022–2031
Table 159: Latin America Bio-based Phenol Market Volume (Kilo Tons) Forecast, by End-use, 2022–2031
Table 160: Latin America Bio-based Phenol Market Value (US$ Bn) Forecast, by End-use 2022–2031
Table 161: Latin America Bio-based Phenol Market Volume (Kilo Tons) Forecast, by Country and Sub-region, 2022–2031
Table 162: Latin America Bio-based Phenol Market Value (US$ Bn) Forecast, by Country and Sub-region, 2022–2031
Table 163: Brazil Bio-based Phenol Market Volume (Kilo Tons) Forecast, by Derivative, 2022–2031
Table 164: Brazil Bio-based Phenol Market Value (US$ Bn) Forecast, by Derivative, 2022–2031
Table 165: Brazil Bio-based Phenol Market Volume (Kilo Tons) Forecast, by Source, 2022–2031
Table 166: Brazil Bio-based Phenol Market Value (US$ Bn) Forecast, by Source, 2022–2031
Table 167: Brazil Bio-based Phenol Market Volume (Kilo Tons) Forecast, by Application, 2022–2031
Table 168: Brazil Bio-based Phenol Market Value (US$ Bn) Forecast, by Application, 2022–2031
Table 169: Brazil Bio-based Phenol Market Volume (Kilo Tons) Forecast, by End-use, 2022–2031
Table 170: Brazil Bio-based Phenol Market Value (US$ Bn) Forecast, by End-use 2022–2031
Table 171: Mexico Bio-based Phenol Market Volume (Kilo Tons) Forecast, by Derivative, 2022–2031
Table 172: Mexico Bio-based Phenol Market Value (US$ Bn) Forecast, by Derivative, 2022–2031
Table 173: Mexico Bio-based Phenol Market Volume (Kilo Tons) Forecast, by Source, 2022–2031
Table 174: Mexico Bio-based Phenol Market Value (US$ Bn) Forecast, by Source, 2022–2031
Table 175: Mexico Bio-based Phenol Market Volume (Kilo Tons) Forecast, by Application, 2022–2031
Table 176: Mexico Bio-based Phenol Market Value (US$ Bn) Forecast, by Application, 2022–2031
Table 177: Mexico Bio-based Phenol Market Volume (Kilo Tons) Forecast, by End-use, 2022–2031
Table 178: Mexico Bio-based Phenol Market Value (US$ Bn) Forecast, by End-use 2022–2031
Table 179: Rest of Latin America Bio-based Phenol Market Volume (Kilo Tons) Forecast, by Derivative, 2022–2031
Table 180: Rest of Latin America Bio-based Phenol Market Value (US$ Bn) Forecast, by Derivative, 2022–2031
Table 181: Rest of Latin America Bio-based Phenol Market Volume (Kilo Tons) Forecast, by Source, 2022–2031
Table 182: Rest of Latin America Bio-based Phenol Market Value (US$ Bn) Forecast, by Source, 2022–2031
Table 183: Rest of Latin America Bio-based Phenol Market Volume (Kilo Tons) Forecast, by Application, 2022–2031
Table 184: Rest of Latin America Bio-based Phenol Market Value (US$ Bn) Forecast, by Application, 2022–2031
Table 185: Rest of Latin America Bio-based Phenol Market Volume (Kilo Tons) Forecast, by End-use, 2022–2031
Table 186: Rest of Latin America Bio-based Phenol Market Value (US$ Bn) Forecast, by End-use 2022–2031
Table 187: Middle East & Africa Bio-based Phenol Market Volume (Kilo Tons) Forecast, by Derivative, 2022–2031
Table 188: Middle East & Africa Bio-based Phenol Market Value (US$ Bn) Forecast, by Derivative, 2022–2031
Table 189: Middle East & Africa Bio-based Phenol Market Volume (Kilo Tons) Forecast, by Source, 2022–2031
Table 190: Middle East & Africa Bio-based Phenol Market Value (US$ Bn) Forecast, by Source, 2022–2031
Table 191: Middle East & Africa Bio-based Phenol Market Volume (Kilo Tons) Forecast, by Application, 2022–2031
Table 192: Middle East & Africa Bio-based Phenol Market Value (US$ Bn) Forecast, by Application, 2022–2031
Table 193: v Bio-based Phenol Market Volume (Kilo Tons) Forecast, by End-use, 2022–2031
Table 194: Middle East & Africa Bio-based Phenol Market Value (US$ Bn) Forecast, by End-use 2022–2031
Table 195: Middle East & Africa Bio-based Phenol Market Volume (Kilo Tons) Forecast, by Country and Sub-region, 2022–2031
Table 196: Middle East & Africa Bio-based Phenol Market Value (US$ Bn) Forecast, by Country and Sub-region, 2022–2031
Table 197: GCC Bio-based Phenol Market Volume (Kilo Tons) Forecast, by Derivative, 2022–2031
Table 198: GCC Bio-based Phenol Market Value (US$ Bn) Forecast, by Derivative, 2022–2031
Table 199: GCC Bio-based Phenol Market Volume (Kilo Tons) Forecast, by Source, 2022–2031
Table 200: GCC Bio-based Phenol Market Value (US$ Bn) Forecast, by Source, 2022–2031
Table 201: GCC Bio-based Phenol Market Volume (Kilo Tons) Forecast, by Application, 2022–2031
Table 202: GCC Bio-based Phenol Market Value (US$ Bn) Forecast, by Application, 2022–2031
Table 203: GCC Bio-based Phenol Market Volume (Kilo Tons) Forecast, by End-use, 2022–2031
Table 204: GCC Bio-based Phenol Market Value (US$ Bn) Forecast, by End-use 2022–2031
Table 205: South Africa Bio-based Phenol Market Volume (Kilo Tons) Forecast, by Derivative, 2022–2031
Table 206: South Africa Bio-based Phenol Market Value (US$ Bn) Forecast, by Derivative, 2022–2031
Table 207: South Africa Bio-based Phenol Market Volume (Kilo Tons) Forecast, by Source, 2022–2031
Table 208: South Africa Bio-based Phenol Market Value (US$ Bn) Forecast, by Source, 2022–2031
Table 209: South Africa Bio-based Phenol Market Volume (Kilo Tons) Forecast, by Application, 2022–2031
Table 210: South Africa Bio-based Phenol Market Value (US$ Bn) Forecast, by Application, 2022–2031
Table 211: South Africa Bio-based Phenol Market Volume (Kilo Tons) Forecast, by End-use, 2022–2031
Table 212: South Africa Bio-based Phenol Market Value (US$ Bn) Forecast, by End-use 2022–2031
Table 213: Rest of Middle East & Africa Bio-based Phenol Market Volume (Kilo Tons) Forecast, by Derivative, 2022–2031
Table 214: Rest of Middle East & Africa Bio-based Phenol Market Value (US$ Bn) Forecast, by Derivative, 2022–2031
Table 215: Rest of Middle East & Africa Bio-based Phenol Market Volume (Kilo Tons) Forecast, by Source, 2022–2031
Table 216: Rest of Middle East & Africa Bio-based Phenol Market Value (US$ Bn) Forecast, by Source, 2022–2031
Table 217: Rest of Middle East & Africa Bio-based Phenol Market Volume (Kilo Tons) Forecast, by Application, 2022–2031
Table 218: Rest of Middle East & Africa Bio-based Phenol Market Value (US$ Bn) Forecast, by Application, 2022–2031
Table 219: Rest of Middle East & Africa Bio-based Phenol Market Volume (Kilo Tons) Forecast, by End-use, 2022–2031
Table 220: Rest of Middle East & Africa Bio-based Phenol Market Value (US$ Bn) Forecast, by End-use 2022–2031
List of Figures
Figure 1: Global Bio-based Phenol Market Volume Share Analysis, by Derivative, 2021, 2025, and 2031
Figure 2: Global Bio-based Phenol Market Attractiveness, by Derivative
Figure 3: Global Bio-based Phenol Market Volume Share Analysis, by Source, 2021, 2025, and 2031
Figure 4: Global Bio-based Phenol Market Attractiveness, by Source
Figure 5: Global Bio-based Phenol Market Volume Share Analysis, by Application, 2021, 2025, and 2031
Figure 6: Global Bio-based Phenol Market Attractiveness, by Application
Figure 7: Global Bio-based Phenol Market Volume Share Analysis, by End-use, 2021, 2025, and 2031
Figure 8: Global Bio-based Phenol Market Attractiveness, by End-use
Figure 9: Global Bio-based Phenol Market Volume Share Analysis, by Region, 2021, 2025, and 2031
Figure 10: Global Bio-based Phenol Market Attractiveness, by Region
Figure 11: North America Bio-based Phenol Market Volume Share Analysis, by Derivative, 2021, 2025, and 2031
Figure 12: North America Bio-based Phenol Market Attractiveness, by Derivative
Figure 13: North America Bio-based Phenol Market Attractiveness, by Derivative
Figure 14: North America Bio-based Phenol Market Volume Share Analysis, by Source, 2021, 2025, and 2031
Figure 15: North America Bio-based Phenol Market Attractiveness, by Source
Figure 16: North America Bio-based Phenol Market Volume Share Analysis, by Application, 2021, 2025, and 2031
Figure 17: North America Bio-based Phenol Market Attractiveness, by Application
Figure 18: North America Bio-based Phenol Market Volume Share Analysis, by End-use, 2021, 2025, and 2031
Figure 19: North America Bio-based Phenol Market Attractiveness, by End-use
Figure 20: North America Bio-based Phenol Market Attractiveness, by Country and Sub-region
Figure 21: Europe Bio-based Phenol Market Volume Share Analysis, by Derivative, 2021, 2025, and 2031
Figure 22: Europe Bio-based Phenol Market Attractiveness, by Derivative
Figure 23: Europe Bio-based Phenol Market Volume Share Analysis, by Source, 2021, 2025, and 2031
Figure 24: Europe Bio-based Phenol Market Attractiveness, by Source
Figure 25: Europe Bio-based Phenol Market Volume Share Analysis, by Application, 2021, 2025, and 2031
Figure 26: Europe Bio-based Phenol Market Attractiveness, by Application
Figure 27: Europe Bio-based Phenol Market Volume Share Analysis, by End-use, 2021, 2025, and 2031
Figure 28: Europe Bio-based Phenol Market Attractiveness, by End-use
Figure 29: Europe Bio-based Phenol Market Volume Share Analysis, by Country and Sub-region, 2021, 2025, and 2031
Figure 30: Europe Bio-based Phenol Market Attractiveness, by Country and Sub-region
Figure 31: Asia Pacific Bio-based Phenol Market Volume Share Analysis, by Derivative, 2021, 2025, and 2031
Figure 32: Asia Pacific Bio-based Phenol Market Attractiveness, by Derivative
Figure 33: Asia Pacific Bio-based Phenol Market Volume Share Analysis, by Source, 2021, 2025, and 2031
Figure 34: Asia Pacific Bio-based Phenol Market Attractiveness, by Source
Figure 35: Asia Pacific Bio-based Phenol Market Volume Share Analysis, by Application, 2021, 2025, and 2031
Figure 36: Asia Pacific Bio-based Phenol Market Attractiveness, by Application
Figure 33: Asia Pacific Bio-based Phenol Market Volume Share Analysis, by End-use, 2021, 2025, and 2031
Figure 34: Asia Pacific Bio-based Phenol Market Attractiveness, by End-use
Figure 35: Asia Pacific Bio-based Phenol Market Volume Share Analysis, by Country and Sub-region, 2021, 2025, and 2031
Figure 36: Asia Pacific Bio-based Phenol Market Attractiveness, by Country and Sub-region
Figure 33: Latin America Bio-based Phenol Market Volume Share Analysis, by Derivative, 2021, 2025, and 2031
Figure 34: Latin America Bio-based Phenol Market Attractiveness, by Derivative
Figure 35: Latin America Bio-based Phenol Market Volume Share Analysis, by Source, 2021, 2025, and 2031
Figure 36: Latin America Bio-based Phenol Market Attractiveness, by Source
Figure 33: Latin America Bio-based Phenol Market Volume Share Analysis, by Application, 2021, 2025, and 2031
Figure 34: Latin America Bio-based Phenol Market Attractiveness, by Application
Figure 35: Latin America Bio-based Phenol Market Volume Share Analysis, by End-use, 2021, 2025, and 2031
Figure 36: Latin America Bio-based Phenol Market Attractiveness, by End-use
Figure 36: Latin America Bio-based Phenol Market Volume Share Analysis, by Country and Sub-region, 2021, 2025, and 2031
Figure 37: Latin America Bio-based Phenol Market Attractiveness, by Country and Sub-region
Figure 38: Middle East & Africa Bio-based Phenol Market Volume Share Analysis, by Derivative, 2021, 2025, and 2031
Figure 39: Middle East & Africa Bio-based Phenol Market Attractiveness, by Derivative
Figure 40: Middle East & Africa Bio-based Phenol Market Volume Share Analysis, by Source, 2021, 2025, and 2031
Figure 41: Middle East & Africa Bio-based Phenol Market Attractiveness, by Source
Figure 42: Middle East & Africa Bio-based Phenol Market Volume Share Analysis, by Application, 2021, 2025, and 2031
Figure 43: Middle East & Africa Bio-based Phenol Market Attractiveness, by Application
Figure 44: Middle East & Africa Bio-based Phenol Market Volume Share Analysis, by End-use, 2021, 2025, and 2031
Figure 45: Middle East & Africa Bio-based Phenol Market Attractiveness, by End-use
Figure 46: Middle East & Africa Bio-based Phenol Market Volume Share Analysis, by Country and Sub-region, 2021, 2025, and 2031
Figure 47: Middle East & Africa Bio-based Phenol Market Attractiveness, by Country and Sub-region
Copyright © Transparency Market Research, Inc. All Rights reserved
Trust Online

Bio-based Phenol Market