
Reports
Reports
Analysts’ Viewpoint on Market Scenario
Bio-based flavors and fragrances are preferred over artificial flavors and fragrances, especially in food and beverage and cosmetics industries owing to their incumbent properties such as better taste and pleasant odor. Manufacturers are investing heavily in the research & development of customized flavors and fragrances that can fulfill the specific requirements of cosmetics producers. Furthermore, companies should promote these products in order to increase awareness about the advantages of bio-based flavors and fragrances, such as health benefits and better taste. Producers of bio-based flavors and fragrances should focus on the acquisition of ingredient manufacturing companies to expand their business, increase product portfolio, and cater to consumer demand in a competitive way. Key market players need to focus on large-scale production of bio-based flavors and fragrances in order to achieve economies of scale. Manufacturers need to focus on integration of their production and distribution channels to improve market accessibility. They should also ensure continuous supply of raw materials in order to cater to the growing demand for bio-based flavors and fragrances.
Bio-based flavors derive their aroma chemicals from plant or animal sources, including fruit, meat, fish, spices, herbs, roots, leaves, buds or bark that are distilled, fermented, or otherwise manipulated in a lab. Bio-based flavors and fragrances are derived by mixing and blending of natural ingredients. Extensive applications of bio-based flavors and fragrances enhance the taste and appeal of food, beverages, and other consumer products, which is estimated to drive market growth. Fragrances are applied to impart desired scents to a wide range of consumer products such as perfumes, soaps and laundry detergents.
Microbes are also used to produce aromas and fragrances. Microbial flavors and fragrances synthesis is based on de novo microbial processes (fermentation) or on bioconversions of natural precursors using microbial cells or enzymes.
Increasing flavor inspiration among customers has propelled the demand for vibrant flavors and more palatable drinks in the market, which has generated various new concepts in the beverage industry, including functional beverages, infused beverages, flavored water, and fusion beverages. Citrus flavors are gaining traction among consumers with their nutritional value and vibrant flavor and therefore, top beverage companies are using citrus flavors to innovate their offerings.
A recent survey carried out by Koninklijke DSM N.V., a science-based company active in health, nutrition, and sustainable living, revealed that more than half (55%) urban consumers’ believe a ‘natural or fresh’ flavor makes food taste delicious. This consumer demand for fresh and natural tastes poses a challenge for food producers, as they have to meet these taste expectations without forfeiting convenience and comprehensible labeling.
Currently, fresh, authentic, and natural taste experiences are driving consumer demand around the world. Consumers prioritize authentic and natural-tasting food even in diverse markets such as China, Brazil, Poland, and India. Therefore, large food and beverage manufacturers are updating their inventories with more products having a tint of fruity flavor. This is estimated to propel the flavors and fragrances market significantly.
Increased awareness about the environment among the population and a rise in the demand for an environment-friendly products have fueled the bio-based or biotechnological flavors and fragrances market. Demand for eco-friendly products across industries gathers strength and companies focus on the development of more effective varieties of bio-based or sustainable flavors and fragrances.
Adoption of bio-based ingredients for skin and sun care cosmetic products has been at a high, globally, due to a rise in the demand for clean label beauty products and an increase in health-consciousness among consumers.
Several certifying bodies such as Soil Association (UK), BDIH (Germany), Ecocert (France), Nature, and Nordic Swan, offer a unified identity to bio-based and natural ingredients and finished products in the cosmetics and personal care market space. Bio-based flavors and fragrances are utilized as an organic compounds in the manufacturing of shampoos, detergents, and various pharmaceutical products, as they can dissolve in various alcohols.
Growing modernization in developing economies has augmented the demand for perfumes, cosmetics, toiletries, soaps, and detergents. Furthermore, a rise in preference for organic ingredients in the personal care sector drives the demand for natural fragrances, as they are perceived to be healthier, safe, and therapeutic when consumed.
Increase in the usage of flavors in the pharmaceutical industry is also contributing to market growth. Flavors are inactive ingredients in syrups, suspensions, chewable tablets, and gums. The added flavor overcomes the bitter taste of medicine, which makes it more edible, and transmits a beneficial therapeutic effect.
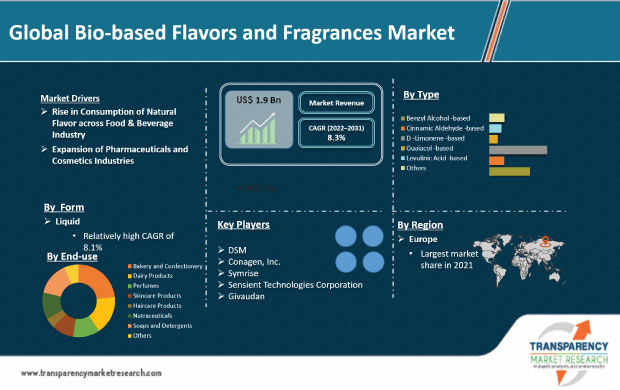
In terms of type, the global bio-based flavors and fragrances market has been divided into Benzyl alcohol-based, cinnamic aldehyde-based, D limonene-based, guaiacol-based, levulinic acid-based, and others. The D limonene-based segment was valued at US$ 507.7 Mn and held the largest share, of 26.2%, in 2021. Among the various types of bio-based flavors and fragrances, D-limonene is typically present in the peel of citrus fruits such as organs, lemons, and mandarin. It’s manufactured with the help of distillation or extraction process. Traditionally, the organic solvent has been used for home health remedies and for the last few years, it is utilized in diverse applications in various industry verticals such as pharmaceuticals, food processing, and other industrial purposes.
The global bio-based flavors and fragrances market demand analysis reveals that Europe held the largest share of more than 31%, in terms of volume, of the global market in 2021. The market in the region is expected to grow at a CAGR of more than 8.5% during the forecast period. The key reason behind this is the large demand from food & beverage manufacturers and uptake in considerable quantities for the manufacture of fine fragrances and cosmetics in the region. Demand for flavors for usage in liquor-based drinks has also increased significantly in the last few years, which is expected to further drive the bio-based flavors and fragrances market share held by Europe.
The market in Asia Pacific is dominated by China. The market in India and Rest of Asia Pacific is expected to grow at a rapid pace, owing to a surge in the demand for flavored products in these countries. Additionally, the development of the pharmaceutical industry in the region is expected to provide traction for the market. North America, on the other hand, is expected to witness median growth in the market. The market has reached the maturity phase in the region; however, demand for sodas and canned cocktails, is expected to offer significantly opportunity for the market in the near future.
In Latin America, demand for flavors and fragrances for the manufacture of local beverages has surged in the last few years. Furthermore, home & floor care products are also in demand in the region owing to rising regional health concerns in the last few years. The market in the Middle East & Africa, on the other hand, is expected to grow at a considerable pace due to the heavy demand for cosmetics and fine fragrances applications in the region.
The global bio-based flavors and fragrances market is highly consolidated, with a small number of small-scale vendors controlling majority of the share. Most bio-based flavors and fragrances companies are investing significantly in comprehensive research and development activities, primarily to create environmentally-friendly products. Expansion of product portfolios and mergers and acquisitions are prominent strategies adopted by key players. DSM, Conagen, Inc., Symrise, Sensient Technologies Corporation, Givaudan S.A., International Flavors & Fragrances, Inc., ADM, Takasago International Corporation, Sensient Technologies Corporation, T. Hasegawa Co., Ltd., Robertet Group, Firmenich S.A. and Evolva Holding SA are the key entities operating in this market.
Each of these players has been profiled in the bio-based Flavors and fragrances market report based on parameters such as company overview, financial overview, business strategies, product portfolio, business segments, and recent developments
|
Attribute |
Detail |
|
Market Size Value in 2022 |
US$ 1.9 Bn |
|
Market Forecast Value in 2031 |
US$ 4.5 Bn |
|
Growth Rate (CAGR) |
8.3% |
|
Forecast Period |
2022–2031 |
|
Historical Data Available for |
2020 |
|
Quantitative Units |
US$ Bn for Value and Kilo Tons for Volume |
|
Market Analysis |
It includes cross-segment analysis at the global as well as regional level. Furthermore, the qualitative analysis includes drivers, restraints, opportunities, key trends, Porter’s Five Forces analysis, value chain analysis, and key trend analysis. |
|
Competition Landscape |
|
|
Format |
Electronic (PDF) + Excel |
|
Market Segmentation |
|
|
Regions Covered |
|
|
Countries Covered |
|
|
Companies Profiled |
|
|
Customization Scope |
Available upon request |
|
Pricing |
Available upon request |
The bio-based flavors and fragrances market stood at US$ 1.9 Bn in 2021.
The bio-based flavors and fragrances market is expected to grow at a CAGR of 8.3% from 2022 to 2031.
Rise in consumption of natural flavor across food and beverage industry and expansion of pharmaceuticals and cosmetics industries.
The liquid segment accounted for a major value share of 44.4%, of the bio-based flavors and fragrances market in 2021.
Europe is a more attractive region for vendors and held 31% share of the global bio-based flavors and fragrances market in 2021.
DSM, Conagen, Inc., Symrise, Sensient Technologies Corporation, and Givaudan.
1. Executive Summary
1.1. Bio-based Flavors and Fragrances Market Snapshot
1.2. Current Market and Future Potential
2. Market Overview
2.1. Market Segmentation
2.2. Market Trends
2.3. Market Dynamics
2.3.1. Drivers
2.3.2. Restraints
2.3.3. Opportunities
2.4. Porter’s Five Forces Analysis
2.5. Regulatory Analysis
2.6. Value Chain Analysis
2.6.1. List of Bio-based Flavors and Fragrances Manufacturers
2.6.2. List of Dealers/Distributors
2.6.3. List of Potential Customers
3. COVID-19 Impact Analysis
4. Global Bio-based Flavors and Fragrances Market Analysis and Forecast, by Form, 2022–2031
4.1. Introduction and Definitions
4.2. Global Bio-based Flavors and Fragrances Market Volume (Kilo Tons) and Value (US$ Bn) Forecast, by Form, 2022–2031
4.2.1. Powder
4.2.2. Liquid
4.2.3. Paste
4.3. Global Bio-based Flavors and Fragrances Market Attractiveness, by Form
5. Global Bio-based Flavors and Fragrances Market Analysis and Forecast, by Type, 2022–2031
5.1. Introduction and Definitions
5.2. Global Bio-based Flavors and Fragrances Market Volume (Kilo Tons) and Value (US$ Bn) Forecast, by Type, 2022–2031
5.2.1. Benzyl Alcohol -based
5.2.2. Cinnamic Aldehyde -based
5.2.3. D -Limonene -based
5.2.4. Guaiacol -based
5.2.5. Levulinic Acid -based
5.2.6. Others
5.3. Global Bio-based Flavors and Fragrances Market Attractiveness, by Type
6. Global Bio-based Flavors and Fragrances Market Analysis and Forecast, Application, 2022–2031
6.1. Introduction and Definitions
6.2. Global Bio-based Flavors and Fragrances Market Volume (Kilo Tons) and Value (US$ Bn) Forecast, by Application, 2022–2031
6.2.1. Bakery and Confectionery
6.2.2. Dairy Products
6.2.3. Perfumes
6.2.4. Skincare Products
6.2.5. Haircare Products
6.2.6. Nutraceuticals
6.2.7. Soaps and Detergents
6.2.8. Others
6.3. Global Bio-based Flavors and Fragrances Market Attractiveness, by Application
7. Global Bio-based Flavors and Fragrances Market Analysis and Forecast, End-use, 2022–2031
7.1. Introduction and Definitions
7.2. Global Bio-based Flavors and Fragrances Market Volume (Kilo Tons) and Value (US$ Bn) Forecast, by End-use, 2022–2031
7.2.1. Food and Beverage
7.2.2. Cosmetics and Personal Care
7.2.3. Pharmaceutical
7.2.4. Consumer Products
7.2.5. Others
7.3. Global Bio-based Flavors and Fragrances Market Attractiveness, by End-use
8. Global Bio-based Flavors and Fragrances Market Analysis and Forecast, by Region, 2022–2031
8.1. Key Findings
8.2. Global Bio-based Flavors and Fragrances Market Volume (Kilo Tons) and Value (US$ Bn) Forecast, by Region, 2022–2031
8.2.1. North America
8.2.2. Europe
8.2.3. Asia Pacific
8.2.4. Latin America
8.2.5. Middle East & Africa
8.3. Global Bio-based Flavors and Fragrances Market Attractiveness, by Region
9. North America Bio-based Flavors and Fragrances Market Analysis and Forecast, 2022–2031
9.1. Key Findings
9.2. North America Bio-based Flavors and Fragrances Market Volume (Kilo Tons) and Value (US$ Bn) Forecast, by Form, 2022–2031
9.3. North America Bio-based Flavors and Fragrances Market Volume (Kilo Tons) and Value (US$ Bn) Forecast, by Type, 2022–2031
9.4. North America Bio-based Flavors and Fragrances Market Volume (Kilo Tons) and Value (US$ Bn) Forecast, by Application, 2022–2031
9.5. North America Bio-based Flavors and Fragrances Market Volume (Kilo Tons) and Value (US$ Bn) Forecast, by End-use, 2022–2031
9.6. North America Bio-based Flavors and Fragrances Market Volume (Kilo Tons) and Value (US$ Bn) Forecast, by Country, 2022–2031
9.6.1. U.S. Bio-based Flavors and Fragrances Market Volume (Kilo Tons) and Value (US$ Bn) Forecast, by Form, 2022–2031
9.6.2. U.S. Bio-based Flavors and Fragrances Market Volume (Kilo Tons) and Value (US$ Bn) Forecast, by Type, 2022–2031
9.6.3. U.S. Bio-based Flavors and Fragrances Market Volume (Kilo Tons) and Value (US$ Bn) Forecast, by Application, 2022–2031
9.6.4. U.S. Bio-based Flavors and Fragrances Market Volume (Kilo Tons) and Value (US$ Bn) Forecast, End-use, 2022–2031
9.6.5. Canada Bio-based Flavors and Fragrances Market Volume (Kilo Tons) and Value (US$ Bn) Forecast, by Form, 2022–2031
9.6.6. Canada Bio-based Flavors and Fragrances Market Volume (Kilo Tons) and Value (US$ Bn) Forecast, by Type, 2022–2031
9.6.7. Canada Bio-based Flavors and Fragrances Market Volume (Kilo Tons) and Value (US$ Bn) Forecast, by Application, 2022–2031
9.6.8. Canada Bio-based Flavors and Fragrances Market Volume (Kilo Tons) and Value (US$ Bn) Forecast, End-use, 2022–2031
9.7. North America Bio-based Flavors and Fragrances Market Attractiveness Analysis
10. Europe Bio-based Flavors and Fragrances Market Analysis and Forecast, 2022–2031
10.1. Key Findings
10.2. Europe Bio-based Flavors and Fragrances Market Volume (Kilo Tons) and Value (US$ Bn) Forecast, by Form, 2022–2031
10.3. Europe Bio-based Flavors and Fragrances Market Volume (Kilo Tons) and Value (US$ Bn) Forecast, by Type, 2022–2031
10.4. Europe Bio-based Flavors and Fragrances Market Volume (Kilo Tons) and Value (US$ Bn) Forecast, by Application, 2022–2031
10.5. Europe Bio-based Flavors and Fragrances Market Volume (Kilo Tons) and Value (US$ Bn) Forecast, by End-use, 2022–2031
10.6. Europe Bio-based Flavors and Fragrances Market Volume (Kilo Tons) and Value (US$ Bn) Forecast, by Country and Sub-region, 2021-2031
10.6.1. Germany Bio-based Flavors and Fragrances Market Volume (Kilo Tons) and Value (US$ Bn) Forecast, by Form, 2022–2031
10.6.2. Germany Bio-based Flavors and Fragrances Market Volume (Kilo Tons) and Value (US$ Bn) Forecast, by Type, 2022–2031
10.6.3. Germany Bio-based Flavors and Fragrances Market Volume (Kilo Tons) and Value (US$ Bn) Forecast, by Application, 2022–2031
10.6.4. Germany. Bio-based Flavors and Fragrances Market Volume (Kilo Tons) and Value (US$ Bn) Forecast, End-use, 2022–2031
10.6.5. France Bio-based Flavors and Fragrances Market Volume (Kilo Tons) and Value (US$ Bn) Forecast, by Form, 2022–2031
10.6.6. France Bio-based Flavors and Fragrances Market Volume (Kilo Tons) and Value (US$ Bn) Forecast, by Type, 2022–2031
10.6.7. France Bio-based Flavors and Fragrances Market Volume (Kilo Tons) and Value (US$ Bn) Forecast, by Application, 2022–2031
10.6.8. France. Bio-based Flavors and Fragrances Market Volume (Kilo Tons) and Value (US$ Bn) Forecast, End-use, 2022–2031
10.6.9. U.K. Bio-based Flavors and Fragrances Market Volume (Kilo Tons) and Value (US$ Bn) Forecast, by Form, 2022–2031
10.6.10. U.K. Bio-based Flavors and Fragrances Market Volume (Kilo Tons) and Value (US$ Bn) Forecast, by Type, 2022–2031
10.6.11. U.K. Bio-based Flavors and Fragrances Market Volume (Kilo Tons) and Value (US$ Bn) Forecast, by Application, 2022–2031
10.6.12. U.K. Bio-based Flavors and Fragrances Market Volume (Kilo Tons) and Value (US$ Bn) Forecast, End-use, 2022–2031
10.6.13. Italy Bio-based Flavors and Fragrances Market Volume (Kilo Tons) and Value (US$ Bn) Forecast, by Form, 2022–2031
10.6.14. Italy. Bio-based Flavors and Fragrances Market Volume (Kilo Tons) and Value (US$ Bn) Forecast, by Type, 2022–2031
10.6.15. Italy Bio-based Flavors and Fragrances Market Volume (Kilo Tons) and Value (US$ Bn) Forecast, by Application, 2022–2031
10.6.16. Italy Bio-based Flavors and Fragrances Market Volume (Kilo Tons) and Value (US$ Bn) Forecast, End-use, 2022–2031
10.6.17. Spain Bio-based Flavors and Fragrances Market Volume (Kilo Tons) and Value (US$ Bn) Forecast, by Form, 2022–2031
10.6.18. Spain. Bio-based Flavors and Fragrances Market Volume (Kilo Tons) and Value (US$ Bn) Forecast, by Type, 2022–2031
10.6.19. Italy Bio-based Flavors and Fragrances Market Volume (Kilo Tons) and Value (US$ Bn) Forecast, by Application, 2021– Spain
10.6.20. Spain Bio-based Flavors and Fragrances Market Volume (Kilo Tons) and Value (US$ Bn) Forecast, End-use, 2022–2031
10.6.21. Russia & CIS Bio-based Flavors and Fragrances Market Volume (Kilo Tons) and Value (US$ Bn) Forecast, by Form, 2022–2031
10.6.22. Russia & CIS Bio-based Flavors and Fragrances Market Volume (Kilo Tons) and Value (US$ Bn) Forecast, by Type, 2022–2031
10.6.23. Russia & CIS Bio-based Flavors and Fragrances Market Volume (Kilo Tons) and Value (US$ Bn) Forecast, by Application, 2022–2031
10.6.24. Russia & CIS Bio-based Flavors and Fragrances Market Volume (Kilo Tons) and Value (US$ Bn) Forecast, End-use, 2022–2031
10.6.25. Rest of Europe Bio-based Flavors and Fragrances Market Volume (Kilo Tons) and Value (US$ Bn) Forecast, by Form, 2022–2031
10.6.26. Rest of Europe Bio-based Flavors and Fragrances Market Volume (Kilo Tons) and Value (US$ Bn) Forecast, by Type, 2022–2031
10.6.27. Rest of Europe Bio-based Flavors and Fragrances Market Volume (Kilo Tons) and Value (US$ Bn) Forecast, by Application, 2022–2031
10.6.28. Rest of Europe Bio-based Flavors and Fragrances Market Volume (Kilo Tons) and Value (US$ Bn) Forecast, End-use, 2022–2031
10.7. Europe Bio-based Flavors and Fragrances Market Attractiveness Analysis
11. Asia Pacific Bio-based Flavors and Fragrances Market Analysis and Forecast, 2022–2031
11.1. Key Findings
11.2. Asia Pacific Bio-based Flavors and Fragrances Market Volume (Kilo Tons) and Value (US$ Bn) Forecast, by Form
11.3. Asia Pacific Bio-based Flavors and Fragrances Market Volume (Kilo Tons) and Value (US$ Bn) Forecast, by Type, 2022–2031
11.4. Asia Pacific Bio-based Flavors and Fragrances Market Volume (Kilo Tons) and Value (US$ Bn) Forecast, by Application, 2022–2031
11.5. Asia Pacific Bio-based Flavors and Fragrances Market Volume (Kilo Tons) and Value (US$ Bn) Forecast, by End-use, 2022–2031
11.6. Asia Pacific Bio-based Flavors and Fragrances Market Volume (Kilo Tons) and Value (US$ Bn) Forecast, by Country and Sub-region, 2021-2031
11.6.1. China Bio-based Flavors and Fragrances Market Volume (Kilo Tons) and Value (US$ Bn) Forecast, by Form, 2022–2031
11.6.2. China Bio-based Flavors and Fragrances Market Volume (Kilo Tons) and Value (US$ Bn) Forecast, by Type, 2022–2031
11.6.3. China Bio-based Flavors and Fragrances Market Volume (Kilo Tons) and Value (US$ Bn) Forecast, by Application, 2022–2031
11.6.4. China Bio-based Flavors and Fragrances Market Volume (Kilo Tons) and Value (US$ Bn) Forecast, End-use, 2022–2031
11.6.5. Japan Bio-based Flavors and Fragrances Market Volume (Kilo Tons) and Value (US$ Bn) Forecast, by Form, 2022–2031
11.6.6. Japan Bio-based Flavors and Fragrances Market Volume (Kilo Tons) and Value (US$ Bn) Forecast, by Type, 2022–2031
11.6.7. Japan Bio-based Flavors and Fragrances Market Volume (Kilo Tons) and Value (US$ Bn) Forecast, by Application, 2022–2031
11.6.8. Japan Bio-based Flavors and Fragrances Market Volume (Kilo Tons) and Value (US$ Bn) Forecast, End-use, 2022–2031
11.6.9. India Bio-based Flavors and Fragrances Market Volume (Kilo Tons) and Value (US$ Bn) Forecast, by Form, 2022–2031
11.6.10. India Bio-based Flavors and Fragrances Market Volume (Kilo Tons) and Value (US$ Bn) Forecast, by Type, 2022–2031
11.6.11. India Bio-based Flavors and Fragrances Market Volume (Kilo Tons) and Value (US$ Bn) Forecast, by Application, 2022–2031
11.6.12. India Bio-based Flavors and Fragrances Market Volume (Kilo Tons) and Value (US$ Bn) Forecast, End-use, 2022–2031
11.6.13. ASEAN Bio-based Flavors and Fragrances Market Volume (Kilo Tons) and Value (US$ Bn) Forecast, by Form, 2022–2031
11.6.14. ASEAN Bio-based Flavors and Fragrances Market Volume (Kilo Tons) and Value (US$ Bn) Forecast, by Type, 2022–2031
11.6.15. ASEAN Bio-based Flavors and Fragrances Market Volume (Kilo Tons) and Value (US$ Bn) Forecast, by Application, 2022–2031
11.6.16. ASEAN Bio-based Flavors and Fragrances Market Volume (Kilo Tons) and Value (US$ Bn) Forecast, End-use, 2022–2031
11.6.17. Rest of Asia Pacific Bio-based Flavors and Fragrances Market Volume (Kilo Tons) and Value (US$ Bn) Forecast, by Form, 2022–2031
11.6.18. Rest of Asia Pacific Bio-based Flavors and Fragrances Market Volume (Kilo Tons) and Value (US$ Bn) Forecast, by Type, 2022–2031
11.6.19. Rest of Asia Pacific Bio-based Flavors and Fragrances Market Volume (Kilo Tons) and Value (US$ Bn) Forecast, by Application, 2022–2031
11.6.20. Rest of Asia Pacific Bio-based Flavors and Fragrances Market Volume (Kilo Tons) and Value (US$ Bn) Forecast, End-use, 2022–2031
11.7. Asia Pacific Bio-based Flavors and Fragrances Market Attractiveness Analysis
12. Latin America Bio-based Flavors and Fragrances Market Analysis and Forecast, 2022–2031
12.1. Key Findings
12.2. Latin America Bio-based Flavors and Fragrances Market Volume (Kilo Tons) and Value (US$ Bn) Forecast, by Form, 2022–2031
12.3. Latin America Bio-based Flavors and Fragrances Market Volume (Kilo Tons) and Value (US$ Bn) Forecast, by Type, 2022–2031
12.4. Latin America Bio-based Flavors and Fragrances Market Volume (Kilo Tons) and Value (US$ Bn) Forecast, by Application, 2022–2031
12.5. Latin America Bio-based Flavors and Fragrances Market Volume (Kilo Tons) and Value (US$ Bn) Forecast, by End-use, 2022–2031
12.6. Latin America Bio-based Flavors and Fragrances Market Volume (Kilo Tons) and Value (US$ Bn) Forecast, by Country and Sub-region, 2021-2031
12.6.1. Brazil Bio-based Flavors and Fragrances Market Volume (Kilo Tons) and Value (US$ Bn) Forecast, by Form, 2022–2031
12.6.2. Brazil Bio-based Flavors and Fragrances Market Volume (Kilo Tons) and Value (US$ Bn) Forecast, by Type, 2022–2031
12.6.3. Brazil Bio-based Flavors and Fragrances Market Volume (Kilo Tons) and Value (US$ Bn) Forecast, by Application, 2022–2031
12.6.4. Brazil Bio-based Flavors and Fragrances Market Volume (Kilo Tons) and Value (US$ Bn) Forecast, End-use, 2022–2031
12.6.5. Mexico Bio-based Flavors and Fragrances Market Volume (Kilo Tons) and Value (US$ Bn) Forecast, by Form, 2022–2031
12.6.6. Mexico Bio-based Flavors and Fragrances Market Volume (Kilo Tons) and Value (US$ Bn) Forecast, by Type, 2022–2031
12.6.7. Mexico Bio-based Flavors and Fragrances Market Volume (Kilo Tons) and Value (US$ Bn) Forecast, by Application, 2022–2031
12.6.8. Mexico Bio-based Flavors and Fragrances Market Volume (Kilo Tons) and Value (US$ Bn) Forecast, End-use, 2022–2031
12.6.9. Rest of Latin America Bio-based Flavors and Fragrances Market Volume (Kilo Tons) and Value (US$ Bn) Forecast, by Form, 2022–2031
12.6.10. Rest of Latin America Bio-based Flavors and Fragrances Market Volume (Kilo Tons) and Value (US$ Bn) Forecast, by Type, 2022–2031
12.6.11. Rest of Latin America Bio-based Flavors and Fragrances Market Volume (Kilo Tons) and Value (US$ Bn) Forecast, by Application, 2022–2031
12.6.12. Rest of Latin America Bio-based Flavors and Fragrances Market Volume (Kilo Tons) and Value (US$ Bn) Forecast, End-use, 2022–2031
12.7. Latin America Bio-based Flavors and Fragrances Market Attractiveness Analysis
13. Middle East & Africa Bio-based Flavors and Fragrances Market Analysis and Forecast, 2022–2031
13.1. Key Findings
13.2. Middle East & Africa Bio-based Flavors and Fragrances Market Volume (Kilo Tons) and Value (US$ Bn) Forecast, by Form, 2022–2031
13.3. Middle East & Africa Bio-based Flavors and Fragrances Market Volume (Kilo Tons) and Value (US$ Bn) Forecast, by Type, 2022–2031
13.4. Middle East & Africa Bio-based Flavors and Fragrances Market Volume (Kilo Tons) and Value (US$ Bn) Forecast, by Application, 2022–2031
13.5. Middle East & Africa Bio-based Flavors and Fragrances Market Volume (Kilo Tons) and Value (US$ Bn) Forecast, by End-use, 2022–2031
13.6. Middle East & Africa Bio-based Flavors and Fragrances Market Volume (Kilo Tons) and Value (US$ Bn) Forecast, by Country and Sub-region, 2021-2031
13.6.1. GCC Bio-based Flavors and Fragrances Market Volume (Kilo Tons) and Value (US$ Bn) Forecast, by Form, 2022–2031
13.6.2. GCC Bio-based Flavors and Fragrances Market Volume (Kilo Tons) and Value (US$ Bn) Forecast, by Type, 2022–2031
13.6.3. GCC Bio-based Flavors and Fragrances Market Volume (Kilo Tons) and Value (US$ Bn) Forecast, by Application, 2022–2031
13.6.4. GCC Bio-based Flavors and Fragrances Market Volume (Kilo Tons) and Value (US$ Bn) Forecast, End-use, 2022–2031
13.6.5. South Africa Bio-based Flavors and Fragrances Market Volume (Kilo Tons) and Value (US$ Bn) Forecast, by Form, 2022–2031
13.6.6. South Africa Bio-based Flavors and Fragrances Market Volume (Kilo Tons) and Value (US$ Bn) Forecast, by Type, 2022–2031
13.6.7. South Africa Bio-based Flavors and Fragrances Market Volume (Kilo Tons) and Value (US$ Bn) Forecast, by Application, 2022–2031
13.6.8. South Africa Bio-based Flavors and Fragrances Market Volume (Kilo Tons) and Value (US$ Bn) Forecast, End-use, 2022–2031
13.6.9. Rest of Middle East & Africa Bio-based Flavors and Fragrances Market Volume (Kilo Tons) and Value (US$ Bn) Forecast, by Form, 2022–2031
13.6.10. Rest of Middle East & Africa Bio-based Flavors and Fragrances Market Volume (Kilo Tons) and Value (US$ Bn) Forecast, by Type, 2022–2031
13.6.11. Rest of Middle East & Africa Bio-based Flavors and Fragrances Market Volume (Kilo Tons) and Value (US$ Bn) Forecast, by Application, 2022–2031
13.6.12. Rest of Middle East & Africa Bio-based Flavors and Fragrances Market Volume (Kilo Tons) and Value (US$ Bn) Forecast, End-use, 2022–2031
13.7. Middle East & Africa Bio-based Flavors and Fragrances Market Attractiveness Analysis
14. Competition Landscape
14.1. Global Bio-based Flavors and Fragrances Company Market Share Analysis, 2021
14.2. Company Profiles (Details – Overview, Financials, Recent Developments, and Strategy)
14.2.1. DSM
14.2.1.1. Company Description
14.2.1.2. Business Overview
14.2.1.3. Financial Overview
14.2.1.4. Strategic Overview
14.2.2. Conagen, Inc.
14.2.2.1. Company Description
14.2.2.2. Business Overview
14.2.2.3. Financial Overview
14.2.2.4. Strategic Overview
14.2.3. Symrise
14.2.3.1. Company Description
14.2.3.2. Business Overview
14.2.3.3. Financial Overview
14.2.3.4. Strategic Overview
14.2.4. Sensient Technologies Corporation
14.2.4.1. Company Description
14.2.4.2. Business Overview
14.2.4.3. Financial Overview
14.2.4.4. Strategic Overview
14.2.5. Givaudan S.A.
14.2.5.1. Company Description
14.2.5.2. Business Overview
14.2.5.3. Financial Overview
14.2.5.4. Strategic Overview
14.2.6. ADM
14.2.6.1. Company Description
14.2.6.2. Business Overview
14.2.6.3. Financial Overview
14.2.6.4. Strategic Overview
14.2.7. International Flavors & Fragrances, Inc.
14.2.7.1. Company Description
14.2.7.2. Business Overview
14.2.7.3. Financial Overview
14.2.7.4. Strategic Overview
14.2.8. Takasago International Corporation
14.2.8.1. Company Description
14.2.8.2. Business Overview
14.2.8.3. Financial Overview
14.2.8.4. Strategic Overview
14.2.9. T. Hasegawa Co., Ltd.
14.2.9.1. Company Description
14.2.9.2. Business Overview
14.2.9.3. Financial Overview
14.2.9.4. Strategic Overview
14.2.10. Robertet Group
14.2.10.1. Company Description
14.2.10.2. Business Overview
14.2.10.3. Financial Overview
14.2.10.4. Strategic Overview
14.2.11. Firmenich S.A.
14.2.11.1. Company Description
14.2.11.2. Business Overview
14.2.11.3. Financial Overview
14.2.11.4. Strategic Overview
14.2.12. Evolva Holding SA
14.2.12.1. Company Description
14.2.12.2. Business Overview
14.2.12.3. Financial Overview
14.2.12.4. Strategic Overview
15. Primary Research: Key Insights
16. Appendix
List of Tables
Table 1: Global Bio-based Flavors and Fragrances Market Volume (Kilo Tons) Forecast, by Form, 2022–2031
Table 2: Global Bio-based Flavors and Fragrances Market Value (US$ Bn) Forecast, by Form, 2022–2031
Table 3: Global Bio-based Flavors and Fragrances Market Volume (Kilo Tons) Forecast, by Type, 2022–2031
Table 4: Global Bio-based Flavors and Fragrances Market Value (US$ Bn) Forecast, by Type, 2022–2031
Table 5: Global Bio-based Flavors and Fragrances Market Volume (Kilo Tons) Forecast, by Application, 2022–2031
Table 6: Global Bio-based Flavors and Fragrances Market Value (US$ Bn) Forecast, by Application, 2022–2031
Table 7: Global Bio-based Flavors and Fragrances Market Volume (Kilo Tons) Forecast, by End-use, 2022–2031
Table 8: Global Bio-based Flavors and Fragrances Market Value (US$ Bn) Forecast, by End-use, 2022–2031
Table 9: Global Bio-based Flavors and Fragrances Market Volume (Kilo Tons) Forecast, by Region, 2022–2031
Table 10: Global Bio-based Flavors and Fragrances Market Value (US$ Bn) Forecast, by Region, 2022–2031
Table 11: North America Bio-based Flavors and Fragrances Market Volume (Kilo Tons) Forecast, by Form, 2022–2031
Table 12: North America Bio-based Flavors and Fragrances Market Value (US$ Bn) Forecast, by Form, 2022–2031
Table 13: North America Bio-based Flavors and Fragrances Market Volume (Kilo Tons) Forecast, by Type, 2022–2031
Table 14: North America Bio-based Flavors and Fragrances Market Value (US$ Bn) Forecast, by Type, 2022–2031
Table 15: North America Bio-based Flavors and Fragrances Market Volume (Kilo Tons) Forecast, by Application, 2022–2031
Table 16: North America Bio-based Flavors and Fragrances Market Value (US$ Bn) Forecast, by Application, 2022–2031
Table 17: North America Bio-based Flavors and Fragrances Market Volume (Kilo Tons) Forecast, by End-use, 2022–2031
Table 18: North America Bio-based Flavors and Fragrances Market Value (US$ Bn) Forecast, by End-use, 2022–2031
Table 19: North America Bio-based Flavors and Fragrances Market Volume (Kilo Tons) Forecast, by Country, 2022–2031
Table 20: North America Bio-based Flavors and Fragrances Market Value (US$ Bn) Forecast, by Country, 2022–2031
Table 21: U.S. Bio-based Flavors and Fragrances Market Volume (Kilo Tons) Forecast, by Form, 2022–2031
Table 22: U.S. Bio-based Flavors and Fragrances Market Value (US$ Bn) Forecast, by Form, 2022–2031
Table 23: U.S. Bio-based Flavors and Fragrances Market Volume (Kilo Tons) Forecast, by Type, 2022–2031
Table 24: U.S. Bio-based Flavors and Fragrances Market Value (US$ Bn) Forecast, by Type, 2022–2031
Table 25: U.S. Bio-based Flavors and Fragrances Market Volume (Kilo Tons) Forecast, by Application, 2022–2031
Table 26: U.S. Bio-based Flavors and Fragrances Market Value (US$ Bn) Forecast, by Application, 2022–2031
Table 27: U.S. Bio-based Flavors and Fragrances Market Volume (Kilo Tons) Forecast, by End-use, 2022–2031
Table 28: U.S. Bio-based Flavors and Fragrances Market Value (US$ Bn) Forecast, by End-use, 2022–2031
Table 29: Canada Bio-based Flavors and Fragrances Market Volume (Kilo Tons) Forecast, by Form, 2022–2031
Table 30: Canada Bio-based Flavors and Fragrances Market Value (US$ Bn) Forecast, by Form, 2022–2031
Table 31: Canada Bio-based Flavors and Fragrances Market Volume (Kilo Tons) Forecast, by Type, 2022–2031
Table 32: Canada Bio-based Flavors and Fragrances Market Value (US$ Bn) Forecast, by Type, 2022–2031
Table 33: Canada Bio-based Flavors and Fragrances Market Volume (Kilo Tons) Forecast, by Application, 2022–2031
Table 34: Canada Bio-based Flavors and Fragrances Market Value (US$ Bn) Forecast, by Application, 2022–2031
Table 35: Canada Bio-based Flavors and Fragrances Market Volume (Kilo Tons) Forecast, by End-use, 2022–2031
Table 36: Canada Bio-based Flavors and Fragrances Market Value (US$ Bn) Forecast, by End-use 2022–2031
Table 37: Europe Bio-based Flavors and Fragrances Market Volume (Kilo Tons) Forecast, by Form, 2022–2031
Table 38: Europe Bio-based Flavors and Fragrances Market Value (US$ Bn) Forecast, by Form, 2022–2031
Table 39: Europe Bio-based Flavors and Fragrances Market Volume (Kilo Tons) Forecast, by Type, 2022–2031
Table 40: Europe Bio-based Flavors and Fragrances Market Value (US$ Bn) Forecast, by Type, 2022–2031
Table 41: Europe Bio-based Flavors and Fragrances Market Volume (Kilo Tons) Forecast, by Application, 2022–2031
Table 42: Europe Bio-based Flavors and Fragrances Market Value (US$ Bn) Forecast, by Application, 2022–2031
Table 43: Europe Bio-based Flavors and Fragrances Market Volume (Kilo Tons) Forecast, by End-use, 2022–2031
Table 44: Europe Bio-based Flavors and Fragrances Market Value (US$ Bn) Forecast, by End-use 2022–2031
Table 45: Europe Bio-based Flavors and Fragrances Market Volume (Kilo Tons) Forecast, by Country and Sub-region, 2022–2031
Table 46: Europe Bio-based Flavors and Fragrances Market Value (US$ Bn) Forecast, by Country and Sub-region, 2022–2031
Table 47: Germany Bio-based Flavors and Fragrances Market Volume (Kilo Tons) Forecast, by Form, 2022–2031
Table 48: Germany Bio-based Flavors and Fragrances Market Value (US$ Bn) Forecast, by Form, 2022–2031
Table 49: Germany Bio-based Flavors and Fragrances Market Volume (Kilo Tons) Forecast, by Type, 2022–2031
Table 50: Germany Bio-based Flavors and Fragrances Market Value (US$ Bn) Forecast, by Type, 2022–2031
Table 51: Germany Bio-based Flavors and Fragrances Market Volume (Kilo Tons) Forecast, by Application, 2022–2031
Table 52: Germany Bio-based Flavors and Fragrances Market Value (US$ Bn) Forecast, by Application, 2022–2031
Table 53: Germany Bio-based Flavors and Fragrances Market Volume (Kilo Tons) Forecast, by End-use, 2022–2031
Table 54: Germany Bio-based Flavors and Fragrances Market Value (US$ Bn) Forecast, by End-use 2022–2031
Table 55: France Bio-based Flavors and Fragrances Market Volume (Kilo Tons) Forecast, by Form, 2022–2031
Table 56: France Bio-based Flavors and Fragrances Market Value (US$ Bn) Forecast, by Form, 2022–2031
Table 57: France Bio-based Flavors and Fragrances Market Volume (Kilo Tons) Forecast, by Type, 2022–2031
Table 58: France Bio-based Flavors and Fragrances Market Value (US$ Bn) Forecast, by Type, 2022–2031
Table 59: France Bio-based Flavors and Fragrances Market Volume (Kilo Tons) Forecast, by Application, 2022–2031
Table 60: France Bio-based Flavors and Fragrances Market Value (US$ Bn) Forecast, by Application, 2022–2031
Table 61: France Bio-based Flavors and Fragrances Market Volume (Kilo Tons) Forecast, by End-use, 2022–2031
Table 62: France Bio-based Flavors and Fragrances Market Value (US$ Bn) Forecast, by End-use 2022–2031
Table 63: U.K. Bio-based Flavors and Fragrances Market Volume (Kilo Tons) Forecast, by Form, 2022–2031
Table 64: U.K. Bio-based Flavors and Fragrances Market Value (US$ Bn) Forecast, by Form, 2022–2031
Table 65: U.K. Bio-based Flavors and Fragrances Market Volume (Kilo Tons) Forecast, by Type, 2022–2031
Table 66: U.K. Bio-based Flavors and Fragrances Market Value (US$ Bn) Forecast, by Type, 2022–2031
Table 67: U.K. Bio-based Flavors and Fragrances Market Volume (Kilo Tons) Forecast, by Application, 2022–2031
Table 68: U.K. Bio-based Flavors and Fragrances Market Value (US$ Bn) Forecast, by Application, 2022–2031
Table 69: U.K. Bio-based Flavors and Fragrances Market Volume (Kilo Tons) Forecast, by End-use, 2022–2031
Table 70: U.K. Bio-based Flavors and Fragrances Market Value (US$ Bn) Forecast, by End-use 2022–2031
Table 71: Italy Bio-based Flavors and Fragrances Market Volume (Kilo Tons) Forecast, by Form, 2022–2031
Table 72: Italy Bio-based Flavors and Fragrances Market Value (US$ Bn) Forecast, by Form, 2022–2031
Table 73: Italy Bio-based Flavors and Fragrances Market Volume (Kilo Tons) Forecast, by Type, 2022–2031
Table 74: Italy Bio-based Flavors and Fragrances Market Value (US$ Bn) Forecast, by Type, 2022–2031
Table 75: Italy Bio-based Flavors and Fragrances Market Volume (Kilo Tons) Forecast, by Application, 2022–2031
Table 76: Italy Bio-based Flavors and Fragrances Market Value (US$ Bn) Forecast, by Application, 2022–2031
Table 77: Italy Bio-based Flavors and Fragrances Market Volume (Kilo Tons) Forecast, by End-use, 2022–2031
Table 78: Italy Bio-based Flavors and Fragrances Market Value (US$ Bn) Forecast, by End-use 2022–2031
Table 79: Spain Bio-based Flavors and Fragrances Market Volume (Kilo Tons) Forecast, by Form, 2022–2031
Table 80: Spain Bio-based Flavors and Fragrances Market Value (US$ Bn) Forecast, by Form, 2022–2031
Table 81: Spain Bio-based Flavors and Fragrances Market Volume (Kilo Tons) Forecast, by Type, 2022–2031
Table 82: Spain Bio-based Flavors and Fragrances Market Value (US$ Bn) Forecast, by Type, 2022–2031
Table 83: Spain Bio-based Flavors and Fragrances Market Volume (Kilo Tons) Forecast, by Application, 2022–2031
Table 84: Spain Bio-based Flavors and Fragrances Market Value (US$ Bn) Forecast, by Application, 2022–2031
Table 85: Spain Bio-based Flavors and Fragrances Market Volume (Kilo Tons) Forecast, by End-use, 2022–2031
Table 86: Spain Bio-based Flavors and Fragrances Market Value (US$ Bn) Forecast, by End-use 2022–2031
Table 87: Russia & CIS Bio-based Flavors and Fragrances Market Volume (Kilo Tons) Forecast, by Form, 2022–2031
Table 88: Russia & CIS Bio-based Flavors and Fragrances Market Value (US$ Bn) Forecast, by Form, 2022–2031
Table 89: Russia & CIS Bio-based Flavors and Fragrances Market Volume (Kilo Tons) Forecast, by Type, 2022–2031
Table 90: Russia & CIS Bio-based Flavors and Fragrances Market Value (US$ Bn) Forecast, by Type, 2022–2031
Table 91: Russia & CIS Bio-based Flavors and Fragrances Market Volume (Kilo Tons) Forecast, by Application, 2022–2031
Table 92: Russia & CIS Bio-based Flavors and Fragrances Market Value (US$ Bn) Forecast, by Application, 2022–2031
Table 93: Russia & CIS Bio-based Flavors and Fragrances Market Volume (Kilo Tons) Forecast, by End-use, 2022–2031
Table 94: Russia & CIS Bio-based Flavors and Fragrances Market Value (US$ Bn) Forecast, by End-use 2022–2031
Table 95: Rest of Europe Bio-based Flavors and Fragrances Market Volume (Kilo Tons) Forecast, by Form, 2022–2031
Table 96: Rest of Europe Bio-based Flavors and Fragrances Market Value (US$ Bn) Forecast, by Form, 2022–2031
Table 97: Rest of Europe Bio-based Flavors and Fragrances Market Volume (Kilo Tons) Forecast, by Type, 2022–2031
Table 98: Rest of Europe Bio-based Flavors and Fragrances Market Value (US$ Bn) Forecast, by Type, 2022–2031
Table 99: Rest of Europe Bio-based Flavors and Fragrances Market Volume (Kilo Tons) Forecast, by Application, 2022–2031
Table 100: Rest of Europe Bio-based Flavors and Fragrances Market Value (US$ Bn) Forecast, by Application, 2022–2031
Table 101: Rest of Europe Bio-based Flavors and Fragrances Market Volume (Kilo Tons) Forecast, by End-use, 2022–2031
Table 102: Rest of Europe Bio-based Flavors and Fragrances Market Value (US$ Bn) Forecast, by End-use 2022–2031
Table 103: Asia Pacific Bio-based Flavors and Fragrances Market Volume (Kilo Tons) Forecast, by Form, 2022–2031
Table 104: Asia Pacific Bio-based Flavors and Fragrances Market Value (US$ Bn) Forecast, by Form, 2022–2031
Table 105: Asia Pacific Bio-based Flavors and Fragrances Market Volume (Kilo Tons) Forecast, by Type, 2022–2031
Table 106: Asia Pacific Bio-based Flavors and Fragrances Market Value (US$ Bn) Forecast, by Type, 2022–2031
Table 107: Asia Pacific Bio-based Flavors and Fragrances Market Volume (Kilo Tons) Forecast, by Application, 2022–2031
Table 108: Asia Pacific Bio-based Flavors and Fragrances Market Value (US$ Bn) Forecast, by Application, 2022–2031
Table 109: Asia Pacific Bio-based Flavors and Fragrances Market Volume (Kilo Tons) Forecast, by End-use, 2022–2031
Table 110: Asia Pacific Bio-based Flavors and Fragrances Market Value (US$ Bn) Forecast, by End-use 2022–2031
Table 111: Asia Pacific Bio-based Flavors and Fragrances Market Volume (Kilo Tons) Forecast, by Country and Sub-region, 2022–2031
Table 112: Asia Pacific Bio-based Flavors and Fragrances Market Value (US$ Bn) Forecast, by Country and Sub-region, 2022–2031
Table 113: China Bio-based Flavors and Fragrances Market Volume (Kilo Tons) Forecast, by Form, 2022–2031
Table 114: China Bio-based Flavors and Fragrances Market Value (US$ Bn) Forecast, by Form 2022–2031
Table 115: China Bio-based Flavors and Fragrances Market Volume (Kilo Tons) Forecast, by Type, 2022–2031
Table 116: China Bio-based Flavors and Fragrances Market Value (US$ Bn) Forecast, by Type, 2022–2031
Table 117: China Bio-based Flavors and Fragrances Market Volume (Kilo Tons) Forecast, by Application, 2022–2031
Table 118: China Bio-based Flavors and Fragrances Market Value (US$ Bn) Forecast, by Application, 2022–2031
Table 119: China Bio-based Flavors and Fragrances Market Volume (Kilo Tons) Forecast, by End-use, 2022–2031
Table 120: China Bio-based Flavors and Fragrances Market Value (US$ Bn) Forecast, by End-use 2022–2031
Table 121: Japan Bio-based Flavors and Fragrances Market Volume (Kilo Tons) Forecast, by Form, 2022–2031
Table 122: Japan Bio-based Flavors and Fragrances Market Value (US$ Bn) Forecast, by Form, 2022–2031
Table 123: Japan Bio-based Flavors and Fragrances Market Volume (Kilo Tons) Forecast, by Type, 2022–2031
Table 124: Japan Bio-based Flavors and Fragrances Market Value (US$ Bn) Forecast, by Type, 2022–2031
Table 125: Japan Bio-based Flavors and Fragrances Market Volume (Kilo Tons) Forecast, by Application, 2022–2031
Table 126: Japan Bio-based Flavors and Fragrances Market Value (US$ Bn) Forecast, by Application, 2022–2031
Table 127: Japan Bio-based Flavors and Fragrances Market Volume (Kilo Tons) Forecast, by End-use, 2022–2031
Table 128: Japan Bio-based Flavors and Fragrances Market Value (US$ Bn) Forecast, by End-use 2022–2031
Table 129: India Bio-based Flavors and Fragrances Market Volume (Kilo Tons) Forecast, by Form, 2022–2031
Table 130: India Bio-based Flavors and Fragrances Market Value (US$ Bn) Forecast, by Form, 2022–2031
Table 131: India Bio-based Flavors and Fragrances Market Volume (Kilo Tons) Forecast, by Type, 2022–2031
Table 132: India Bio-based Flavors and Fragrances Market Value (US$ Bn) Forecast, by Type, 2022–2031
Table 133: India Bio-based Flavors and Fragrances Market Volume (Kilo Tons) Forecast, by Application, 2022–2031
Table 134: India Bio-based Flavors and Fragrances Market Value (US$ Bn) Forecast, by Application, 2022–2031
Table 135: India Bio-based Flavors and Fragrances Market Volume (Kilo Tons) Forecast, by End-use, 2022–2031
Table 136: India Bio-based Flavors and Fragrances Market Value (US$ Bn) Forecast, by End-use 2022–2031
Table 137: ASEAN Bio-based Flavors and Fragrances Market Volume (Kilo Tons) Forecast, by Form, 2022–2031
Table 138: ASEAN Bio-based Flavors and Fragrances Market Value (US$ Bn) Forecast, by Form, 2022–2031
Table 139: ASEAN Bio-based Flavors and Fragrances Market Volume (Kilo Tons) Forecast, by Type, 2022–2031
Table 140: ASEAN Bio-based Flavors and Fragrances Market Value (US$ Bn) Forecast, by Type, 2022–2031
Table 141: ASEAN Bio-based Flavors and Fragrances Market Volume (Kilo Tons) Forecast, by Application, 2022–2031
Table 142: ASEAN Bio-based Flavors and Fragrances Market Value (US$ Bn) Forecast, by Application, 2022–2031
Table 143: ASEAN Bio-based Flavors and Fragrances Market Volume (Kilo Tons) Forecast, by End-use, 2022–2031
Table 144: ASEAN Bio-based Flavors and Fragrances Market Value (US$ Bn) Forecast, by End-use 2022–2031
Table 145: Rest of Asia Pacific Bio-based Flavors and Fragrances Market Volume (Kilo Tons) Forecast, by Form, 2022–2031
Table 146: Rest of Asia Pacific Bio-based Flavors and Fragrances Market Value (US$ Bn) Forecast, by Form, 2022–2031
Table 147: Rest of Asia Pacific Bio-based Flavors and Fragrances Market Volume (Kilo Tons) Forecast, by Type, 2022–2031
Table 148: Rest of Asia Pacific Bio-based Flavors and Fragrances Market Value (US$ Bn) Forecast, by Type, 2022–2031
Table 149: Rest of Asia Pacific Bio-based Flavors and Fragrances Market Volume (Kilo Tons) Forecast, by Application, 2022–2031
Table 150: Rest of Asia Pacific Bio-based Flavors and Fragrances Market Value (US$ Bn) Forecast, by Application, 2022–2031
Table 151: Rest of Asia Pacific Bio-based Flavors and Fragrances Market Volume (Kilo Tons) Forecast, by End-use, 2022–2031
Table 152: Rest of Asia Pacific Bio-based Flavors and Fragrances Market Value (US$ Bn) Forecast, by End-use 2022–2031
Table 153: Latin America Bio-based Flavors and Fragrances Market Volume (Kilo Tons) Forecast, by Form, 2022–2031
Table 154: Latin America Bio-based Flavors and Fragrances Market Value (US$ Bn) Forecast, by Form, 2022–2031
Table 155: Latin America Bio-based Flavors and Fragrances Market Volume (Kilo Tons) Forecast, by Type, 2022–2031
Table 156: Latin America Bio-based Flavors and Fragrances Market Value (US$ Bn) Forecast, by Type, 2022–2031
Table 157: Latin America Bio-based Flavors and Fragrances Market Volume (Kilo Tons) Forecast, by Application, 2022–2031
Table 158: Latin America Bio-based Flavors and Fragrances Market Value (US$ Bn) Forecast, by Application, 2022–2031
Table 159: Latin America Bio-based Flavors and Fragrances Market Volume (Kilo Tons) Forecast, by End-use, 2022–2031
Table 160: Latin America Bio-based Flavors and Fragrances Market Value (US$ Bn) Forecast, by End-use 2022–2031
Table 161: Latin America Bio-based Flavors and Fragrances Market Volume (Kilo Tons) Forecast, by Country and Sub-region, 2022–2031
Table 162: Latin America Bio-based Flavors and Fragrances Market Value (US$ Bn) Forecast, by Country and Sub-region, 2022–2031
Table 163: Brazil Bio-based Flavors and Fragrances Market Volume (Kilo Tons) Forecast, by Form, 2022–2031
Table 164: Brazil Bio-based Flavors and Fragrances Market Value (US$ Bn) Forecast, by Form, 2022–2031
Table 165: Brazil Bio-based Flavors and Fragrances Market Volume (Kilo Tons) Forecast, by Type, 2022–2031
Table 166: Brazil Bio-based Flavors and Fragrances Market Value (US$ Bn) Forecast, by Type, 2022–2031
Table 167: Brazil Bio-based Flavors and Fragrances Market Volume (Kilo Tons) Forecast, by Application, 2022–2031
Table 168: Brazil Bio-based Flavors and Fragrances Market Value (US$ Bn) Forecast, by Application, 2022–2031
Table 169: Brazil Bio-based Flavors and Fragrances Market Volume (Kilo Tons) Forecast, by End-use, 2022–2031
Table 170: Brazil Bio-based Flavors and Fragrances Market Value (US$ Bn) Forecast, by End-use 2022–2031
Table 171: Mexico Bio-based Flavors and Fragrances Market Volume (Kilo Tons) Forecast, by Form, 2022–2031
Table 172: Mexico Bio-based Flavors and Fragrances Market Value (US$ Bn) Forecast, by Form, 2022–2031
Table 173: Mexico Bio-based Flavors and Fragrances Market Volume (Kilo Tons) Forecast, by Type, 2022–2031
Table 174: Mexico Bio-based Flavors and Fragrances Market Value (US$ Bn) Forecast, by Type, 2022–2031
Table 175: Mexico Bio-based Flavors and Fragrances Market Volume (Kilo Tons) Forecast, by Application, 2022–2031
Table 176: Mexico Bio-based Flavors and Fragrances Market Value (US$ Bn) Forecast, by Application, 2022–2031
Table 177: Mexico Bio-based Flavors and Fragrances Market Volume (Kilo Tons) Forecast, by End-use, 2022–2031
Table 178: Mexico Bio-based Flavors and Fragrances Market Value (US$ Bn) Forecast, by End-use 2022–2031
Table 179: Rest of Latin America Bio-based Flavors and Fragrances Market Volume (Kilo Tons) Forecast, by Form, 2022–2031
Table 180: Rest of Latin America Bio-based Flavors and Fragrances Market Value (US$ Bn) Forecast, by Form, 2022–2031
Table 181: Rest of Latin America Bio-based Flavors and Fragrances Market Volume (Kilo Tons) Forecast, by Type, 2022–2031
Table 182: Rest of Latin America Bio-based Flavors and Fragrances Market Value (US$ Bn) Forecast, by Type, 2022–2031
Table 183: Rest of Latin America Bio-based Flavors and Fragrances Market Volume (Kilo Tons) Forecast, by Application, 2022–2031
Table 184: Rest of Latin America Bio-based Flavors and Fragrances Market Value (US$ Bn) Forecast, by Application, 2022–2031
Table 185: Rest of Latin America Bio-based Flavors and Fragrances Market Volume (Kilo Tons) Forecast, by End-use, 2022–2031
Table 186: Rest of Latin America Bio-based Flavors and Fragrances Market Value (US$ Bn) Forecast, by End-use 2022–2031
Table 187: Middle East & Africa Bio-based Flavors and Fragrances Market Volume (Kilo Tons) Forecast, by Form, 2022–2031
Table 188: Middle East & Africa Bio-based Flavors and Fragrances Market Value (US$ Bn) Forecast, by Form, 2022–2031
Table 189: Middle East & Africa Bio-based Flavors and Fragrances Market Volume (Kilo Tons) Forecast, by Type, 2022–2031
Table 190: Middle East & Africa Bio-based Flavors and Fragrances Market Value (US$ Bn) Forecast, by Type, 2022–2031
Table 191: Middle East & Africa Bio-based Flavors and Fragrances Market Volume (Kilo Tons) Forecast, by Application, 2022–2031
Table 192: Middle East & Africa Bio-based Flavors and Fragrances Market Value (US$ Bn) Forecast, by Application, 2022–2031
Table 193: v Bio-based Flavors and Fragrances Market Volume (Kilo Tons) Forecast, by End-use, 2022–2031
Table 194: Middle East & Africa Bio-based Flavors and Fragrances Market Value (US$ Bn) Forecast, by End-use 2022–2031
Table 195: Middle East & Africa Bio-based Flavors and Fragrances Market Volume (Kilo Tons) Forecast, by Country and Sub-region, 2022–2031
Table 196: Middle East & Africa Bio-based Flavors and Fragrances Market Value (US$ Bn) Forecast, by Country and Sub-region, 2022–2031
Table 197: GCC Bio-based Flavors and Fragrances Market Volume (Kilo Tons) Forecast, by Form, 2022–2031
Table 198: GCC Bio-based Flavors and Fragrances Market Value (US$ Bn) Forecast, by Form, 2022–2031
Table 199: GCC Bio-based Flavors and Fragrances Market Volume (Kilo Tons) Forecast, by Type, 2022–2031
Table 200: GCC Bio-based Flavors and Fragrances Market Value (US$ Bn) Forecast, by Type, 2022–2031
Table 201: GCC Bio-based Flavors and Fragrances Market Volume (Kilo Tons) Forecast, by Application, 2022–2031
Table 202: GCC Bio-based Flavors and Fragrances Market Value (US$ Bn) Forecast, by Application, 2022–2031
Table 203: GCC Bio-based Flavors and Fragrances Market Volume (Kilo Tons) Forecast, by End-use, 2022–2031
Table 204: GCC Bio-based Flavors and Fragrances Market Value (US$ Bn) Forecast, by End-use 2022–2031
Table 205: South Africa Bio-based Flavors and Fragrances Market Volume (Kilo Tons) Forecast, by Form, 2022–2031
Table 206: South Africa Bio-based Flavors and Fragrances Market Value (US$ Bn) Forecast, by Form, 2022–2031
Table 207: South Africa Bio-based Flavors and Fragrances Market Volume (Kilo Tons) Forecast, by Type, 2022–2031
Table 208: South Africa Bio-based Flavors and Fragrances Market Value (US$ Bn) Forecast, by Type, 2022–2031
Table 209: South Africa Bio-based Flavors and Fragrances Market Volume (Kilo Tons) Forecast, by Application, 2022–2031
Table 210: South Africa Bio-based Flavors and Fragrances Market Value (US$ Bn) Forecast, by Application, 2022–2031
Table 211: South Africa Bio-based Flavors and Fragrances Market Volume (Kilo Tons) Forecast, by End-use, 2022–2031
Table 212: South Africa Bio-based Flavors and Fragrances Market Value (US$ Bn) Forecast, by End-use 2022–2031
Table 213: Rest of Middle East & Africa Bio-based Flavors and Fragrances Market Volume (Kilo Tons) Forecast, by Form, 2022–2031
Table 214: Rest of Middle East & Africa Bio-based Flavors and Fragrances Market Value (US$ Bn) Forecast, by Form, 2022–2031
Table 215: Rest of Middle East & Africa Bio-based Flavors and Fragrances Market Volume (Kilo Tons) Forecast, by Type, 2022–2031
Table 216: Rest of Middle East & Africa Bio-based Flavors and Fragrances Market Value (US$ Bn) Forecast, by Type, 2022–2031
Table 217: Rest of Middle East & Africa Bio-based Flavors and Fragrances Market Volume (Kilo Tons) Forecast, by Application, 2022–2031
Table 218: Rest of Middle East & Africa Bio-based Flavors and Fragrances Market Value (US$ Bn) Forecast, by Application, 2022–2031
Table 219: Rest of Middle East & Africa Bio-based Flavors and Fragrances Market Volume (Kilo Tons) Forecast, by End-use, 2022–2031
Table 220: Rest of Middle East & Africa Bio-based Flavors and Fragrances Market Value (US$ Bn) Forecast, by End-use 2022–2031
List of Figures
Figure 1: Global Bio-based Flavors and Fragrances Market Volume Share Analysis, by Form, 2021, 2025, and 2031
Figure 2: Global Bio-based Flavors and Fragrances Market Attractiveness, by Form
Figure 3: Global Bio-based Flavors and Fragrances Market Volume Share Analysis, by Type, 2021, 2025, and 2031
Figure 4: Global Bio-based Flavors and Fragrances Market Attractiveness, by Type
Figure 5: Global Bio-based Flavors and Fragrances Market Volume Share Analysis, by Application, 2021, 2025, and 2031
Figure 6: Global Bio-based Flavors and Fragrances Market Attractiveness, by Application
Figure 7: Global Bio-based Flavors and Fragrances Market Volume Share Analysis, by End-use, 2021, 2025, and 2031
Figure 8: Global Bio-based Flavors and Fragrances Market Attractiveness, by End-use
Figure 9: Global Bio-based Flavors and Fragrances Market Volume Share Analysis, by Region, 2021, 2025, and 2031
Figure 10: Global Bio-based Flavors and Fragrances Market Attractiveness, by Region
Figure 11: North America Bio-based Flavors and Fragrances Market Volume Share Analysis, by Form, 2021, 2025, and 2031
Figure 12: North America Bio-based Flavors and Fragrances Market Attractiveness, by Form
Figure 13: North America Bio-based Flavors and Fragrances Market Attractiveness, by Form
Figure 14: North America Bio-based Flavors and Fragrances Market Volume Share Analysis, by Type, 2021, 2025, and 2031
Figure 15: North America Bio-based Flavors and Fragrances Market Attractiveness, by Type
Figure 16: North America Bio-based Flavors and Fragrances Market Volume Share Analysis, by Application, 2021, 2025, and 2031
Figure 17: North America Bio-based Flavors and Fragrances Market Attractiveness, by Application
Figure 18: North America Bio-based Flavors and Fragrances Market Volume Share Analysis, by End-use, 2021, 2025, and 2031
Figure 19: North America Bio-based Flavors and Fragrances Market Attractiveness, by End-use
Figure 20: North America Bio-based Flavors and Fragrances Market Attractiveness, by Country and Sub-region
Figure 21: Europe Bio-based Flavors and Fragrances Market Volume Share Analysis, by Form, 2021, 2025, and 2031
Figure 22: Europe Bio-based Flavors and Fragrances Market Attractiveness, by Form
Figure 23: Europe Bio-based Flavors and Fragrances Market Volume Share Analysis, by Type, 2021, 2025, and 2031
Figure 24: Europe Bio-based Flavors and Fragrances Market Attractiveness, by Type
Figure 25: Europe Bio-based Flavors and Fragrances Market Volume Share Analysis, by Application, 2021, 2025, and 2031
Figure 26: Europe Bio-based Flavors and Fragrances Market Attractiveness, by Application
Figure 27: Europe Bio-based Flavors and Fragrances Market Volume Share Analysis, by End-use, 2021, 2025, and 2031
Figure 28: Europe Bio-based Flavors and Fragrances Market Attractiveness, by End-use
Figure 29: Europe Bio-based Flavors and Fragrances Market Volume Share Analysis, by Country and Sub-region, 2021, 2025, and 2031
Figure 30: Europe Bio-based Flavors and Fragrances Market Attractiveness, by Country and Sub-region
Figure 31: Asia Pacific Bio-based Flavors and Fragrances Market Volume Share Analysis, by Form, 2021, 2025, and 2031
Figure 32: Asia Pacific Bio-based Flavors and Fragrances Market Attractiveness, by Form
Figure 33: Asia Pacific Bio-based Flavors and Fragrances Market Volume Share Analysis, by Type, 2021, 2025, and 2031
Figure 34: Asia Pacific Bio-based Flavors and Fragrances Market Attractiveness, by Type
Figure 35: Asia Pacific Bio-based Flavors and Fragrances Market Volume Share Analysis, by Application, 2021, 2025, and 2031
Figure 36: Asia Pacific Bio-based Flavors and Fragrances Market Attractiveness, by Application
Figure 33: Asia Pacific Bio-based Flavors and Fragrances Market Volume Share Analysis, by End-use, 2021, 2025, and 2031
Figure 34: Asia Pacific Bio-based Flavors and Fragrances Market Attractiveness, by End-use
Figure 35: Asia Pacific Bio-based Flavors and Fragrances Market Volume Share Analysis, by Country and Sub-region, 2021, 2025, and 2031
Figure 36: Asia Pacific Bio-based Flavors and Fragrances Market Attractiveness, by Country and Sub-region
Figure 33: Latin America Bio-based Flavors and Fragrances Market Volume Share Analysis, by Form, 2021, 2025, and 2031
Figure 34: Latin America Bio-based Flavors and Fragrances Market Attractiveness, by Form
Figure 35: Latin America Bio-based Flavors and Fragrances Market Volume Share Analysis, by Type, 2021, 2025, and 2031
Figure 36: Latin America Bio-based Flavors and Fragrances Market Attractiveness, by Type
Figure 33: Latin America Bio-based Flavors and Fragrances Market Volume Share Analysis, by Application, 2021, 2025, and 2031
Figure 34: Latin America Bio-based Flavors and Fragrances Market Attractiveness, by Application
Figure 35: Latin America Bio-based Flavors and Fragrances Market Volume Share Analysis, by End-use, 2021, 2025, and 2031
Figure 36: Latin America Bio-based Flavors and Fragrances Market Attractiveness, by End-use
Figure 36: Latin America Bio-based Flavors and Fragrances Market Volume Share Analysis, by Country and Sub-region, 2021, 2025, and 2031
Figure 37: Latin America Bio-based Flavors and Fragrances Market Attractiveness, by Country and Sub-region
Figure 38: Middle East & Africa Bio-based Flavors and Fragrances Market Volume Share Analysis, by Form, 2021, 2025, and 2031
Figure 39: Middle East & Africa Bio-based Flavors and Fragrances Market Attractiveness, by Form
Figure 40: Middle East & Africa Bio-based Flavors and Fragrances Market Volume Share Analysis, by Type, 2021, 2025, and 2031
Figure 41: Middle East & Africa Bio-based Flavors and Fragrances Market Attractiveness, by Type
Figure 42: Middle East & Africa Bio-based Flavors and Fragrances Market Volume Share Analysis, by Application, 2021, 2025, and 2031
Figure 43: Middle East & Africa Bio-based Flavors and Fragrances Market Attractiveness, by Application
Figure 44: Middle East & Africa Bio-based Flavors and Fragrances Market Volume Share Analysis, by End-use, 2021, 2025, and 2031
Figure 45: Middle East & Africa Bio-based Flavors and Fragrances Market Attractiveness, by End-use
Figure 46: Middle East & Africa Bio-based Flavors and Fragrances Market Volume Share Analysis, by Country and Sub-region, 2021, 2025, and 2031
Figure 47: Middle East & Africa Bio-based Flavors and Fragrances Market Attractiveness, by Country and Sub-region
Copyright © Transparency Market Research, Inc. All Rights reserved
Trust Online

Bio-based Flavors and Fragrances Market