
Reports
Reports
Analysts’ Viewpoint on BI and Analytics Market Scenario
Rapid digitalization has generated the need for real-time data analytics and automated business intelligence systems to improve business operations, financial performance, and decision-making abilities. This, in turn, is expected to drive the global BI and analytics market. Real-time data analysis has gained importance in various organizations, as markets have become highly competitive. Additionally, demand for dashboards for data visualization to enhance the ability of taking business decisions and cloud infrastructure has increased. These factors are also expected to fuel the global BI and analytics market during the forecast period.
The Covid-19 pandemic emphasized the importance of BI and analytics across various industries. Uses and applications of BI and analytics are limitless. Several industries have been increasing operations productivity, boosting revenues, and better serving their customers with the use of BI and analysis. These factors are likely to showcase the positive growth of the global BI and analytics market in the next few years.
Business Intelligence (BI) is an umbrella term for technologies that enable data mining, data preparation, data visualization, and data management. BI processes and tools enable end-users to derive actionable insights from raw data to facilitate data-driven decision-making in organizations across multiple industries.
Implementation of new technologies such as stream mining, database analysis, and memory analysis provides real-time analytics for situational intelligence, fraud detection, and customer interactions. Furthermore, increase in adoption of Internet of Things (IoT) devices has generated a large amount of real-time data, which in turn has fueled the demand for business intelligence & analytic tools.
The business intelligence market trends include adoption of cloud computing, big data analytics, and AI business intelligence. Adoption of cloud computing and big data analytics has been rising for the past few years. Cloud computing is considered a suitable platform to offer BI applications, as it is the source of structured and unstructured data. Flexibility and scalability of the cloud make it an excellent accompaniment to business intelligence and data analytic tools and activities.
Conversely, big data has enabled these tools to analyze vast amounts of data and provide organizations with actionable insights that help evaluate opportunities and enhance marketing strategies. Cloud business intelligence solutions are gaining traction among companies, as several firms have recognized the benefits of data analytics. Moreover, companies can solve the problems that they face with their onsite BI solutions by using cloud computing. Additionally, companies can decrease their operating costs by using BI solutions on a subscription basis.
Cloud plays an important part in business intelligence industry growth and provides various benefits in terms of cost-effectiveness, implementation, flexibility and scalability, dependability, and better data sharing possibilities. Additionally, cloud computing also provides a substantial amount of data storing capacity. Consequently, BI is predicted to enter numerous complicated domains (business and non-business), which was previously unachievable in a self-hosted environment. Some applications where BI and analytics solutions have enormous potential in cloud computing include location-aware automation, context-aware applications, advanced science and technology databases, massive scale semantics, city management, real-time disaster and crisis management, global finance and economy reporting, and global monitoring of industries and sectors. Such widespread adoption is expected to fuel the global BI and analytics market during the forecast period.
AI business intelligence and analytics abilities are a major attraction to companies as they improve revenue stream and offer valuable insights. Growing volume and complexity of data within companies is further encouraging the use of AI. Additionally, AI and machine learning enable firms to extract useful insights, which in turn enable them to foresee market trends and consumer behavior. Thus, businesses are keen to engage AI engineers to update their solutions. In general, the use of AI in business intelligence platforms may provide organizations with information worth billions of dollars.
The real potential of business intelligence may be measured by breaking down enormous amounts of data into granular insights. It helps businesses to understand the finer points of the broader picture. AI also improves capacity and functionality of BI systems. Moreover, AI-enabled BI boosts operations of organizations since it provides essential insight into data that firms were previously unable to evaluate. AI-powered BI tools evaluate new data and find trends that are beneficial to businesses. For instance, major benefits of AI in business intelligence can be seen in HANA-SAP’s cloud platform that enables customers to manage databases of collected information.
Europe held major share of the global BI and analytics market in 2021, followed by North America. These regions are expected to retain their positions during the forecast period. The presence of major BI and analytics solution providers in the U.S. and presence of SMEs in Europe are driving the BI market share held by these regions. Rise in adoption of BI tools to organize, analyze, and contextualize business data and make timely and informed decisions among different industry verticals is estimated to propel the demand for business analytics and business intelligence solutions in Europe. Demand for cloud-based BI and analytics solutions in North America is also expected to boost the business intelligence market size.
The BI and analytics market in Asia Pacific is expected to grow at a notable pace during the forecast period due to rise in volumes of data in the region. Technological developments in various industries further generate the need for adoption of BI to drive revenue, operational effectiveness, predict customer behavior and loyalty, drive shareholder value, ad delivery, and develop new business opportunities. These factors are estimated to drive the BI and analytics market in the region.
The global BI and analytics market is highly fragmented and business intelligence companies are looking for ways to successfully tap into growth opportunities and strengthen their presence in the market. Market players are expanding their product portfolio and regional presence through mergers and acquisitions, new product developments, and partnerships with leading players. The next few years are expected to offer opportunities for the setting up of BI and analytics solutions in untapped markets. Microsoft, IBM Corporation, Oracle, SAP SE, and Teradata, among others, have been profiled in the global BI and analytics market research report. Company profiles include sections such as company overview, financial overview, business strategies, product portfolio, business segments, and recent developments.
|
Attribute |
Detail |
|
Market Size Value in 2021 |
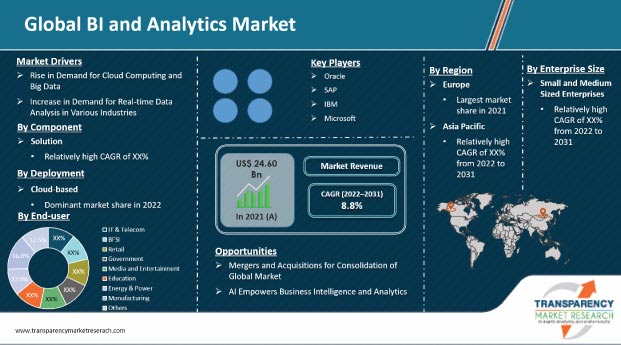
US$ 24.60 Bn |
|
Market Forecast Value in 2031 |
US$ 56.72 Bn |
|
Growth Rate (CAGR) |
8.8% |
|
Forecast Period |
2022–2031 |
|
Historical Data Available for |
2017–2020 |
|
Quantitative Units |
US$ Bn for Value |
|
Market Analysis |
Includes cross-segment analysis at global as well as regional level. Furthermore, qualitative analysis includes drivers, restraints, opportunities, key trends, ecosystem analysis, and COVID-19 impact analysis. |
|
Competition Landscape |
|
|
Format |
Electronic (PDF) + Excel |
|
Market Segmentation |
|
|
Regions Covered |
|
|
Countries Covered |
|
|
Companies Profiled |
|
|
Customization Scope |
Available upon request |
|
Pricing |
Available upon request |
The BI and analytics market is anticipated to grow at a CAGR of 8.8% during the forecast period.
The cloud-based segment is the largest segment of the global BI and analytics market.
Rise in demand for cloud computing, big data, and real-time data analysis in various industries.
AI-empowered business intelligence and analytics to generate significant opportunities.
Europe is a more attractive region for vendors in the BI and analytics market.
Microsoft Corporation, IBM Corporation, Oracle Corporation, SAP SE, Amazon Web Services, Inc., Tibco Software, Inc., Teradata, Sisense, Yellofin, Infor, Qlik Technologies Inc., Tableau Software, Inc., ThoughtSpot, Inc., Domo, Inc., SAS Institute, Inc., Pyramid Analytics, and Cisco Systems Inc.
1. Preface
1.1. Market Introduction
1.2. Market Segmentation
1.3. Key Research Objectives
2. Assumptions and Research Methodology
2.1. Research Methodology
2.1.1. List of Primary and Secondary Sources
2.2. Key Assumptions for Data Modelling
3. Executive Summary: Global BI and Analytics Market
4. Market Overview
4.1. Market Definition
4.2. Technology/ Product Roadmap
4.3. Market Factor Analysis
4.3.1. Forecast Factors
4.3.2. Ecosystem/ Value Chain Analysis
4.3.3. Market Dynamics (Growth Influencers)
4.3.3.1. Drivers
4.3.3.2. Restraints
4.3.3.3. Opportunities
4.3.3.4. Impact Analysis of Drivers and Restraints
4.4. COVID-19 Impact Analysis
4.4.1. Impact of COVID-19 on BI and Analytics Market
4.4.2. End-user Sentiment Analysis: Comparative Analysis on Spending
4.4.2.1. Increase in Spending
4.4.2.2. Decrease in Spending
4.4.3. Short Term and Long Term Impact on the Market
4.5. Market Opportunity Assessment – by Region (North America/ Europe/ Asia Pacific/ Middle East & Africa/ South America)
4.5.1. By Component
4.5.2. By Deployment
4.5.3. By Enterprise Size
4.5.4. By End-user
5. Global BI and Analytics Market Analysis and Forecast
5.1. Market Revenue Analysis (US$ Bn), 2016-2031
5.1.1. Historic Growth Trends, 2016-2021
5.1.2. Forecast Trends, 2022-2031
6. Global BI and Analytics Market Analysis, by Component
6.1. Overview and Definitions
6.2. Key Segment Analysis
6.3. BI and Analytics Market Size (US$ Bn) Forecast, by Component, 2018‒2031
6.3.1. Solution
6.3.2. Services
6.3.2.1. Professional
6.3.2.2. Managed
7. Global BI and Analytics Market Analysis, by Deployment
7.1. Overview and Definitions
7.2. Key Segment Analysis
7.3. BI and Analytics Market Size (US$ Bn) Forecast, by Deployment, 2018‒2031
7.3.1. On-premise
7.3.2. Cloud Based
8. Global BI and Analytics Market Analysis, by Enterprise Size
8.1. Overview and Definitions
8.2. Key Segment Analysis
8.3. BI and Analytics Market Size (US$ Bn) Forecast, by Enterprise Size, 2018‒2031
8.3.1. SMEs
8.3.2. Large Enterprise
9. Global BI and Analytics Market Analysis, by End-user
9.1. Overview and Definitions
9.2. Key Segment Analysis
9.3. BI and Analytics Market Size (US$ Bn) Forecast, by End-user, 2018‒2031
9.3.1. IT & Telecom
9.3.2. BFSI
9.3.3. Retail
9.3.4. Government
9.3.5. Media & Entertainment
9.3.6. Education
9.3.7. Energy & Power
9.3.8. Manufacturing
9.3.9. Other
10. Global BI and Analytics Market Analysis and Forecasts, by Region
10.1. Key Findings
10.2. Market Size (US$ Bn) Forecast by Region, 2018-2031
10.2.1. North America
10.2.2. Europe
10.2.3. Asia Pacific
10.2.4. Middle East & Africa
10.2.5. South America
11. North America BI and Analytics Market Analysis and Forecast
11.1. Regional Outlook
11.2. BI and Analytics Market Size (US$ Bn) Analysis and Forecast, 2018‒2031
11.2.1. By Component
11.2.2. By Deployment
11.2.3. By Enterprise Size
11.2.4. By End-user
11.3. BI and Analytics Market Size (US$ Bn) Forecast, by Country, 2018‒2031
11.3.1. U.S.
11.3.2. Canada
11.3.3. Mexico
12. Europe BI and Analytics Market Analysis and Forecast
12.1. Regional Outlook
12.2. BI and Analytics Market Size (US$ Bn) Analysis and Forecast, 2018‒2031
12.2.1. By Component
12.2.2. By Deployment
12.2.3. By Enterprise Size
12.2.4. By End-user
12.3. BI and Analytics Market Size (US$ Bn) Forecast, by Country & Sub-region, 2018‒2031
12.3.1. Germany
12.3.2. UK
12.3.3. France
12.3.4. Italy
12.3.5. Spain
12.3.6. Rest of Europe
13. Asia Pacific BI and Analytics Market Analysis and Forecast
13.1. Regional Outlook
13.2. BI and Analytics Market Size (US$ Bn) Analysis and Forecast, 2018‒2031
13.2.1. By Component
13.2.2. By Deployment
13.2.3. By Enterprise Size
13.2.4. By End-user
13.3. BI and Analytics Market Size (US$ Bn) Forecast, by Country & Sub-region, 2018‒2031
13.3.1. China
13.3.2. India
13.3.3. Japan
13.3.4. ASEAN
13.3.5. Rest of Asia Pacific
14. Middle East & Africa BI and Analytics Market Analysis and Forecast
14.1. Regional Outlook
14.2. BI and Analytics Market Size (US$ Bn) Analysis and Forecast, 2018‒2031
14.2.1. By Component
14.2.2. By Deployment
14.2.3. By Enterprise Size
14.2.4. By End-user
14.3. BI and Analytics Market Size (US$ Bn) Forecast, by Country & Sub-region, 2018‒2031
14.3.1. Saudi Arabia
14.3.2. The United Arab Emirates
14.3.3. South Africa
14.3.4. Rest of Middle East & Africa
15. South America BI and Analytics Market Analysis and Forecast
15.1. Regional Outlook
15.2. BI and Analytics Market Size (US$ Bn) Analysis and Forecast, 2018‒2031
15.2.1. By Component
15.2.2. By Deployment
15.2.3. By Enterprise Size
15.2.4. By End-user
15.3. BI and Analytics Market Size (US$ Bn) Forecast, by Country & Sub-region, 2018‒2031
15.3.1. Brazil
15.3.2. Argentina
15.3.3. Rest of South America
16. Competition Landscape
16.1. Market Competition Matrix, by Leading Players
16.2. Market Revenue Share Analysis (%), by Leading Players (2021)
16.3. Competitive Scenario
16.3.1. List of Emerging, Prominent and Leading Players
16.3.2. Major Mergers & Acquisitions, Expansions, Partnership, Contacts, Deals, etc.
17. Company Profiles
17.1. Microsoft Corporation
17.1.1. Business Overview
17.1.2. Company Revenue
17.1.3. Product Portfolio
17.1.4. Geographic Footprint
17.1.5. Strategic Partnership
17.1.6. Merger & Acquisition
17.1.7. Business Expansion
17.1.8. New Product Launch
17.1.9. Innovation etc.
17.2. IBM Corporation
17.2.1. Business Overview
17.2.2. Company Revenue
17.2.3. Product Portfolio
17.2.4. Geographic Footprint
17.2.5. Strategic Partnership
17.2.6. Merger & Acquisition
17.2.7. Business Expansion
17.2.8. New Product Launch
17.2.9. Innovation etc.
17.3. Oracle Corporation
17.3.1. Business Overview
17.3.2. Company Revenue
17.3.3. Product Portfolio
17.3.4. Geographic Footprint
17.3.5. Strategic Partnership
17.3.6. Merger & Acquisition
17.3.7. Business Expansion
17.3.8. New Product Launch
17.3.9. Innovation etc.
17.4. SAP SE
17.4.1. Business Overview
17.4.2. Company Revenue
17.4.3. Product Portfolio
17.4.4. Geographic Footprint
17.4.5. Strategic Partnership
17.4.6. Merger & Acquisition
17.4.7. Business Expansion
17.4.8. New Product Launch
17.4.9. Innovation etc.
17.5. Amazon Web Services, Inc.
17.5.1. Business Overview
17.5.2. Company Revenue
17.5.3. Product Portfolio
17.5.4. Geographic Footprint
17.5.5. Strategic Partnership
17.5.6. Merger & Acquisition
17.5.7. Business Expansion
17.5.8. New Product Launch
17.5.9. Innovation etc.
17.6. Tibco Software, Inc.
17.6.1. Business Overview
17.6.2. Company Revenue
17.6.3. Product Portfolio
17.6.4. Geographic Footprint
17.6.5. Strategic Partnership
17.6.6. Merger & Acquisition
17.6.7. Business Expansion
17.6.8. New Product Launch
17.6.9. Innovation etc.
17.7. Teradata
17.7.1. Business Overview
17.7.2. Company Revenue
17.7.3. Product Portfolio
17.7.4. Geographic Footprint
17.7.5. Strategic Partnership
17.7.6. Merger & Acquisition
17.7.7. Business Expansion
17.7.8. New Product Launch
17.7.9. Innovation etc.
17.8. Sisense
17.8.1. Business Overview
17.8.2. Company Revenue
17.8.3. Product Portfolio
17.8.4. Geographic Footprint
17.8.5. Strategic Partnership
17.8.6. Merger & Acquisition
17.8.7. Business Expansion
17.8.8. New Product Launch
17.8.9. Innovation etc.
17.9. Yellofin
17.9.1. Business Overview
17.9.2. Company Revenue
17.9.3. Product Portfolio
17.9.4. Geographic Footprint
17.9.5. Strategic Partnership
17.9.6. Merger & Acquisition
17.9.7. Business Expansion
17.9.8. New Product Launch
17.9.9. Innovation etc.
17.10. Infor
17.10.1. Business Overview
17.10.2. Company Revenue
17.10.3. Product Portfolio
17.10.4. Geographic Footprint
17.10.5. Strategic Partnership
17.10.6. Merger & Acquisition
17.10.7. Business Expansion
17.10.8. New Product Launch
17.10.9. Innovation etc.
17.11. Qlik Technologies Inc.
17.11.1. Business Overview
17.11.2. Company Revenue
17.11.3. Product Portfolio
17.11.4. Geographic Footprint
17.11.5. Strategic Partnership
17.11.6. Merger & Acquisition
17.11.7. Business Expansion
17.11.8. New Product Launch
17.11.9. Innovation etc.
17.12. Tableau Software, Inc.
17.12.1. Business Overview
17.12.2. Company Revenue
17.12.3. Product Portfolio
17.12.4. Geographic Footprint
17.12.5. Strategic Partnership
17.12.6. Merger & Acquisition
17.12.7. Business Expansion
17.12.8. New Product Launch
17.12.9. Innovation etc.
17.13. ThoughtSpot, Inc.
17.13.1. Business Overview
17.13.2. Company Revenue
17.13.3. Product Portfolio
17.13.4. Geographic Footprint
17.13.5. Strategic Partnership
17.13.6. Merger & Acquisition
17.13.7. Business Expansion
17.13.8. New Product Launch
17.13.9. Innovation etc.
17.14. Domo, Inc.
17.14.1. Business Overview
17.14.2. Company Revenue
17.14.3. Product Portfolio
17.14.4. Geographic Footprint
17.14.5. Strategic Partnership
17.14.6. Merger & Acquisition
17.14.7. Business Expansion
17.14.8. New Product Launch
17.14.9. Innovation etc.
17.15. SAS Institute, Inc.
17.15.1. Business Overview
17.15.2. Company Revenue
17.15.3. Product Portfolio
17.15.4. Geographic Footprint
17.15.5. Strategic Partnership
17.15.6. Merger & Acquisition
17.15.7. Business Expansion
17.15.8. New Product Launch
17.15.9. Innovation etc.
17.16. Pyramid Analytics
17.16.1. Business Overview
17.16.2. Company Revenue
17.16.3. Product Portfolio
17.16.4. Geographic Footprint
17.16.5. Strategic Partnership
17.16.6. Merger & Acquisition
17.16.7. Business Expansion
17.16.8. New Product Launch
17.16.9. Innovation etc.
17.17. Cisco Systems Inc.
17.17.1. Business Overview
17.17.2. Company Revenue
17.17.3. Product Portfolio
17.17.4. Geographic Footprint
17.17.5. Strategic Partnership
17.17.6. Merger & Acquisition
17.17.7. Business Expansion
17.17.8. New Product Launch
17.17.9. Innovation etc.
17.18. Others
17.18.1. Business Overview
17.18.2. Company Revenue
17.18.3. Product Portfolio
17.18.4. Geographic Footprint
17.18.5. Strategic Partnership
17.18.6. Merger & Acquisition
17.18.7. Business Expansion
17.18.8. New Product Launch
17.18.9. Innovation etc.
18. Key Takeaways
List of Tables
Table 1: Acronyms Used in BI and Analytics Market
Table 2: North America BI and Analytics Market Revenue Analysis, by Country, 2022 - 2031 (US$ Bn)
Table 3: Europe BI and Analytics Market Revenue Analysis, by Country, 2022 - 2031 (US$ Bn)
Table 4: Asia Pacific BI and Analytics Market Revenue Analysis, by Country, 2022 - 2031 (US$ Bn)
Table 5: Middle East & Africa BI and Analytics Market Revenue Analysis, by Country, 2021 and 2031 (US$ Bn)
Table 6: South America BI and Analytics Market Revenue Analysis, by Country, 2022 - 2031 (US$ Bn)
Table 7: Forecast Factors: Relevance and Impact (1/2)
Table 8: Forecast Factors: Relevance and Impact (2/2)
Table 9: Impact Analysis of Drivers & Restraints
Table 10: Global BI and Analytics Market Value (US$ Bn) Forecast, by Component, 2018 – 2031
Table 11: Global BI and Analytics Market Value (US$ Bn) Forecast, by Deployment, 2018 – 2031
Table 12: Global BI and Analytics Market Value (US$ Bn) Forecast, by Enterprise Size, 2018 – 2031
Table 13: Global BI and Analytics Market Value (US$ Bn) Forecast, by End-user, 2018 – 2031
Table 14: Global BI and Analytics Market Volume (US$ Bn) Forecast, by Region, 2018‒2031
Table 15: North America BI and Analytics Market Value (US$ Bn) Forecast, by Component, 2018 – 2031
Table 16: North America BI and Analytics Market Value (US$ Bn) Forecast, by Deployment, 2018 – 2031
Table 17: North America BI and Analytics Market Value (US$ Bn) Forecast, by Enterprise Size, 2018 – 2031
Table 18: North America BI and Analytics Market Value (US$ Bn) Forecast, by End-user, 2018 – 2031
Table 19: North America BI and Analytics Market Value (US$ Bn) Forecast, by Country, 2018‒2031
Table 20: U.S. BI and Analytics Market Revenue CAGR Breakdown (%), by Growth Term
Table 21: Canada BI and Analytics Market Revenue CAGR Breakdown (%), by Growth Term
Table 22: Mexico BI and Analytics Market Revenue CAGR Breakdown (%), by Growth Term
Table 23: Europe BI and Analytics Market Value (US$ Bn) Forecast, by Component, 2018 – 2031
Table 24: Europe BI and Analytics Market Value (US$ Bn) Forecast, by Deployment, 2018 – 2031
Table 25: Europe BI and Analytics Market Value (US$ Bn) Forecast, by Enterprise Size, 2018 – 2031
Table 26: Europe BI and Analytics Market Value (US$ Bn) Forecast, by End-user, 2018 – 2031
Table 27: Europe BI and Analytics Market Value (US$ Bn) Forecast, by Country, 2018‒2031
Table 28: Germany BI and Analytics Market Revenue CAGR Breakdown (%), by Growth Term
Table 29: U.K. BI and Analytics Market Revenue CAGR Breakdown (%), by Growth Term
Table 30: France BI and Analytics Market Revenue CAGR Breakdown (%), by Growth Term
Table 31: Spain BI and Analytics Market Revenue CAGR Breakdown (%), by Growth Term
Table 32: Italy BI and Analytics Market Revenue CAGR Breakdown (%), by Growth Term
Table 33: Asia Pacific BI and Analytics Market Value (US$ Bn) Forecast, by Component, 2018 – 2031
Table 34: Asia Pacific BI and Analytics Market Value (US$ Bn) Forecast, by Deployment, 2018 – 2031
Table 35: Asia Pacific BI and Analytics Market Value (US$ Bn) Forecast, by Enterprise Size, 2018 – 2031
Table 36: Asia Pacific BI and Analytics Market Value (US$ Bn) Forecast, by End-user, 2018 – 2031
Table 37: Asia Pacific BI and Analytics Market Value (US$ Bn) Forecast, by Country, 2018‒2031
Table 38: China BI and Analytics Market Revenue CAGR Breakdown (%), by Growth Term
Table 39: India BI and Analytics Market Revenue CAGR Breakdown (%), by Growth Term
Table 40: Japan BI and Analytics Market Revenue CAGR Breakdown (%), by Growth Term
Table 41: ASEAN BI and Analytics Market Revenue CAGR Breakdown (%), by Growth Term
Table 42: Middle East & Africa BI and Analytics Market Value (US$ Bn) Forecast, by Component, 2018 – 2031
Table 43: Middle East & Africa BI and Analytics Market Value (US$ Bn) Forecast, by Deployment, 2018 – 2031
Table 44: Middle East & Africa BI and Analytics Market Value (US$ Bn) Forecast, by Enterprise Size, 2018 – 2031
Table 45: Middle East & Africa BI and Analytics Market Value (US$ Bn) Forecast, by End-user, 2018 – 2031
Table 46: Middle East & Africa BI and Analytics Market Value (US$ Bn) Forecast, by Country, 2018‒2031
Table 47: Saudi Arabia BI and Analytics Market Revenue CAGR Breakdown (%), by Growth Term
Table 48: The United Arab Emirates BI and Analytics Market Revenue CAGR Breakdown (%), by Growth Term
Table 49: South Africa BI and Analytics Market Revenue CAGR Breakdown (%), by Growth Term
Table 50: South America BI and Analytics Market Value (US$ Bn) Forecast, by Component, 2018 – 2031
Table 51: South America BI and Analytics Market Value (US$ Bn) Forecast, by Deployment, 2018 – 2031
Table 52: South America BI and Analytics Market Value (US$ Bn) Forecast, by Enterprise Size, 2018 – 2031
Table 53: South America BI and Analytics Market Value (US$ Bn) Forecast, by End-user, 2018 – 2031
Table 54: South America BI and Analytics Market Value (US$ Bn) Forecast, by Country, 2018 – 2031
Table 55: Brazil BI and Analytics Market Revenue CAGR Breakdown (%), by Growth Term
Table 56: Argentina BI and Analytics Market Revenue CAGR Breakdown (%), by Growth Term
List of Figures
Figure 1: Global BI and Analytics Market Size (US$ Bn) Forecast, 2018–2031
Figure 2: Global BI and Analytics Market Revenue (US$ Bn) Opportunity Assessment, by Region, 2021E
Figure 3: Top Segment Analysis of BI and Analytics Market
Figure 4: Global BI and Analytics Market Revenue (US$ Bn) Opportunity Assessment, by Region, 2031F
Figure 5: Global BI and Analytics Market Attractiveness Assessment, by Component
Figure 6: Global BI and Analytics Market Attractiveness Assessment, by Deployment
Figure 7: Global BI and Analytics Market Attractiveness Assessment, by Enterprise Size
Figure 8: Global BI and Analytics Market Attractiveness Assessment, by End-user
Figure 9: Global BI and Analytics Market Attractiveness Assessment, by Region
Figure 10: Global BI and Analytics Market Revenue (US$ Bn) Historic Trends, 2016 - 2021
Figure 11: Global BI and Analytics Market Revenue Opportunity (US$ Bn) Historic Trends, 2016 - 2021
Figure 12: Global BI and Analytics Market Value Share Analysis, by Component, 2021
Figure 13: Global BI and Analytics Market Value Share Analysis, by Component, 2031
Figure 14: Global BI and Analytics Market Absolute Opportunity (US$ Bn), by Solution, 2022 – 2031
Figure 15: Global BI and Analytics Market Absolute Opportunity (US$ Bn), by Services, 2022 – 2031
Figure 16: Global BI and Analytics Market Value Share Analysis, by Deployment, 2021
Figure 17: Global BI and Analytics Market Value Share Analysis, by Deployment, 2031
Figure 18: Global BI and Analytics Market Absolute Opportunity (US$ Bn), by On-premise, 2022 – 2031
Figure 19: Global BI and Analytics Market Absolute Opportunity (US$ Bn), by Cloud Based, 2022 – 2031
Figure 20: Global BI and Analytics Market Value Share Analysis, by Enterprise Size, 2021
Figure 21: Global BI and Analytics Market Value Share Analysis, by Enterprise Size, 2031
Figure 22: Global BI and Analytics Market Absolute Opportunity (US$ Bn), by SMEs, 2022 – 2031
Figure 23: Global BI and Analytics Market Absolute Opportunity (US$ Bn), by Large Enterprises, 2022 – 2031
Figure 24: Global BI and Analytics Market Value Share Analysis, by End-user, 2021
Figure 25: Global BI and Analytics Market Value Share Analysis, by End-user, 2031
Figure 26: Global BI and Analytics Market Absolute Opportunity (US$ Bn), by IT & Telecom, 2022 – 2031
Figure 27: Global BI and Analytics Market Absolute Opportunity (US$ Bn), by BFSI, 2022 – 2031
Figure 28: Global BI and Analytics Market Absolute Opportunity (US$ Bn), by Retail, 2022 – 2031
Figure 29: Global BI and Analytics Market Absolute Opportunity (US$ Bn), by Government, 2022 – 2031
Figure 30: Global BI and Analytics Market Absolute Opportunity (US$ Bn), by Media & Entertainment, 2022 – 2031
Figure 31: Global BI and Analytics Market Absolute Opportunity (US$ Bn), by Education, 2022 – 2031
Figure 32: Global BI and Analytics Market Absolute Opportunity (US$ Bn), by Energy & Power, 2022 – 2031
Figure 33: Global BI and Analytics Market Absolute Opportunity (US$ Bn), by Manufacturing, 2022 – 2031
Figure 34: Global BI and Analytics Market Absolute Opportunity (US$ Bn), by Others, 2022 – 2031
Figure 35: Global BI and Analytics Market Opportunity (US$ Bn), by Region
Figure 36: Global BI and Analytics Market Opportunity Share (%), by Region, 2021–2031
Figure 37: Global BI and Analytics Market Size (US$ Bn), by Region, 2021 & 2031
Figure 38: Global BI and Analytics Market Value Share Analysis, by Region, 2021
Figure 39: Global BI and Analytics Market Value Share Analysis, by Region, 2031
Figure 40: North America BI and Analytics Market Absolute Opportunity (US$ Bn), 2022 – 2031
Figure 41: Europe BI and Analytics Market Absolute Opportunity (US$ Bn), 2022 – 2031
Figure 42: Asia Pacific BI and Analytics Market Absolute Opportunity (US$ Bn), 2022 – 2031
Figure 43: Middle East & Africa BI and Analytics Market Absolute Opportunity (US$ Bn), 2022 – 2031
Figure 44: South America BI and Analytics Market Absolute Opportunity (US$ Bn), 2022 – 2031
Figure 46: North America BI and Analytics Revenue Opportunity Share, by Enterprise Size
Figure 47: North America BI and Analytics Revenue Opportunity Share, by Deployment
Figure 48: North America BI and Analytics Revenue Opportunity Share, by Country
Figure 49: North America BI and Analytics Revenue Opportunity Share, by End-user
Figure 45: North America BI and Analytics Revenue Opportunity Share, by Component
Figure 50: North America BI and Analytics Market Value Share Analysis, by Component, 2021
Figure 51: North America BI and Analytics Market Value Share Analysis, by Component, 2031
Figure 52: North America BI and Analytics Market Absolute Opportunity (US$ Bn), by Solution, 2022 – 2031
Figure 53: North America BI and Analytics Market Absolute Opportunity (US$ Bn), by Services, 2022 – 2031
Figure 54: North America BI and Analytics Market Value Share Analysis, by Deployment, 2021
Figure 55: North America BI and Analytics Market Value Share Analysis, by Deployment, 2031
Figure 56: North America BI and Analytics Market Absolute Opportunity (US$ Bn), by On-premise, 2022 – 2031
Figure 57: North America BI and Analytics Market Absolute Opportunity (US$ Bn), by Cloud Based, 2022 – 2031
Figure 58: North America BI and Analytics Market Value Share Analysis, by Enterprise Size, 2021
Figure 59: North America BI and Analytics Market Value Share Analysis, by Enterprise Size, 2031
Figure 60: North America BI and Analytics Market Absolute Opportunity (US$ Bn), by SMEs, 2022 – 2031
Figure 61: North America BI and Analytics Market Absolute Opportunity (US$ Bn), by Large Enterprises, 2022 – 2031
Figure 62: North America BI and Analytics Market Value Share Analysis, by End-user, 2021
Figure 63: North America BI and Analytics Market Value Share Analysis, by End-user, 2031
Figure 64: North America BI and Analytics Market Absolute Opportunity (US$ Bn), by IT & Telecom, 2022 – 2031
Figure 65: North America BI and Analytics Market Absolute Opportunity (US$ Bn), by BFSI, 2022 – 2031
Figure 66: North America BI and Analytics Market Absolute Opportunity (US$ Bn), by Retail, 2022 – 2031
Figure 67: North America BI and Analytics Market Absolute Opportunity (US$ Bn), by Government, 2022 – 2031
Figure 68: North America BI and Analytics Market Absolute Opportunity (US$ Bn), by Media & Entertainment, 2022 – 2031
Figure 69: North America BI and Analytics Market Absolute Opportunity (US$ Bn), by Education, 2022 – 2031
Figure 70: North America BI and Analytics Market Absolute Opportunity (US$ Bn), by Energy & Power, 2022 – 2031
Figure 71: North America BI and Analytics Market Absolute Opportunity (US$ Bn), by Manufacturing, 2022 – 2031
Figure 72: North America BI and Analytics Market Absolute Opportunity (US$ Bn), by Other, 2022 – 2031
Figure 73: North America BI and Analytics Market Value Share Analysis, by Country, 2021
Figure 74: North America BI and Analytics Market Value Share Analysis, by Country, 2031
Figure 75: U.S. BI and Analytics Market Opportunity Growth Analysis (US$ Bn) Forecast, 2022 – 2031
Figure 76: Canada BI and Analytics Market Opportunity Growth Analysis (US$ Bn) Forecast, 2022 – 2031
Figure 77: Mexico BI and Analytics Market Opportunity Growth Analysis (US$ Bn) Forecast, 2022 – 2031
Figure 79: Europe BI and Analytics Revenue Opportunity Share, by Enterprises
Figure 80: Europe BI and Analytics Revenue Opportunity Share, by Deployment
Figure 81: Europe BI and Analytics Revenue Opportunity Share, by Country
Figure 82: Europe BI and Analytics Revenue Opportunity Share, by End-user
Figure 78: Europe BI and Analytics Revenue Opportunity Share, by Component
Figure 83: Europe BI and Analytics Market Value Share Analysis, by Component, 2021
Figure 84: Europe BI and Analytics Market Value Share Analysis, by Component, 2031
Figure 85: Europe BI and Analytics Market Absolute Opportunity (US$ Bn), by Solution, 2022 – 2031
Figure 86: Europe BI and Analytics Market Absolute Opportunity (US$ Bn), by Services, 2022 – 2031
Figure 87: Europe BI and Analytics Market Value Share Analysis, by Deployment, 2021
Figure 88: Europe BI and Analytics Market Value Share Analysis, by Deployment, 2031
Figure 89: Europe BI and Analytics Market Absolute Opportunity (US$ Bn), by On-premise, 2022 – 2031
Figure 90: Europe BI and Analytics Market Absolute Opportunity (US$ Bn), by Cloud Based, 2022 – 2031
Figure 91: Europe BI and Analytics Market Value Share Analysis, by Enterprise Size, 2021
Figure 92: Europe BI and Analytics Market Value Share Analysis, by Enterprise Size, 2031
Figure 93: Europe BI and Analytics Market Absolute Opportunity (US$ Bn), by SMEs, 2022 – 2031
Figure 94: Europe BI and Analytics Market Absolute Opportunity (US$ Bn), by Large Enterprises, 2022 – 2031
Figure 95: Europe BI and Analytics Market Value Share Analysis, by End-user, 2021
Figure 96: Europe BI and Analytics Market Value Share Analysis, by End-user, 2031
Figure 97: Europe BI and Analytics Market Absolute Opportunity (US$ Bn), by IT & Telecom, 2022 – 2031
Figure 98: Europe BI and Analytics Market Absolute Opportunity (US$ Bn), by BFSI, 2022 – 2031
Figure 99: Europe BI and Analytics Market Absolute Opportunity (US$ Bn), by Retail, 2022 – 2031
Figure 100: Europe BI and Analytics Market Absolute Opportunity (US$ Bn), by Government, 2022 – 2031
Figure 101: Europe BI and Analytics Market Absolute Opportunity (US$ Bn), by Media & Entertainment, 2022 – 2031
Figure 102: Europe BI and Analytics Market Absolute Opportunity (US$ Bn), by Education, 2022 – 2031
Figure 103: Europe BI and Analytics Market Absolute Opportunity (US$ Bn), by Energy & Power, 2022 – 2031
Figure 104: Europe BI and Analytics Market Absolute Opportunity (US$ Bn), by Manufacturing, 2022 – 2031
Figure 105: Europe BI and Analytics Market Absolute Opportunity (US$ Bn), by Other, 2022 – 2031
Figure 106: Europe BI and Analytics Market Value Share Analysis, by Country, 2021
Figure 107: Europe BI and Analytics Market Value Share Analysis, by Country, 2031
Figure 108: Germany BI and Analytics Market Opportunity Growth Analysis (US$ Bn) Forecast, 2022 – 2031
Figure 109: UK BI and Analytics Market Opportunity Growth Analysis (US$ Bn) Forecast, 2022 – 2031
Figure 110: France BI and Analytics Market Opportunity Growth Analysis (US$ Bn) Forecast, 2022 – 2031
Figure 111: Spain BI and Analytics Market Opportunity Growth Analysis (US$ Bn) Forecast, 2022 – 2031
Figure 112: Italy BI and Analytics Market Opportunity Growth Analysis (US$ Bn) Forecast, 2022 – 2031
Figure 114: Asia Pacific BI and Analytics Revenue Opportunity Share, by Enterprises
Figure 115: Asia Pacific BI and Analytics Revenue Opportunity Share, by Deployment
Figure 116: Asia Pacific BI and Analytics Revenue Opportunity Share, by Country
Figure 117: Asia Pacific BI and Analytics Revenue Opportunity Share, by End-user
Figure 113: Asia Pacific BI and Analytics Revenue Opportunity Share, by Component
Figure 118: Asia Pacific BI and Analytics Market Value Share Analysis, by Component, 2021
Figure 119: Asia Pacific BI and Analytics Market Value Share Analysis, by Component, 2031
Figure 120: Asia Pacific BI and Analytics Market Absolute Opportunity (US$ Bn), by Solution, 2022 – 2031
Figure 121: Asia Pacific BI and Analytics Market Absolute Opportunity (US$ Bn), by Services, 2022 – 2031
Figure 122: Asia Pacific BI and Analytics Market Value Share Analysis, by Deployment, 2021
Figure 123: Asia Pacific BI and Analytics Market Value Share Analysis, by Deployment, 2031
Figure 124: Asia Pacific BI and Analytics Market Absolute Opportunity (US$ Bn), by On-premise, 2022 – 2031
Figure 125: Asia Pacific BI and Analytics Market Absolute Opportunity (US$ Bn), by Cloud Based, 2022 – 2031
Figure 126: Asia Pacific BI and Analytics Market Value Share Analysis, by Enterprise Size, 2021
Figure 127: Asia Pacific BI and Analytics Market Value Share Analysis, by Enterprise Size, 2031
Figure 128: Asia Pacific BI and Analytics Market Absolute Opportunity (US$ Bn), by SMEs, 2022 – 2031
Figure 129: Asia Pacific BI and Analytics Market Absolute Opportunity (US$ Bn), by Large Enterprises, 2022 – 2031
Figure 130: Asia Pacific BI and Analytics Market Value Share Analysis, by End-user, 2021
Figure 131: Asia Pacific BI and Analytics Market Value Share Analysis, by End-user, 2031
Figure 132: Asia Pacific BI and Analytics Market Absolute Opportunity (US$ Bn), by IT & Telecom, 2022 – 2031
Figure 133: Asia Pacific BI and Analytics Market Absolute Opportunity (US$ Bn), by BFSI, 2022 – 2031
Figure 134: Asia Pacific BI and Analytics Market Absolute Opportunity (US$ Bn), by Retail, 2022 – 2031
Figure 135: Asia Pacific BI and Analytics Market Absolute Opportunity (US$ Bn), by Government, 2022 – 2031
Figure 136: Asia Pacific BI and Analytics Market Absolute Opportunity (US$ Bn), by Media & Entertainment, 2022 – 2031
Figure 137: Asia Pacific BI and Analytics Market Absolute Opportunity (US$ Bn), by Education, 2022 – 2031
Figure 138: Asia Pacific BI and Analytics Market Absolute Opportunity (US$ Bn), by Energy & Power, 2022 – 2031
Figure 139: Asia Pacific BI and Analytics Market Absolute Opportunity (US$ Bn), by Manufacturing, 2022 – 2031
Figure 140: Asia Pacific BI and Analytics Market Absolute Opportunity (US$ Bn), by Other, 2022 – 2031
Figure 141: Asia Pacific BI and Analytics Market Value Share Analysis, by Country, 2021
Figure 142: Asia Pacific BI and Analytics Market Value Share Analysis, by Country, 2031
Figure 143: China BI and Analytics Market Opportunity Growth Analysis (US$ Bn) Forecast, 2022 – 2031
Figure 144: India BI and Analytics Market Opportunity Growth Analysis (US$ Bn) Forecast, 2022 – 2031
Figure 145: Japan BI and Analytics Market Opportunity Growth Analysis (US$ Bn) Forecast, 2022 – 2031
Figure 146: ASEAN BI and Analytics Market Opportunity Growth Analysis (US$ Bn) Forecast, 2022 – 2031
Figure 148: Middle East & Africa BI and Analytics Revenue Opportunity Share, by Enterprises
Figure 149: Middle East & Africa BI and Analytics Revenue Opportunity Share, by Deployment
Figure 150: Middle East & Africa BI and Analytics Revenue Opportunity Share, by Country
Figure 151: Middle East & Africa BI and Analytics Revenue Opportunity Share, by End-user
Figure 147: Middle East & Africa BI and Analytics Revenue Opportunity Share, by Component
Figure 152: Middle East & Africa BI and Analytics Market Value Share Analysis, by Component, 2021
Figure 153: Middle East & Africa BI and Analytics Market Value Share Analysis, by Component, 2031
Figure 154: Middle East & Africa BI and Analytics Market Absolute Opportunity (US$ Bn), by Solution, 2022 – 2031
Figure 155: Middle East & Africa BI and Analytics Market Absolute Opportunity (US$ Bn), by Services, 2022 – 2031
Figure 156: Middle East & Africa BI and Analytics Market Value Share Analysis, by Deployment, 2021
Figure 157: Middle East & Africa BI and Analytics Market Value Share Analysis, by Deployment, 2031
Figure 158: Middle East & Africa BI and Analytics Market Absolute Opportunity (US$ Bn), by On-premise, 2022 – 2031
Figure 159: Middle East & Africa BI and Analytics Market Absolute Opportunity (US$ Bn), by Cloud Based, 2022 – 2031
Figure 160: Middle East & Africa BI and Analytics Market Value Share Analysis, by Enterprise Size, 2021
Figure 161: Middle East & Africa BI and Analytics Market Value Share Analysis, by Enterprise Size, 2031
Figure 162: Middle East & Africa BI and Analytics Market Absolute Opportunity (US$ Bn), by SMEs, 2022 – 2031
Figure 163: Middle East & Africa BI and Analytics Market Absolute Opportunity (US$ Bn), by Large Enterprises, 2022 – 2031
Figure 164: Middle East & Africa BI and Analytics Market Value Share Analysis, by End-user, 2021
Figure 165: Middle East & Africa BI and Analytics Market Value Share Analysis, by End-user, 2031
Figure 166: Middle East & Africa BI and Analytics Market Absolute Opportunity (US$ Bn), by IT & Telecom, 2022 – 2031
Figure 167: Middle East & Africa BI and Analytics Market Absolute Opportunity (US$ Bn), by BFSI, 2022 – 2031
Figure 168: Middle East & Africa BI and Analytics Market Absolute Opportunity (US$ Bn), by Retail, 2022 – 2031
Figure 169: Middle East & Africa BI and Analytics Market Absolute Opportunity (US$ Bn), by Government, 2022 – 2031
Figure 170: Middle East & Africa BI and Analytics Market Absolute Opportunity (US$ Bn), by Media & Entertainment, 2022 – 2031
Figure 171: Middle East & Africa BI and Analytics Market Absolute Opportunity (US$ Bn), by Education, 2022 – 2031
Figure 172: Middle East & Africa BI and Analytics Market Absolute Opportunity (US$ Bn), by Energy & Power, 2022 – 2031
Figure 173: Middle East & Africa BI and Analytics Market Absolute Opportunity (US$ Bn), by Manufacturing, 2022 – 2031
Figure 174: Middle East & Africa BI and Analytics Market Absolute Opportunity (US$ Bn), by Other, 2022 – 2031
Figure 175: Middle East & Africa BI and Analytics Market Value Share Analysis, by Country, 2021
Figure 176: Middle East & Africa BI and Analytics Market Value Share Analysis, by Country, 2031
Figure 177: Saudi Arabia BI and Analytics Market Opportunity Growth Analysis (US$ Bn) Forecast, 2022 – 2031
Figure 178: The United Arab Emirates BI and Analytics Market Opportunity Growth Analysis (US$ Bn) Forecast, 2022 – 2031
Figure 179: South Africa BI and Analytics Market Opportunity Growth Analysis (US$ Bn) Forecast, 2022 – 2031
Figure 181: South America BI and Analytics Revenue Opportunity Share, by Enterprises
Figure 182: South America BI and Analytics Revenue Opportunity Share, by Deployment
Figure 183: South America BI and Analytics Revenue Opportunity Share, by Country
Figure 184: South America BI and Analytics Revenue Opportunity Share, by End-user
Figure 180: South America BI and Analytics Revenue Opportunity Share, by Component
Figure 185: South America BI and Analytics Market Value Share Analysis, by Component, 2021
Figure 186: South America BI and Analytics Market Value Share Analysis, by Component, 2031
Figure 187: South America BI and Analytics Market Absolute Opportunity (US$ Bn), by Solution, 2022 – 2031
Figure 188: South America BI and Analytics Market Absolute Opportunity (US$ Bn), by Services, 2022 – 2031
Figure 189: South America BI and Analytics Market Value Share Analysis, by Deployment, 2021
Figure 190: South America BI and Analytics Market Value Share Analysis, by Deployment, 2031
Figure 191: South America BI and Analytics Market Absolute Opportunity (US$ Bn), by On-premise, 2022 – 2031
Figure 192: South America BI and Analytics Market Absolute Opportunity (US$ Bn), by Cloud Based, 2022 – 2031
Figure 193: South America BI and Analytics Market Value Share Analysis, by Enterprise Size, 2021
Figure 194: South America BI and Analytics Market Value Share Analysis, by Enterprise Size, 2031
Figure 195: South America BI and Analytics Market Absolute Opportunity (US$ Bn), by SMEs, 2022 – 2031
Figure 196: South America BI and Analytics Market Absolute Opportunity (US$ Bn), by Large Enterprises, 2022 – 2031
Figure 197: South America BI and Analytics Market Value Share Analysis, by End-user, 2021
Figure 198: South America BI and Analytics Market Value Share Analysis, by End-user, 2031
Figure 199: South America BI and Analytics Market Absolute Opportunity (US$ Bn), by IT & Telecom, 2022 – 2031
Figure 200: South America BI and Analytics Market Absolute Opportunity (US$ Bn), by BFSI, 2022 – 2031
Figure 201: South America BI and Analytics Market Absolute Opportunity (US$ Bn), by Retail, 2022 – 2031
Figure 202: South America BI and Analytics Market Absolute Opportunity (US$ Bn), by Government, 2022 – 2031
Figure 203: South America BI and Analytics Market Absolute Opportunity (US$ Bn), by Media & Entertainment, 2022 – 2031
Figure 204: South America BI and Analytics Market Absolute Opportunity (US$ Bn), by Education, 2022 – 2031
Figure 205: South America BI and Analytics Market Absolute Opportunity (US$ Bn), by Energy & Power, 2022 – 2031
Figure 206: South America BI and Analytics Market Absolute Opportunity (US$ Bn), by Manufacturing, 2022 – 2031
Figure 207: South America BI and Analytics Market Absolute Opportunity (US$ Bn), by Other, 2022 – 2031
Figure 208: South America BI and Analytics Market Value Share Analysis, by Country, 2021
Figure 209: South America BI and Analytics Market Value Share Analysis, by Country, 2031
Figure 210: Brazil BI and Analytics Market Opportunity Growth Analysis (US$ Bn) Forecast, 2022 – 2031
Figure 211: Argentina BI and Analytics Market Opportunity Growth Analysis (US$ Bn) Forecast, 2022 – 2031
Copyright © Transparency Market Research, Inc. All Rights reserved
Trust Online

BI and Analytics Market