
Reports
Reports
Beta-Carotene Market: Introduction
Beta-carotenes are naturally occurring chemicals that are responsible for the reddish-yellow color in various plants. As a natural color, beta-carotenes are adopted as food colorants in various food processing industries such as beverages, confectionaries, packed foods, and others. Beta-carotenes are sourced from plants, animals, and microbial sources in great quantities, in order to cater to the demand for coloring agents in various end-use industries. Beta-carotenes are rich in antioxidant nutrients, which has created a huge demand in pharmaceuticals and dietary supplements in recent years. Since beta-carotenes are a naturally occurring retinol, they are converted into vitamin A during the digestion process. This further creates the growing demand for beta-carotenes in functional foods and feed processing as a binding ingredient. Due to the presence of high concentration of antioxidants and vitamin A, beta-carotenes also find application in natural and synthetic cosmetics. Due to augmenting applications and rising demand, the beta-carotene market is anticipated to proliferate in terms of value and volume during the forecast period.
Beta-Carotene: Market Outlook
The increasing use of beta-carotene in developing natural colors for various food and beverages has fuelled its popularity among consumers in recent years. Along with food and beverages, beta-carotenes are gaining huge traction in dietary supplements, as consumers are showing more interest towards natural and supplements that are rich in vitamins and minerals. Due to the growing demand for organic and natural cosmetics among consumers, manufacturers and product developers started using beta-carotene as a key ingredient in several cosmetics and personal care products. However, natural beta-carotenes have recently been introduced in organic cosmetics. Due to this, it is expected that, there will be launches of new products with natural ingredients, such as beta-carotene, which is anticipated to drive the growth of the global beta-carotene market during the forecast period. In Europe, beta-carotene is the most preferred colorant used in food processing industries.
Beta-Carotene: Market Drivers
Growing Propensity of Beta-Carotene in Food Processing Industries as a Source of Natural Color
Beta-carotenes are widely used in food processing industries as a source of natural color, which provides varied versions of red, yellow, and orange. Due to the emerging demand for natural ingredients and additives, food processing industries have adopted beta-carotenes as a standard coloring agent in various products such as confectionaries, dressings, and other foodstuffs. Thus, the growing consumer awareness regarding the health benefits of natural color sources such as beta-carotenes in recent years is one of the major driving factors of the global beta-carotene market.
High Prevalence of Vitamin A Deficiencies Leading to a Surge in Demand for Beta-Carotene in Functional Foods
The increasing prevalence of vitamin A deficiencies and related diseases in developing economies such as India, Bangladesh, Pakistan, and other South Asian countries has resulted in various public health concerns. As a precursor of vitamin A, beta-carotene is often utilized as a vital fortification ingredient in functional foods such as processed grains, fruit extracts, purees, and others, in order to fight vitamin A deficiencies (VADs). The increasing consumption of beta-carotene as a functional ingredient is anticipated to drive the beta-carotene market in terms of value and volume.
Increasing Penetration of Beta-Carotene in Pharmaceuticals
As an organic compound, beta-carotene has greater application in drug development and carrier medicine processing. In addition, beta-carotenes are rich in antioxidant nutrients that treat oxidative stress and improve cognitive functions, which has created a huge demand for beta-carotenes among drug developers and pharmaceutical manufacturers for developing cognitive medicines, over the past decade. Thus, the pharmaceutical consumption of beta-carotene is one of the strong drivers that is fuelling the growth of the global beta-carotene market.
Dietary Beta-Carotene Reduces Type-2 Diabetes Risk
Owing to their antioxidant properties, beta-carotenes are known to reduce the risk of diabetes. There have been studies associated with the dietary intake of beta-carotenes and the risk of type-2 diabetes. One such study has revealed that, those who follow a diet comprising beta-carotenes and alpha-carotenes present reduced risks of type-2 diabetes among generally healthy men and women.
Rising Incidences of Eye Diseases and Cancer to Boost Beta-Carotene Consumption
Cancer has created a significant social as well as economic health burden – around 8.8 million deaths across the world in 2015, and US$ 87.8 billion expenditure in 2014 for the direct medical cost of cancer treatment in the United States. The World Health Organization estimates that around 253 million people are living with vision disabilities, among which, 36 million are blind, and 217 million people suffer from moderate to severe vision impairment due to vitamin deficiencies. Beta-carotenes have been studied for their anti-carcinogenic properties. The consumption of beta-carotene supplements and medicines formulated with beta-carotenes as a possible prevention of cancer (lung) has been studied extensively. The increasing utilization of beta-carotenes in preventing and curing chronic diseases is likely to escalate its demand in the near future.
Bound to all the above driving factors, it is anticipated that the global beta-carotene market would proliferate in terms of volume and value during the forecast period.
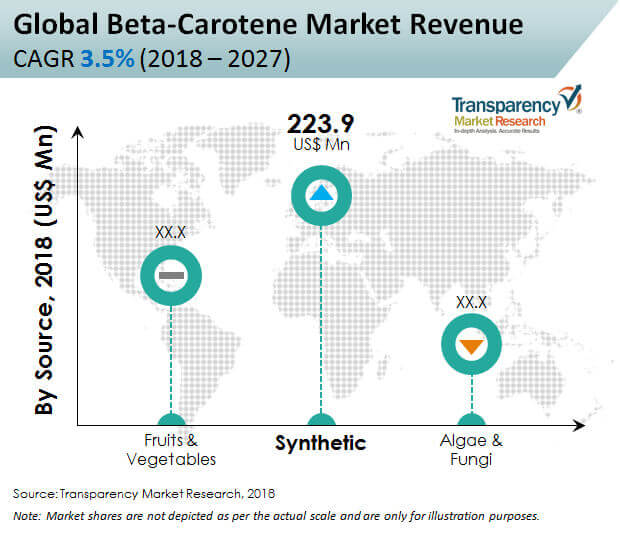
Beta-Carotene Market is estimated to rise at a CAGR of 3.8% during forecast period
Increased product use in nutraceuticals and cosmetics to drive the Beta-Carotene Market
Europe is more attractive for vendors in the Beta-Carotene Market?
Koninklijke DSM N.V., BASF SE., Vidya Herbs PVT Ltd., Chr. Hansen A/S DDW The Colour House Corporation, Novus International, Allied Biotech Corporation, Vinayak Ingredients India Pvt Ltd., Nutralliance is US, BioExtract, and Carotech Berhad are some of the key players working in the global beta-carotene market
The forecast period considered for the Beta-Carotene Market is 2019-2027
1. Global Beta Carotene Market - Executive Summary
2. Global Beta Carotene Market Overview
2.1. Introduction
2.1.1. Global Beta Carotene Market Taxonomy
2.1.2. Global Beta Carotene Market Definition
2.2. Global Beta Carotene Market Size (US$ Mn & Volume) and Forecast, 2013-2027
2.2.1. Global Beta Carotene Market Y-o-Y Growth
2.3. Global Beta Carotene Market Dynamics
2.4. Supply Chain
2.5. Cost Structure
2.6. Pricing Analysis
2.7. Regulatory Framework
2.8. PEST Analysis
2.9. Forecast Factors Influencing the Global Beta-Carotene Market
2.10. Key Participants Market Presence (Intensity Map) By Region
3. Global Beta Carotene Market Analysis and Forecast 2013-2027
3.1. Global Beta Carotene Market Size and Forecast By Source, 2013-2027
3.1.1. Fruits & Vegetables Market Size and Forecast, 2013-2027
3.1.1.1. Revenue (US$ Mn) & Volume (MT) Comparison, By Region
3.1.1.2. Market Share Comparison, By Region
3.1.1.3. Y-o-Y growth Comparison, By Region
3.1.2. Algae & Fungi Market Size and Forecast, 2013-2027
3.1.2.1. Revenue (US$ Mn) & Volume (MT) Comparison, By Region
3.1.2.2. Market Share Comparison, By Region
3.1.2.3. Y-o-Y growth Comparison, By Region
3.1.3. Synthetic Market Size and Forecast, 2013-2027
3.1.3.1. Revenue (US$ Mn) & Volume (MT) Comparison, By Region
3.1.3.2. Market Share Comparison, By Region
3.1.3.3. Y-o-Y growth Comparison, By Region
3.2. Global Beta Carotene Market Size and Forecast By End Use, 2013-2027
3.2.1. Food Market Size and Forecast, 2013-2027
3.2.1.1. Revenue (US$ Mn) & Volume (MT) Comparison, By Region
3.2.1.2. Market Share Comparison, By Region
3.2.1.3. Y-o-Y growth Comparison, By Region
3.2.2. Aquaculture Feed Market Size and Forecast, 2013-2027
3.2.2.1. Revenue (US$ Mn) & Volume (MT) Comparison, By Region
3.2.2.2. Market Share Comparison, By Region
3.2.2.3. Y-o-Y growth Comparison, By Region
3.2.3. Poultry & Pet Feed Market Size and Forecast, 2013-2027
3.2.3.1. Revenue (US$ Mn) & Volume (MT) Comparison, By Region
3.2.3.2. Market Share Comparison, By Region
3.2.3.3. Y-o-Y growth Comparison, By Region
3.2.4. Dietary Supplements Market Size and Forecast, 2013-2027
3.2.4.1. Revenue (US$ Mn) & Volume (MT) Comparison, By Region
3.2.4.2. Market Share Comparison, By Region
3.2.4.3. Y-o-Y growth Comparison, By Region
3.2.5. Pharmaceuticals Market Size and Forecast, 2013-2027
3.2.5.1. Revenue (US$ Mn) & Volume (MT) Comparison, By Region
3.2.5.2. Market Share Comparison, By Region
3.2.5.3. Y-o-Y growth Comparison, By Region
3.2.6. Cosmetics Market Size and Forecast, 2013-2027
3.2.6.1. Revenue (US$ Mn) & Volume (MT) Comparison, By Region
3.2.6.2. Market Share Comparison, By Region
3.2.6.3. Y-o-Y growth Comparison, By Region
4. North America Beta Carotene Market Size and Forecast, 2013-2027
4.1. Revenue (US$ Mn) & Volume (MT) Comparison, By Country
4.2. Revenue (US$ Mn) & Volume (MT) Comparison, By Source
4.3. Revenue (US$ Mn) & Volume (MT) Comparison, By End Use
5. Latin America Beta Carotene Market Size and Forecast, 2013-2027
5.1. Revenue (US$ Mn) & Volume (MT) Comparison, By Country
5.2. Revenue (US$ Mn) & Volume (MT) Comparison, By Source
5.3. Revenue (US$ Mn) & Volume (MT) Comparison, By End Use
6. Europe Beta Carotene Market Size and Forecast, 2013-2027
6.1. Revenue (US$ Mn) & Volume (MT) Comparison, By Country
6.2. Revenue (US$ Mn) & Volume (MT) Comparison, By Source
6.3. Revenue (US$ Mn) & Volume (MT) Comparison, By End Use
7. APAC Beta Carotene Market Size and Forecast, 2013-2027
7.1. Revenue (US$ Mn) & Volume (MT) Comparison, By Country
7.2. Revenue (US$ Mn) & Volume (MT) Comparison, By Source
7.3. Revenue (US$ Mn) & Volume (MT) Comparison, By End Use
8. MEA Beta Carotene Market Size and Forecast, 2013-2027
8.1. Revenue (US$ Mn) & Volume (MT) Comparison, By Country
8.2. Revenue (US$ Mn) & Volume (MT) Comparison, By Source
8.3. Revenue (US$ Mn) & Volume (MT) Comparison, By End Use
9. Beta Carotene Market Size and Forecast, 2013-2027
9.1. Revenue (US$ Mn) & Volume (MT) Comparison, By Country
9.2. Revenue (US$ Mn) & Volume (MT) Comparison, By Source
9.3. Revenue (US$ Mn) & Volume (MT) Comparison, By End Use
10. Global Beta Carotene Market Company Share, Competition Landscape and Company Profiles
10.1. Company Share Analysis
10.2. Competition Landscape
10.3. Company Profiles
10.3.1. BASF SE.
10.3.2. Koninklijke DSM N.V.
10.3.3.Chr. Hansen A/S
10.3.4. DDW The Colour House Corporation
10.3.5. Vidya Herbs Pvt Ltd.
10.3.6. Allied Biotech Corporation
10.3.7. Novus International
10.3.8. Nutralliance
10.3.9. Vinayak Ingredients India Pvt Ltd.
10.3.10. NOW Health Group, Inc.
10.3.11. BioExtract
10.3.12. Carotech Berhad
10.3.13. Döhler GmbH
10.3.14. FMC Corporation
10.3.15. Archer Daniels Midland Company
10.3.16. ColorMaker, Inc.
10.3.17. Penta Manufacturing Company
10.3.18. Food Colour Innovation S.L.
10.3.19. Kingherbs Limited.
10.3.20. TCI Chemicals (India) Pvt. Ltd.
11. Research Methodology
12. Secondary and Primary Sources
13. Assumptions and Acronyms
14. Disclaimer
TABLE 1 Global Beta Carotene Market Value (US$ Mn) & Volume (MT), 2013-2018
TABLE 2 Global Beta Carotene Market Value (US$ Mn) & Volume (MT), 2019-2027
TABLE 3 Global Beta Carotene Market Value (US$ Mn) & Volume and Y-o-Y, 2018-2027
TABLE 4 Global Fruits & Vegetables Segment Value (US$ Mn) & Volume (MT), By Region 2013-2018
TABLE 5 Global Fruits & Vegetables Segment Value (US$ Mn) & Volume (MT), By Region 2019-2027
TABLE 6 Global Fruits & Vegetables Segment Market Share, By Region 2013-2018
TABLE 7 Global Fruits & Vegetables Segment Market Share, By Region 2019-2027
TABLE 8 Global Fruits & Vegetables Segment Y-o-Y, By Region 2018-2027
TABLE 9 Global Algae & Fungi Segment Value (US$ Mn) & Volume (MT), By Region 2013-2018
TABLE 10 Global Algae & Fungi Segment Value (US$ Mn) & Volume (MT), By Region 2019-2027
TABLE 11 Global Algae & Fungi Segment Market Share, By Region 2013-2018
TABLE 12 Global Algae & Fungi Segment Market Share, By Region 2019-2027
TABLE 13 Global Algae & Fungi Segment Y-o-Y, By Region 2018-2027
TABLE 14 Global Synthetic Segment Value (US$ Mn) & Volume (MT), By Region 2013-2018
TABLE 15 Global Synthetic Segment Value (US$ Mn) & Volume (MT), By Region 2019-2027
TABLE 16 Global Synthetic Segment Market Share, By Region 2013-2018
TABLE 17 Global Synthetic Segment Market Share, By Region 2019-2027
TABLE 18 Global Synthetic Segment Y-o-Y, By Region 2018-2027
TABLE 19 Global Food Segment Value (US$ Mn) & Volume (MT), By Region 2013-2018
TABLE 20 Global Food Segment Value (US$ Mn) & Volume (MT), By Region 2019-2027
TABLE 21 Global Food Segment Market Share, By Region 2013-2018
TABLE 22 Global Food Segment Market Share, By Region 2019-2027
TABLE 23 Global Food Segment Y-o-Y, By Region 2018-2027
TABLE 24 Global Aquaculture Feed Segment Value (US$ Mn) & Volume (MT), By Region 2013-2018
TABLE 25 Global Aquaculture Feed Segment Value (US$ Mn) & Volume (MT), By Region 2019-2027
TABLE 26 Global Aquaculture Feed Segment Market Share, By Region 2013-2018
TABLE 27 Global Aquaculture Feed Segment Market Share, By Region 2019-2027
TABLE 28 Global Aquaculture Feed Segment Y-o-Y, By Region 2018-2027
TABLE 29 Global Poultry & Pet Feed Segment Value (US$ Mn) & Volume (MT), By Region 2013-2018
TABLE 30 Global Poultry & Pet Feed Segment Value (US$ Mn) & Volume (MT), By Region 2019-2027
TABLE 31 Global Poultry & Pet Feed Segment Market Share, By Region 2013-2018
TABLE 32 Global Poultry & Pet Feed Segment Market Share, By Region 2019-2027
TABLE 33 Global Poultry & Pet Feed Segment Y-o-Y, By Region 2018-2027
TABLE 34 Global Dietary Supplements Segment Value (US$ Mn) & Volume (MT), By Region 2013-2018
TABLE 35 Global Dietary Supplements Segment Value (US$ Mn) & Volume (MT), By Region 2019-2027
TABLE 36 Global Dietary Supplements Segment Market Share, By Region 2013-2018
TABLE 37 Global Dietary Supplements Segment Market Share, By Region 2019-2027
TABLE 38 Global Dietary Supplements Segment Y-o-Y, By Region 2018-2027
TABLE 39 Global Pharmaceuticals Segment Value (US$ Mn) & Volume (MT), By Region 2013-2018
TABLE 40 Global Pharmaceuticals Segment Value (US$ Mn) & Volume (MT), By Region 2019-2027
TABLE 41 Global Pharmaceuticals Segment Market Share, By Region 2013-2018
TABLE 42 Global Pharmaceuticals Segment Market Share, By Region 2019-2027
TABLE 43 Global Pharmaceuticals Segment Y-o-Y, By Region 2018-2027
TABLE 44 Global Cosmetics Segment Value (US$ Mn) & Volume (MT), By Region 2013-2018
TABLE 45 Global Cosmetics Segment Value (US$ Mn) & Volume (MT), By Region 2019-2027
TABLE 46 Global Cosmetics Segment Market Share, By Region 2013-2018
TABLE 47 Global Cosmetics Segment Market Share, By Region 2019-2027
TABLE 48 Global Cosmetics Segment Y-o-Y, By Region 2018-2027
TABLE 49 North America Beta Carotene Market Value (US$ Mn) & Volume (MT), By Country 2013-2018
TABLE 50 North America Beta Carotene Market Value (US$ Mn) & Volume (MT), By Country 2019-2027
TABLE 51 North America Beta Carotene Market Value (US$ Mn) & Volume (MT), By Source 2013-2018
TABLE 52 North America Beta Carotene Market Value (US$ Mn) & Volume (MT), By Source 2019-2027
TABLE 53 North America Beta Carotene Market Value (US$ Mn) & Volume (MT), By End Use 2013-2018
TABLE 54 North America Beta Carotene Market Value (US$ Mn) & Volume (MT), By End Use 2019-2027
TABLE 55 Latin America Beta Carotene Market Value (US$ Mn) & Volume (MT), By Country 2013-2018
TABLE 56 Latin America Beta Carotene Market Value (US$ Mn) & Volume (MT), By Country 2019-2027
TABLE 57 Latin America Beta Carotene Market Value (US$ Mn) & Volume (MT), By Source 2013-2018
TABLE 58 Latin America Beta Carotene Market Value (US$ Mn) & Volume (MT), By Source 2019-2027
TABLE 59 Latin America Beta Carotene Market Value (US$ Mn) & Volume (MT), By End Use 2013-2018
TABLE 60 Latin America Beta Carotene Market Value (US$ Mn) & Volume (MT), By End Use 2019-2027
TABLE 61 Europe Beta Carotene Market Value (US$ Mn) & Volume (MT), By Country 2013-2018
TABLE 62 Europe Beta Carotene Market Value (US$ Mn) & Volume (MT), By Country 2019-2027
TABLE 63 Europe Beta Carotene Market Value (US$ Mn) & Volume (MT), By Source 2013-2018
TABLE 64 Europe Beta Carotene Market Value (US$ Mn) & Volume (MT), By Source 2019-2027
TABLE 65 Europe Beta Carotene Market Value (US$ Mn) & Volume (MT), By End Use 2013-2018
TABLE 66 Europe Beta Carotene Market Value (US$ Mn) & Volume (MT), By End Use 2019-2027
TABLE 67 APAC Beta Carotene Market Value (US$ Mn) & Volume (MT), By Country 2013-2018
TABLE 68 APAC Beta Carotene Market Value (US$ Mn) & Volume (MT), By Country 2019-2027
TABLE 69 APAC Beta Carotene Market Value (US$ Mn) & Volume (MT), By Source 2013-2018
TABLE 70 APAC Beta Carotene Market Value (US$ Mn) & Volume (MT), By Source 2019-2027
TABLE 71 APAC Beta Carotene Market Value (US$ Mn) & Volume (MT), By End Use 2013-2018
TABLE 72 APAC Beta Carotene Market Value (US$ Mn) & Volume (MT), By End Use 2019-2027
TABLE 73 MEA Beta Carotene Market Value (US$ Mn) & Volume (MT), By Country 2013-2018
TABLE 74 MEA Beta Carotene Market Value (US$ Mn) & Volume (MT), By Country 2019-2027
TABLE 75 MEA Beta Carotene Market Value (US$ Mn) & Volume (MT), By Source 2013-2018
TABLE 76 MEA Beta Carotene Market Value (US$ Mn) & Volume (MT), By Source 2019-2027
TABLE 77 MEA Beta Carotene Market Value (US$ Mn) & Volume (MT), By End Use 2013-2018
TABLE 78 MEA Beta Carotene Market Value (US$ Mn) & Volume (MT), By End Use 2019-2027
FIG. 1 Global Beta Carotene Market Value (US$ Mn), 2013-2018
FIG. 2 Global Beta Carotene Market Value (US$ Mn) Forecast, 2019-2027
FIG. 3 Global Beta Carotene Market Value (US$ Mn) and Y-o-Y, 2018-2027
FIG. 4 Global Fruits & Vegetables Segment Market Value (US$ Mn) By Region, 2013-2018
FIG. 5 Global Fruits & Vegetables Segment Market Value (US$ Mn) By Region, 2019-2027
FIG. 6 Global Fruits & Vegetables Segment Y-o-Y Growth Rate, By Region, 2018-2027
FIG. 7 Global Algae & Fungi Segment Market Value (US$ Mn) By Region, 2013-2018
FIG. 8 Global Algae & Fungi Segment Market Value (US$ Mn) By Region, 2019-2027
FIG. 9 Global Algae & Fungi Segment Y-o-Y Growth Rate, By Region, 2018-2027
FIG. 10 Global Synthetic Segment Market Value (US$ Mn) By Region, 2013-2018
FIG. 11 Global Synthetic Segment Market Value (US$ Mn) By Region, 2019-2027
FIG. 12 Global Synthetic Segment Y-o-Y Growth Rate, By Region, 2018-2027
FIG. 13 Global Food Segment Market Value (US$ Mn) By Region, 2013-2018
FIG. 14 Global Food Segment Market Value (US$ Mn) By Region, 2019-2027
FIG. 15 Global Food Segment Y-o-Y Growth Rate, By Region, 2018-2027
FIG. 16 Global Aquaculture Feed Segment Market Value (US$ Mn) By Region, 2013-2018
FIG. 17 Global Aquaculture Feed Segment Market Value (US$ Mn) By Region, 2019-2027
FIG. 18 Global Aquaculture Feed Segment Y-o-Y Growth Rate, By Region, 2018-2027
FIG. 19 Global Poultry & Pet Feed Segment Market Value (US$ Mn) By Region, 2013-2018
FIG. 20 Global Poultry & Pet Feed Segment Market Value (US$ Mn) By Region, 2019-2027
FIG. 21 Global Poultry & Pet Feed Segment Y-o-Y Growth Rate, By Region, 2018-2027
FIG. 22 Global Dietary Supplements Segment Market Value (US$ Mn) By Region, 2013-2018
FIG. 23 Global Dietary Supplements Segment Market Value (US$ Mn) By Region, 2019-2027
FIG. 24 Global Dietary Supplements Segment Y-o-Y Growth Rate, By Region, 2018-2027
FIG. 25 Global Pharmaceuticals Segment Market Value (US$ Mn) By Region, 2013-2018
FIG. 26 Global Pharmaceuticals Segment Market Value (US$ Mn) By Region, 2019-2027
FIG. 27 Global Pharmaceuticals Segment Y-o-Y Growth Rate, By Region, 2018-2027
FIG. 28 Global Cosmetics Segment Market Value (US$ Mn) By Region, 2013-2018
FIG. 29 Global Cosmetics Segment Market Value (US$ Mn) By Region, 2019-2027
FIG. 30 Global Cosmetics Segment Y-o-Y Growth Rate, By Region, 2018-2027
FIG. 31 North America Beta Carotene Market Value (US$ Mn), By Country 2013-2018
FIG. 32 North America Beta Carotene Market Value (US$ Mn), By Country 2019-2027
FIG. 33 North America Beta Carotene Market Value (US$ Mn), By Source 2013-2018
FIG. 34 North America Beta Carotene Market Value (US$ Mn), By Source 2019-2027
FIG. 35 North America Beta Carotene Market Value (US$ Mn), By End Use 2013-2018
FIG. 36 North America Beta Carotene Market Value (US$ Mn), By End Use 2019-2027
FIG. 37 Latin America Beta Carotene Market Value (US$ Mn), By Country 2013-2018
FIG. 38 Latin America Beta Carotene Market Value (US$ Mn), By Country 2019-2027
FIG. 39 Latin America Beta Carotene Market Value (US$ Mn), By Source 2013-2018
FIG. 40 Latin America Beta Carotene Market Value (US$ Mn), By Source 2019-2027
FIG. 41 Latin America Beta Carotene Market Value (US$ Mn), By End Use 2013-2018
FIG. 42 Latin America Beta Carotene Market Value (US$ Mn), By End Use 2019-2027
FIG. 43 Europe Beta Carotene Market Value (US$ Mn), By Country 2013-2018
FIG. 44 Europe Beta Carotene Market Value (US$ Mn), By Country 2019-2027
FIG. 45 Europe Beta Carotene Market Value (US$ Mn), By Source 2013-2018
FIG. 46 Europe Beta Carotene Market Value (US$ Mn), By Source 2019-2027
FIG. 47 Europe Beta Carotene Market Value (US$ Mn), By End Use 2013-2018
FIG. 48 Europe Beta Carotene Market Value (US$ Mn), By End Use 2019-2027
FIG. 49 APAC Beta Carotene Market Value (US$ Mn), By Country 2013-2018
FIG. 50 APAC Beta Carotene Market Value (US$ Mn), By Country 2019-2027
FIG. 51 APAC Beta Carotene Market Value (US$ Mn), By Source 2013-2018
FIG. 52 APAC Beta Carotene Market Value (US$ Mn), By Source 2019-2027
FIG. 53 APAC Beta Carotene Market Value (US$ Mn), By 2013-2018
FIG. 54 APAC Beta Carotene Market Value (US$ Mn), By End Use 2019-2027
FIG. 55 MEA Beta Carotene Market Value (US$ Mn), By Country 2013-2018
FIG. 56 MEA Beta Carotene Market Value (US$ Mn), By Country 2019-2027
FIG. 57 MEA Beta Carotene Market Value (US$ Mn), By Source 2013-2018
FIG. 58 MEA Beta Carotene Market Value (US$ Mn), By Source 2019-2027
FIG. 59 MEA Beta Carotene Market Value (US$ Mn), By End Use 2013-2018
FIG. 60 MEA Beta Carotene Market Value (US$ Mn), By End Use 2019-2027
Copyright © Transparency Market Research, Inc. All Rights reserved
Trust Online

Beta-Carotene Market Global Forecast 2027