
Reports
Reports
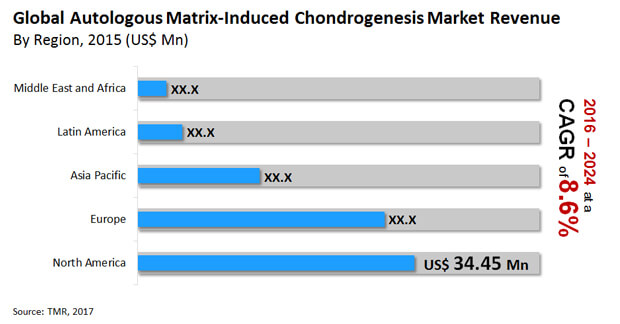
Rise in the inclination among patients toward non-invasive surgeries is anticipated to boost the sales growth in the global autologous matrix-induced chondrogenesis market. Hence, the market for autologous matrix-induced chondrogenesis is prognosticated to expand at a CAGR of 8.6% during the forecast period of 2016 to 2024 and reach a valuation of US$186.38 Mn by 2024.
A report by Transparency Market Research (TMR) delivers panoramic view of the global autologous matrix-induced chondrogenesis market. Hence, readers are provided comprehensive assessment of major crucial factors such as growth drivers, expansion opportunities, investment avenues, demand-supply ratio, challenges, restraints, and key regions of the market for autologous matrix-induced chondrogenesis.
The analysts of study by TMR have performed the segmentation of the global autologous matrix-induced chondrogenesis market based on several crucial parameters such as material and region. In terms of material, the market is divided into many parts such as collagen, hyaluronic acid, poly lactic-co-glycolic acid (PGLA), and polyethylene glycol (PEG), and others.
A human body comprises of about 30% collagen of all protein. Thus, collagen is used in a wide range of tissue engineering applications. In addition, it is gaining traction owing to its numerous advantages such as excellent handling properties and high tensile strength. These factors shows that the collagen segment of the global autologous matrix-induced chondrogenesis market is likely to offer revenue-generation opportunities in the years ahead.
The global autologous matrix-induced chondrogenesis market is estimated to be propelled by several important factors such as a surge in number of older populace across the globe and increase in understanding on the availability of autologous matrix-induced chondrogenesis techniques.
Microfracture surgeries are considered one of the efficient techniques for the repair of articular cartilage injury. In these surgeries, autologous matrix-induced chondrogenesis (AMIC) utilize bi-layer collagen membrane. Hence, increase in number of patients dealing with bone and joint disorders are expected to propel the autologous matrix-induced chondrogenesis market in the forecast period.
Several important regions studied in the TMR report on the global autologous matrix-induced chondrogenesis market include Europe, North America, Latin America, Middle East and Africa, and Asia Pacific. Among all regions, North America holds major share of the market.
In North America, there is a notable increase in number of older population, which is at higher risk of different health issues including bone and joint disorders. Hence, the autologous matrix-induced chondrogenesis market is prognosticated to experience high revenue-generation opportunities in North America with rising prevalence of several diseases pertaining to bone and joints, including rheumatoid arthritis and arthritis, among older population.
The nature of the global autologous matrix-induced chondrogenesis market is fairly consolidated with a few companies holding major share of the global market. Hence, the competition levels in the market are highly intense. Players are using organic and inorganic strategies in order to sustain in this competition.
Players operating in the autologous matrix-induced chondrogenesis market are focused on the expansion of businesses in several developing nations. Moreover, are investing heavily in R&D projects in order to develop and launch breakthrough products. These initiatives are estimated to work in favor of the global autologous matrix-induced chondrogenesis market in the forecast period.
Some key players operating in the autologous matrix-induced chondrogenesis market include BioTissue AG, JRI Orthopaedics Ltd., B. Braun Melsungen AG, Anika Therapeutics, Inc., Geistlich Pharma AG, Arthro-Kinetics, Smith & Nephew plc, Zimmer Biomet Holdings, and CartiHeal, Matricel GmbH.
Enterprises in the autologous matrix-induced chondrogenesis market are developing strong policies in order to sustain their businesses in unfavorable situations they are facing owing to the COVID-19 outbreak. They are focused on continuing on their regular activities while following all safety norms implemented by the regional government bodies.
Autologous Matrix-induced Chondrogenesis Market was worth US$89.71 mn and is projected to reach a value of US$186.38 mn by the end of 2024
Autologous Matrix-induced Chondrogenesis Market is anticipated to grow at a CAGR of 8.60% during the forecast period
North America accounted for a major share of the global Autologous Matrix-induced Chondrogenesis Market
Rise in the inclination among patients toward non-invasive surgeries are driving the growth factors of Autologous Matrix-induced Chondrogenesis Market
Key players in the global Autologous Matrix-induced Chondrogenesis Market include BioTissue AG, JRI Orthopaedics Ltd., B. Braun Melsungen AG, Anika Therapeutics, Inc., Geistlich Pharma AG, Arthro-Kinetics, Smith & Nephew plc, Zimmer Biomet Holdings, and CartiHeal, Matricel GmbH.
Section - 1 Preface
1.1 Report Scope and Market Segmentation
1.2 Research Highlights
Section - 2 Assumptions and Research Methodology
2.1 Assumptions and Acronyms Used
2.2 Research Methodology
Section-3 Executive Summary
3.1 Global AMIC Market: Market Snapshot
3.2 Global AMIC Market : Opportunity Map
Section-4 Market Overview
4.1 Global AMIC Market : Key Industry Developments
Section-5 Market Dynamics
5.1 Drivers and Restraints Snapshot Analysis
5.1.2 Drivers
5.1.2.1 Increasing Demand for Minimally Invasive Procedures
5.1.2.2 Economically Efficient
5.1.2.3 Rising Prevalence of Bone and Joint Disorders
5.1.2.4 Aging Population
5.1.2.5 Surge in Sports Injuries
5.1.2.6 Reduces Life Risk and Faster Recovery
5.1.3 Restraints
5.1.3.1 Lack of Efficient Reimbursement System
5.1.3.2 Lack of Extensive Clinical Data
5.1.4 Opportunity Analysis
5.1.4.1 Emerging Economies to Offer Sustained Growth Opportunities
5.1.4.2 Extending Distribution Network by Partnership/Acquisitions
5.2 Global AMIC Market Revenue Projection
5.3 Porter’s Five Forces Analysis
5.4 Value Chain Analysis
5.5 AMIC Market Outlook
Section-6 AMIC Market Analysis By Material
6.1 Key Findings
6.2 Introduction
6.3 Global AMIC Market Value Share Analysis, By Product Type
6.4 Global AMIC Market Forecast By Product Type
6.4.1 Hyaluronic Acid
6.4.2 Collagen
6.4.3 Polyethylene glycol (PEG)
6.4.4 Poly lactic-co-glycolic acid (PGLA)
6.4.5 Others
6.5 Global AMIC Market Attractiveness Analysis By Material
Section-7 Global AMIC Market Analysis By Region
7.1 Global Regulatory Scenario
7.2 Global AMIC Market Value Share Analysis, By Region
7.3 Global AMIC Market Forecast, By Region
7.4 Global AMIC Market Attractiveness Analysis, By Region Type
Section-8 North America AMIC Market Analysis
8.1 Key Findings
8.2 North America AMIC Market Overview
8.3 North America Market Value Share Analysis, By Material
8.3.1 North America Market Forecast By Material
8.4 North America Market Forecast By Country
8.5 North America Market Attractiveness Analysis
8.6 North America Market Trends
Section-9 Europe AMIC Market Analysis
9.1 Key Findings
9.2 Europe ABC Market Overview
9.3 Europe Market Value Share Analysis, By Material
9.3.1 Europe Market Forecast By Material
9.4 Europe Market Forecast By Country
9.5 Europe Market Attractiveness Analysis
9.6 Europe Market Trends
Section-10 Asia Pacific AMIC Market Analysis
10.1 Key Findings
10.2 Asia Pacific AMIC Market Overview
10.3 Asia Pacific Market Value Share Analysis, By Material
10.3.1 Asia Pacific Market Forecast By Material
10.4 Asia Pacific Market Forecast By Country
10.5 Asia Pacific Market Attractiveness Analysis
10.6 Asia Pacific Market Trends
Section-11 Latin America AMIC Market Analysis
11.1 Key Findings
11.2 Latin America AMIC Market Overview
11.3 Latin America Market Value Share Analysis, By Material
11.3.1 Latin America Market Forecast By Material
11.4 Latin America Market Forecast By Country
11.5 Latin America Market Attractiveness Analysis
11.6 Latin America Market Trends
Section-12 Middle East and Africa AMIC Market Analysis
12.1 Key Findings
12.2 Middle East and Africa AMIC Market Overview
12.3 Middle East and Africa Market Value Share Analysis, By Material
12.3.1 Middle East and Africa Market Forecast By Material
12.4 Middle East and Africa Market Forecast By Country
12.5 Middle East and Africa Market Attractiveness Analysis
Section-13 Competition Landscape
13.1. Competition Matrix
13.2. Company Profiles
13.2.1. Anika Therapeutics, Inc.
13.2.1.1. Company Overview (HQ, Business Segments, Employee Strength)
13.2.1.2. Financial Overview
13.2.1.3. Product Portfolio
13.2.1.4. SWOT Analysis
13.2.1.5. Strategic Overview
13.2.2 Arthro-Kinetics
13.2.2.1. Company Overview (HQ, Business Segments, Employee Strength)
13.2.2.2. Financial Overview
13.2.2.3. Product Portfolio
13.2.2.4. SWOT Analysis
13.2.2.5. Strategic Overview
13.2.3 B. Braun Melsungen AG
13.2.3.1. Company Overview (HQ, Business Segments, Employee Strength)
13.2.3.2. Financial Overview
13.2.3.3. Product Portfolio
13.2.3.4. SWOT Analysis
13.2.3.5. Strategic Overview
13.2.4 BioTissue AG
13.2.4.1. Company Overview (HQ, Business Segments, Employee Strength)
13.2.4.2. Financial Overview
13.2.4.3. Product Portfolio
13.2.4.4. SWOT Analysis
13.2.4.5. Strategic Overview
13.2.5 CartiHeal
13.2.5.1. Company Overview (HQ, Business Segments, Employee Strength)
13.2.5.2. Financial Overview
13.2.5.3. Product Portfolio
13.2.5.4. SWOT Analysis
13.2.5.5. Strategic Overview
13.2.6 Geistlich Pharma AG
13.2.6.1. Company Overview (HQ, Business Segments, Employee Strength)
13.2.6.2. Financial Overview
13.2.6.3. Product Portfolio
13.2.6.4. SWOT Analysis
13.2.6.5. Strategic Overview
13.2.7 JRI Orthopaedics Ltd.
13.2.7.1. Company Overview (HQ, Business Segments, Employee Strength)
13.2.7.2. Financial Overview
13.2.7.3. Product Portfolio
13.2.7.4. SWOT Analysis
13.2.7.5. Strategic Overview
13.2.8 Matricel GmbH
13.2.8.1. Company Overview (HQ, Business Segments, Employee Strength)
13.2.8.2. Financial Overview
13.2.8.3. Product Portfolio
13.2.8.4. SWOT Analysis
13.2.8.5. Strategic Overview
13.2.9 Smith & Nephew plc
13.2.9.1. Company Overview (HQ, Business Segments, Employee Strength)
13.2.9.2. Financial Overview
13.2.9.3. Product Portfolio
13.2.9.4. SWOT Analysis
13.2.9.5. Strategic Overview
13.2.10 Zimmer Biomet Holdings
13.2.10.1. Company Overview (HQ, Business Segments, Employee Strength)
13.2.10.2. Financial Overview
13.2.10.3. Product Portfolio
13.2.10.4. SWOT Analysis
13.2.10.5. Strategic Overview
List of Tables
Table 01: Global Autologous Matrix-Induced Chondrogenesis Market Size (US$ Mn) Forecast, by Material, 2014–2024
Table 02: Global Market Size (US$ Mn) Forecast, by Region, 2014–2024
Table 03: North America Autologous Matrix-Induced Chondrogenesis Market Size (US$ Mn) Forecast, by Material, 2014–2024
Table 04: North America Market Size (US$ Mn) Forecast, by Country, 2014–2024
Table 05: Europe Autologous Matrix-Induced Chondrogenesis Market Size (US$ Mn) Forecast, by Material, 2014–2024
Table 06: Europe Market Size (US$ Mn) Forecast, by Country, 2014–2024
Table 07: Asia Pacific Autologous Matrix-Induced Chondrogenesis Market Size (US$ Mn) Forecast, by Material, 2014–2024
Table 08: Asia Pacific Market Size (US$ Mn) Forecast, by Country, 2014–2024
Table 09: Latin America Autologous Matrix-Induced Chondrogenesis Market Size (US$ Mn) Forecast, by Material, 2014–2024
Table 10: Latin America Market Size (US$ Mn) Forecast, by Country, 2014–2024
Table 11: Middle East & Africa Autologous Matrix-Induced Chondrogenesis Market Size (US$ Mn) Forecast, by Material, 2014–2024
Table 12: Middle East & Africa Market Size (US$ Mn) Forecast, by Country, 2014–2024
List of Figures
Figure 01: Global Autologous Matrix-Induced Chondrogenesis Market Size (US$ Mn) Forecast, 2014–2024
Figure 02: Global AMIC Market Value Share Analysis, by Material, 2016 and 2024
Figure 03: Global Hyaluronic Acid Market Revenue (US$ Mn), 2014–2024
Figure 04: Global Collagen Market Revenue (US$ Mn), 2014–2024
Figure 05: Global PEG Market Revenue (US$ Mn), 2014–2024
Figure 06: Global PGLA Market Revenue (US$ Mn), 2014–2024
Figure 07: Global Others Market Revenue (US$ Mn), 2014–2024
Figure 08: AMIC Market Attractiveness Analysis, by Material
Figure 09: Global AMIC Market Value Share Analysis, by Region, 2016 and 2024
Figure 10: AMIC Market Attractiveness Analysis, by Region
Figure 11: North America Autologous Matrix-Induced Chondrogenesis Market Size (US$ Mn) Forecast, 2014–2024
Figure 12: North America Autologous Matrix-Induced Chondrogenesis Market Size Y-o-Y Growth Projections, 2015–2024
Figure 13: North America Market Attractiveness Analysis, by Country
Figure 14: North America AMIC Market Value Share Analysis, by Material, 2015 and 2024
Figure 15: North America AMIC Market Value Share Analysis, by Country, 2016 and 2024
Figure 16: North America Market Attractiveness Analysis, by Material
Figure 17: Europe Autologous Matrix-Induced Chondrogenesis Market Size (US$ Mn) Forecast, 2014–2024
Figure 18: Europe Autologous Matrix-Induced Chondrogenesis Market Size Y-o-Y Growth Projections, 2015–2024
Figure 19: Europe Market Attractiveness Analysis, by Country
Figure 20: Europe AMIC Market Value Share Analysis, by Material, 2015 and 2024
Figure 21: Europe AMIC Market Value Share Analysis, by Country, 2015 and 2024
Figure 22: Europe AMIC Market Attractiveness Analysis, by Material
Figure 23: Asia Pacific AMIC Market Size (US$ Mn) and Forecast, 2014–2024
Figure 24: Asia Pacific AMIC Market Size Y-o-Y Growth Projections, 2015–2024
Figure 25: Asia Pacific Market Attractiveness Analysis, by Country
Figure 26: Asia Pacific AMIC Market Value Share Analysis, by Material, 2015 and 2024
Figure 27: Asia Pacific AMIC Market Value Share Analysis, by Country, 2015 and 2024
Figure 28: Asia Pacific AMIC Market Attractiveness Analysis, by Material
Figure 29: Latin America AMIC Market Size (US$ Mn) Forecast, 2014–2024
Figure 30: Latin America AMIC Market Size Y-o-Y Growth Projection, 2014–2024
Figure 31: Latin America Market Attractiveness Analysis, by Country/Region
Figure 32: Latin America AMIC Market Value Share Analysis, by Material, 2015 and 2024
Figure 33: Latin America AMIC Market Value Share Analysis, by Country, 2015 and 2024
Figure 34: Latin America AMIC Market Attractiveness Analysis, by Material
Figure 35: Middle East & Africa AMIC Market Size (US$ Mn) Forecast, 2014–2024
Figure 36: Middle East & Africa AMIC Market Size Y-o-Y Growth Projections, 2015–2024
Figure 37: Middle East & Africa Market Attractiveness Analysis, by Country
Figure 38: Middle East & Africa AMIC Market Value Share Analysis, by Material, 2015 and 2024
Figure 39: Middle East & Africa AMIC Market Value Share Analysis, by Country, 2016 and 2024
Figure 40: Middle East & Africa Market Attractiveness Analysis, by Material
Figure 41: Global Autologous Matrix-Induced Chondrogenesis Market Share Analysis By Company, (2015)
Copyright © Transparency Market Research, Inc. All Rights reserved
Trust Online

Autologous Matrix-induced Chondrogenesis Market Forecast Report, 2016-2024