
Reports
Reports
Growing prevalence of obesity continues to impact health of the patients adversely. Prevalence of obesity is bound to various factors such as improper diet, chronic stress and intake of medications for diabetes and depression. Untreated obesity has led to health issues such as diabetes, sleep apnea, high blood pressure, heart disease, cancer, osteoarthritis and psychosocial effects.
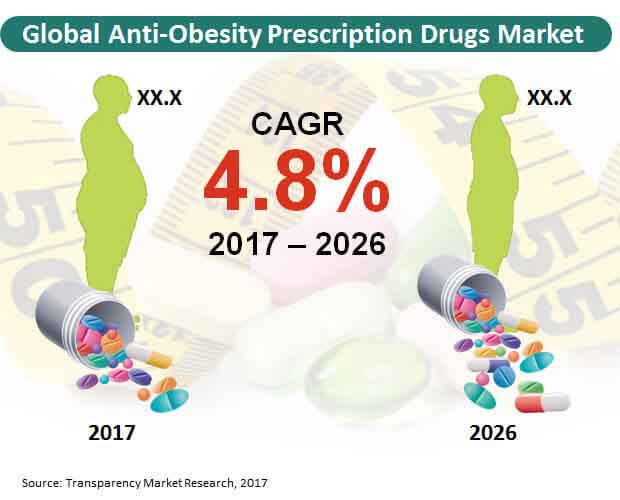
According to Transparency Market Research, the global anti-obesity prescription drugs market is expected to represent a value of over US$ 1,000 Mn by the end of 2026.
Market Taxonomy
|
Region |
Drug Class |
Age Group |
Distribution Channel |
|---|---|---|---|
|
|
|
|
|
|
|
|
|
|
|
|
|
|
|
|
|
|
|
|
|
|
|
|
(Additional information, including cross-sectional data and country-wise analysis & forecast is available in the report)
Cholesterol-Rich Food Products to Boost Sales
According to a recent report by CDC, over one-third of the adults in the U.S. have obesity. Consumption of the food products that are high in cholesterol has been a major contributor to the obese population. Increasing consumption of the unhealthy food products such as potato chips, meat, bacon, chocolates and other sugary treats has led to growing prevalence of obesity globally. Moreover, surge in consumption of alcoholic beverages is further expected to contribute towards obesity. Growing prevalence of obesity due to increasing consumption of cholesterol-rich and unhealthy food products and beverages is likely to impact growth of the global obesity prescription drugs market positively.
Chronic Stress to Contribute towards Obesity
Increasing level of stress can lead people to consume unhealthy food products that hinder the brain activity and have a counteracting effect on the emotional and physical stress. In addition, surge in the stress level leads to “comfort eating”, due to which the end users are more prone to obesity. Moreover, prolonged stress due to emotional pressure leads the brain to release cortisol hormones, which increases the appetite levels in the person. Eating disorders and consumption of unhealthy food products lead to long-term problems for the blood vessels and heart. Consumption of unhealthy food products and beverages in order to counter stress-related problems further contributes towards obesity. Bound to these factors, the global anti-obesity prescription drugs market is expected to witness positive growth during the forecast period.
Appetite Stimulating Side-Effects of Psychotropic Drugs to Fuel Demand for Obesity Management
Obesity has also been a result of consuming drugs for diabetes such as sulfonylureas, insulin and thiazolidinediones. A recent report by CDC states that 9.4% of the population in the U.S. have diabetes. Consumption of drugs for diabetes stimulate appetite, due to which the patients eat more and gain weight. Moreover, obesity is also a common side-effect of consuming antidepressants drugs. As consumption of anti-depressant drugs stimulate hunger, consumers tend to eat more. These factors further contribute towards prevalence of obesity globally. Surge in the obese population is attributed to increasing consumption of the antidepressant and diabetes drugs, which is expected to impact growth of the global anti-obesity prescription drugs market.
Practicing Yoga Exercises to Inhibit Market Growth
On the other hand, various factors are expected to inhibit growth of the global anti-obesity prescription drugs market. Obese people are increasingly opting for various exercises that enable them to lose weight. As yoga practices are becoming popular, obese patients are increasingly practicing yoga exercises in order to reduce the weight and treat hypertension. In order to shed body fats, the obese people are increasingly opting for sugar free food products and planning diets that help in reducing weight of the end users. These factors are expected to impact growth of the global anti-obesity prescription drugs market negatively.
Liraglutide Drug Class to Represent a Leading Segment
With the increasing blood sugar levels, doctors are prescribing the liraglutide medicines to the patients in order to reduce the risk of obesity. On the basis of drug class, the liraglutide segment is expected to represent the highest revenue growth, accounting for a value of over US$ 100 Mn by the end of 2026. On the other hand, the bupropion and naltrexone drug class segment is expected to register a robust CAGR during the forecast period.
Based on age group, the adult segment is expected to witness the highest growth in terms of revenue, recording a value of over US$ 100 Mn by the end of 2017. Along with the pediatric age group segment, the adult age group segment is expected to register a healthy CAGR through 2026.
By distribution channel, the hospital pharmacies segment is expected to represent significant revenue growth, representing a value of over US$ 100 Mn by the end of 2026. Moreover, the hospital pharmacies distribution channel segment is expected to register the highest CAGR during the forecast period.
Competition Tracking
Leading market players operating in the global anti-obesity prescription drugs market include F Hoffmann La Roche Ltd, Orexigen Therapeutics, Inc, Arena Pharmaceuticals, Inc, VIVUS, Inc and Novo Nordisk A/S.
1. Global Anti-Obesity Prescription Drugs Market - Executive Summary
2. Global Anti-Obesity Prescription Drugs Market Overview
2.1. Introduction
2.1.1. Global Anti-Obesity Prescription Drugs Market Taxonomy
2.1.2. Global Anti-Obesity Prescription Drugs Market Definition
2.2. Global Anti-Obesity Prescription Drugs Market Size (US$ Mn) and Forecast, 2012-2026
2.2.1. Global Anti-Obesity Prescription Drugs Market Y-o-Y Growth
2.3. Global Anti-Obesity Prescription Drugs Market Dynamics
2.4. Supply Chain
2.5. Cost Structure
2.6. Pricing Analysis
2.7. PESTLE Analysis
2.8. Product Life Cycle Analysis
2.9. Key Regulations
2.10. Patents
2.11. List of Distributors
2.12. Key Participants Market Presence (Intensity Map) By Region
3. Global Anti-Obesity Prescription Drugs Market Analysis and Forecast 2012-2026
3.1. Global Anti-Obesity Prescription Drugs Market Size and Forecast By Drug Class, 2012-2026
3.1.1. Bupropion and Naltrexone Market Size and Forecast, 2012-2026
3.1.1.1. Revenue (US$ Mn) Comparison, By Region
3.1.1.2. Market Share Comparison, By Region
3.1.1.3. Y-o-Y growth Comparison, By Region
3.1.2. Orlistat Market Size and Forecast, 2012-2026
3.1.2.1. Revenue (US$ Mn) Comparison, By Region
3.1.2.2. Market Share Comparison, By Region
3.1.2.3. Y-o-Y growth Comparison, By Region
3.1.3. Lorcaserin Market Size and Forecast, 2012-2026
3.1.3.1. Revenue (US$ Mn) Comparison, By Region
3.1.3.2. Market Share Comparison, By Region
3.1.3.3. Y-o-Y growth Comparison, By Region
3.1.4. Phentermine and Topiramate Market Size and Forecast, 2012-2026
3.1.4.1. Revenue (US$ Mn) Comparison, By Region
3.1.4.2. Market Share Comparison, By Region
3.1.4.3. Y-o-Y growth Comparison, By Region
3.1.5. Liraglutide Market Size and Forecast, 2012-2026
3.1.5.1. Revenue (US$ Mn) Comparison, By Region
3.1.5.2. Market Share Comparison, By Region
3.1.5.3. Y-o-Y growth Comparison, By Region
3.2. Global Anti-Obesity Prescription Drugs Market Size and Forecast By Age Group, 2012-2026
3.2.1. Pediatric Market Size and Forecast, 2012-2026
3.2.1.1. Revenue (US$ Mn) Comparison, By Region
3.2.1.2. Market Share Comparison, By Region
3.2.1.3. Y-o-Y growth Comparison, By Region
3.2.2. Adult Market Size and Forecast, 2012-2026
3.2.2.1. Revenue (US$ Mn) Comparison, By Region
3.2.2.2. Market Share Comparison, By Region
3.2.2.3. Y-o-Y growth Comparison, By Region
3.3. Global Anti-Obesity Prescription Drugs Market Size and Forecast By Distribution Channel, 2012-2026
3.3.1. Hospitals Pharmacies Market Size and Forecast, 2012-2026
3.3.1.1. Revenue (US$ Mn) Comparison, By Region
3.3.1.2. Market Share Comparison, By Region
3.3.1.3. Y-o-Y growth Comparison, By Region
3.3.2. Retail Pharmacies Market Size and Forecast, 2012-2026
3.3.2.1. Revenue (US$ Mn) Comparison, By Region
3.3.2.2. Market Share Comparison, By Region
3.3.2.3. Y-o-Y growth Comparison, By Region
3.3.3. E-commerce Market Size and Forecast, 2012-2026
3.3.3.1. Revenue (US$ Mn) Comparison, By Region
3.3.3.2. Market Share Comparison, By Region
3.3.3.3. Y-o-Y growth Comparison, By Region
4. North America Anti-Obesity Prescription Drugs Market Size and Forecast, 2012-2026
4.1. Revenue (US$ Mn) Comparison, By Country
4.2. Revenue (US$ Mn) Comparison, By Drug Class
4.3. Revenue (US$ Mn) Comparison, By Age Group
4.4. Revenue (US$ Mn) Comparison, By Distribution Channel
5. Latin America Anti-Obesity Prescription Drugs Market Size and Forecast, 2012-2026
5.1. Revenue (US$ Mn) Comparison, By Country
5.2. Revenue (US$ Mn) Comparison, By Drug Class
5.3. Revenue (US$ Mn) Comparison, By Age Group
5.4. Revenue (US$ Mn) Comparison, By Distribution Channel
6. Europe Anti-Obesity Prescription Drugs Market Size and Forecast, 2012-2026
6.1. Revenue (US$ Mn) Comparison, By Country
6.2. Revenue (US$ Mn) Comparison, By Drug Class
6.3. Revenue (US$ Mn) Comparison, By Age Group
6.4. Revenue (US$ Mn) Comparison, By Distribution Channel
7. Japan Anti-Obesity Prescription Drugs Market Size and Forecast, 2012-2026
7.1. Revenue (US$ Mn) Comparison, By Country
7.2. Revenue (US$ Mn) Comparison, By Drug Class
7.3. Revenue (US$ Mn) Comparison, By Age Group
7.4. Revenue (US$ Mn) Comparison, By Distribution Channel
8. APEJ Anti-Obesity Prescription Drugs Market Size and Forecast, 2012-2026
8.1. Revenue (US$ Mn) Comparison, By Country
8.2. Revenue (US$ Mn) Comparison, By Drug Class
8.3. Revenue (US$ Mn) Comparison, By Age Group
8.4. Revenue (US$ Mn) Comparison, By Distribution Channel
9. MEA Anti-Obesity Prescription Drugs Market Size and Forecast, 2012-2026
9.1. Revenue (US$ Mn) Comparison, By Country
9.2. Revenue (US$ Mn) Comparison, By Drug Class
9.3. Revenue (US$ Mn) Comparison, By Age Group
9.4. Revenue (US$ Mn) Comparison, By Distribution Channel
10. Global Anti-Obesity Prescription Drugs Market Company Share, Competition Landscape and Company Profiles
10.1. Company Share Analysis
10.2. Competition Landscape
10.3. Company Profiles
10.3.1. VIVUS Inc.
10.3.2. Novo Nordisk A/S
10.3.3. GlaxoSmithKline PLC
10.3.4. Roche Holding AG
10.3.5. Arena Pharmaceuticals, Inc.
10.3.6. Orexigen Therapeutics, Inc.
10.3.7. Merck & Co Inc.
10.3.8. Sun Pharmaceutical Industries Limited
10.3.9 Takeda Pharmaceutical Company Limited
10.3.10 Pfizer Inc.
11. Research Methodology
12. Secondary and Primary Sources
13. Assumptions and Acronyms
14. Disclaimer
List of Tables
TABLE 1 Global Anti-Obesity Prescription Drugs Market Value (US$ Mn), 2012-2017
TABLE 2 Global Anti-Obesity Prescription Drugs Market Value (US$ Mn), 2018-2026
TABLE 3 Global Anti-Obesity Prescription Drugs Market Value (US$ Mn) and Y-o-Y, 2017-2026
TABLE 4 Global Bupropion and Naltrexone Segment Value (US$ Mn), By Region 2012-2017
TABLE 5 Global Bupropion and Naltrexone Segment Value (US$ Mn), By Region 2018-2026
TABLE 6 Global Bupropion and Naltrexone Segment Market Share, By Region 2012-2017
TABLE 7 Global Bupropion and Naltrexone Segment Market Share, By Region 2018-2026
TABLE 8 Global Bupropion and Naltrexone Segment Y-o-Y, By Region 2017-2026
TABLE 9 Global Orlistat Segment Value (US$ Mn), By Region 2012-2017
TABLE 10 Global Orlistat Segment Value (US$ Mn), By Region 2018-2026
TABLE 11 Global Orlistat Segment Market Share, By Region 2012-2017
TABLE 12 Global Orlistat Segment Market Share, By Region 2018-2026
TABLE 13 Global Orlistat Segment Y-o-Y, By Region 2017-2026
TABLE 14 Global Lorcaserin Segment Value (US$ Mn), By Region 2012-2017
TABLE 15 Global Lorcaserin Segment Value (US$ Mn), By Region 2018-2026
TABLE 16 Global Lorcaserin Segment Market Share, By Region 2012-2017
TABLE 17 Global Lorcaserin Segment Market Share, By Region 2018-2026
TABLE 18 Global Lorcaserin Segment Y-o-Y, By Region 2017-2026
TABLE 19 Global Phentermine and Topiramate Segment Value (US$ Mn), By Region 2012-2017
TABLE 20 Global Phentermine and Topiramate Segment Value (US$ Mn), By Region 2018-2026
TABLE 21 Global Phentermine and Topiramate Segment Market Share, By Region 2012-2017
TABLE 22 Global Phentermine and Topiramate Segment Market Share, By Region 2018-2026
TABLE 23 Global Phentermine and Topiramate Segment Y-o-Y, By Region 2017-2026
TABLE 24 Global Liraglutide Segment Value (US$ Mn), By Region 2012-2017
TABLE 25 Global Liraglutide Segment Value (US$ Mn), By Region 2018-2026
TABLE 26 Global Liraglutide Segment Market Share, By Region 2012-2017
TABLE 27 Global Liraglutide Segment Market Share, By Region 2018-2026
TABLE 28 Global Liraglutide Segment Y-o-Y, By Region 2017-2026
TABLE 29 Global Pediatric Segment Value (US$ Mn), By Region 2012-2017
TABLE 30 Global Pediatric Segment Value (US$ Mn), By Region 2018-2026
TABLE 31 Global Pediatric Segment Market Share, By Region 2012-2017
TABLE 32 Global Pediatric Segment Market Share, By Region 2018-2026
TABLE 33 Global Pediatric Segment Y-o-Y, By Region 2017-2026
TABLE 34 Global Adult Segment Value (US$ Mn), By Region 2012-2017
TABLE 35 Global Adult Segment Value (US$ Mn), By Region 2018-2026
TABLE 36 Global Adult Segment Market Share, By Region 2012-2017
TABLE 37 Global Adult Segment Market Share, By Region 2018-2026
TABLE 38 Global Adult Segment Y-o-Y, By Region 2017-2026
TABLE 39 Global Hospitals Pharmacies Segment Value (US$ Mn), By Region 2012-2017
TABLE 40 Global Hospitals Pharmacies Segment Value (US$ Mn), By Region 2018-2026
TABLE 41 Global Hospitals Pharmacies Segment Market Share, By Region 2012-2017
TABLE 42 Global Hospitals Pharmacies Segment Market Share, By Region 2018-2026
TABLE 43 Global Hospitals Pharmacies Segment Y-o-Y, By Region 2017-2026
TABLE 44 Global Retail Pharmacies Segment Value (US$ Mn), By Region 2012-2017
TABLE 45 Global Retail Pharmacies Segment Value (US$ Mn), By Region 2018-2026
TABLE 46 Global Retail Pharmacies Segment Market Share, By Region 2012-2017
TABLE 47 Global Retail Pharmacies Segment Market Share, By Region 2018-2026
TABLE 48 Global Retail Pharmacies Segment Y-o-Y, By Region 2017-2026
TABLE 49 Global E-commerce Segment Value (US$ Mn), By Region 2012-2017
TABLE 50 Global E-commerce Segment Value (US$ Mn), By Region 2018-2026
TABLE 51 Global E-commerce Segment Market Share, By Region 2012-2017
TABLE 52 Global E-commerce Segment Market Share, By Region 2018-2026
TABLE 53 Global E-commerce Segment Y-o-Y, By Region 2017-2026
TABLE 54 North America Anti-Obesity Prescription Drugs Market Value (US$ Mn), By Country 2012-2017
TABLE 55 North America Anti-Obesity Prescription Drugs Market Value (US$ Mn), By Country 2018-2026
TABLE 56 North America Anti-Obesity Prescription Drugs Market Value (US$ Mn), By Drug Class 2012-2017
TABLE 57 North America Anti-Obesity Prescription Drugs Market Value (US$ Mn), By Drug Class 2018-2026
TABLE 58 North America Anti-Obesity Prescription Drugs Market Value (US$ Mn), By Age Group 2012-2017
TABLE 59 North America Anti-Obesity Prescription Drugs Market Value (US$ Mn), By Age Group 2018-2026
TABLE 60 North America Anti-Obesity Prescription Drugs Market Value (US$ Mn), By Distribution Channel 2012-2017
TABLE 61 North America Anti-Obesity Prescription Drugs Market Value (US$ Mn), By Distribution Channel 2018-2026
TABLE 62 Latin America Anti-Obesity Prescription Drugs Market Value (US$ Mn), By Country 2012-2017
TABLE 63 Latin America Anti-Obesity Prescription Drugs Market Value (US$ Mn), By Country 2018-2026
TABLE 64 Latin America Anti-Obesity Prescription Drugs Market Value (US$ Mn), By Drug Class 2012-2017
TABLE 65 Latin America Anti-Obesity Prescription Drugs Market Value (US$ Mn), By Drug Class 2018-2026
TABLE 66 Latin America Anti-Obesity Prescription Drugs Market Value (US$ Mn), By Age Group 2012-2017
TABLE 67 Latin America Anti-Obesity Prescription Drugs Market Value (US$ Mn), By Age Group 2018-2026
TABLE 68 Latin America Anti-Obesity Prescription Drugs Market Value (US$ Mn), By Distribution Channel 2012-2017
TABLE 69 Latin America Anti-Obesity Prescription Drugs Market Value (US$ Mn), By Distribution Channel 2018-2026
TABLE 70 Europe Anti-Obesity Prescription Drugs Market Value (US$ Mn), By Country 2012-2017
TABLE 71 Europe Anti-Obesity Prescription Drugs Market Value (US$ Mn), By Country 2018-2026
TABLE 72 Europe Anti-Obesity Prescription Drugs Market Value (US$ Mn), By Drug Class 2012-2017
TABLE 73 Europe Anti-Obesity Prescription Drugs Market Value (US$ Mn), By Drug Class 2018-2026
TABLE 74 Europe Anti-Obesity Prescription Drugs Market Value (US$ Mn), By Age Group 2012-2017
TABLE 75 Europe Anti-Obesity Prescription Drugs Market Value (US$ Mn), By Age Group 2018-2026
TABLE 76 Europe Anti-Obesity Prescription Drugs Market Value (US$ Mn), By Distribution Channel 2012-2017
TABLE 77 Europe Anti-Obesity Prescription Drugs Market Value (US$ Mn), By Distribution Channel 2018-2026
TABLE 78 Japan Anti-Obesity Prescription Drugs Market Value (US$ Mn), By Country 2012-2017
TABLE 79 Japan Anti-Obesity Prescription Drugs Market Value (US$ Mn), By Country 2018-2026
TABLE 80 Japan Anti-Obesity Prescription Drugs Market Value (US$ Mn), By Drug Class 2012-2017
TABLE 81 Japan Anti-Obesity Prescription Drugs Market Value (US$ Mn), By Drug Class 2018-2026
TABLE 82 Japan Anti-Obesity Prescription Drugs Market Value (US$ Mn), By Age Group 2012-2017
TABLE 83 Japan Anti-Obesity Prescription Drugs Market Value (US$ Mn), By Age Group 2018-2026
TABLE 84 Japan Anti-Obesity Prescription Drugs Market Value (US$ Mn), By Distribution Channel 2012-2017
TABLE 85 Japan Anti-Obesity Prescription Drugs Market Value (US$ Mn), By Distribution Channel 2018-2026
TABLE 86 APEJ Anti-Obesity Prescription Drugs Market Value (US$ Mn), By Country 2012-2017
TABLE 87 APEJ Anti-Obesity Prescription Drugs Market Value (US$ Mn), By Country 2018-2026
TABLE 88 APEJ Anti-Obesity Prescription Drugs Market Value (US$ Mn), By Drug Class 2012-2017
TABLE 89 APEJ Anti-Obesity Prescription Drugs Market Value (US$ Mn), By Drug Class 2018-2026
TABLE 90 APEJ Anti-Obesity Prescription Drugs Market Value (US$ Mn), By Age Group 2012-2017
TABLE 91 APEJ Anti-Obesity Prescription Drugs Market Value (US$ Mn), By Age Group 2018-2026
TABLE 92 APEJ Anti-Obesity Prescription Drugs Market Value (US$ Mn), By Distribution Channel 2012-2017
TABLE 93 APEJ Anti-Obesity Prescription Drugs Market Value (US$ Mn), By Distribution Channel 2018-2026
TABLE 94 MEA Anti-Obesity Prescription Drugs Market Value (US$ Mn), By Country 2012-2017
TABLE 95 MEA Anti-Obesity Prescription Drugs Market Value (US$ Mn), By Country 2018-2026
TABLE 96 MEA Anti-Obesity Prescription Drugs Market Value (US$ Mn), By Drug Class 2012-2017
TABLE 97 MEA Anti-Obesity Prescription Drugs Market Value (US$ Mn), By Drug Class 2018-2026
TABLE 98 MEA Anti-Obesity Prescription Drugs Market Value (US$ Mn), By Age Group 2012-2017
TABLE 99 MEA Anti-Obesity Prescription Drugs Market Value (US$ Mn), By Age Group 2018-2026
TABLE 100 MEA Anti-Obesity Prescription Drugs Market Value (US$ Mn), By Distribution Channel 2012-2017
TABLE 101 MEA Anti-Obesity Prescription Drugs Market Value (US$ Mn), By Distribution Channel 2018-2026
List of Figures
FIG. 1 Global Anti-Obesity Prescription Drugs Market Value (US$ Mn), 2012-2017
FIG. 2 Global Anti-Obesity Prescription Drugs Market Value (US$ Mn) Forecast, 2018-2026
FIG. 3 Global Anti-Obesity Prescription Drugs Market Value (US$ Mn) and Y-o-Y, 2017-2026
FIG. 4 Global Bupropion and Naltrexone Segment Market Value (US$ Mn) By Region, 2012-2017
FIG. 5 Global Bupropion and Naltrexone Segment Market Value (US$ Mn) By Region, 2018-2026
FIG. 6 Global Bupropion and Naltrexone Segment Y-o-Y Growth Rate, By Region, 2017-2026
FIG. 7 Global Orlistat Segment Market Value (US$ Mn) By Region, 2012-2017
FIG. 8 Global Orlistat Segment Market Value (US$ Mn) By Region, 2018-2026
FIG. 9 Global Orlistat Segment Y-o-Y Growth Rate, By Region, 2017-2026
FIG. 10 Global Lorcaserin Segment Market Value (US$ Mn) By Region, 2012-2017
FIG. 11 Global Lorcaserin Segment Market Value (US$ Mn) By Region, 2018-2026
FIG. 12 Global Lorcaserin Segment Y-o-Y Growth Rate, By Region, 2017-2026
FIG. 13 Global Phentermine and Topiramate Segment Market Value (US$ Mn) By Region, 2012-2017
FIG. 14 Global Phentermine and Topiramate Segment Market Value (US$ Mn) By Region, 2018-2026
FIG. 15 Global Phentermine and Topiramate Segment Y-o-Y Growth Rate, By Region, 2017-2026
FIG. 16 Global Liraglutide Segment Market Value (US$ Mn) By Region, 2012-2017
FIG. 17 Global Liraglutide Segment Market Value (US$ Mn) By Region, 2018-2026
FIG. 18 Global Liraglutide Segment Y-o-Y Growth Rate, By Region, 2017-2026
FIG. 19 Global Pediatric Segment Market Value (US$ Mn) By Region, 2012-2017
FIG. 20 Global Pediatric Segment Market Value (US$ Mn) By Region, 2018-2026
FIG. 21 Global Pediatric Segment Y-o-Y Growth Rate, By Region, 2017-2026
FIG. 22 Global Adult Segment Market Value (US$ Mn) By Region, 2012-2017
FIG. 23 Global Adult Segment Market Value (US$ Mn) By Region, 2018-2026
FIG. 24 Global Adult Segment Y-o-Y Growth Rate, By Region, 2017-2026
FIG. 25 Global Hospitals Pharmacies Segment Market Value (US$ Mn) By Region, 2012-2017
FIG. 26 Global Hospitals Pharmacies Segment Market Value (US$ Mn) By Region, 2018-2026
FIG. 27 Global Hospitals Pharmacies Segment Y-o-Y Growth Rate, By Region, 2017-2026
FIG. 28 Global Retail Pharmacies Segment Market Value (US$ Mn) By Region, 2012-2017
FIG. 29 Global Retail Pharmacies Segment Market Value (US$ Mn) By Region, 2018-2026
FIG. 30 Global Retail Pharmacies Segment Y-o-Y Growth Rate, By Region, 2017-2026
FIG. 31 Global E-commerce Segment Market Value (US$ Mn) By Region, 2012-2017
FIG. 32 Global E-commerce Segment Market Value (US$ Mn) By Region, 2018-2026
FIG. 33 Global E-commerce Segment Y-o-Y Growth Rate, By Region, 2017-2026
FIG. 34 North America Anti-Obesity Prescription Drugs Market Value (US$ Mn), By Country 2012-2017
FIG. 35 North America Anti-Obesity Prescription Drugs Market Value (US$ Mn), By Country 2018-2026
FIG. 36 North America Anti-Obesity Prescription Drugs Market Value (US$ Mn), By Drug Class 2012-2017
FIG. 37 North America Anti-Obesity Prescription Drugs Market Value (US$ Mn), By Drug Class 2018-2026
FIG. 38 North America Anti-Obesity Prescription Drugs Market Value (US$ Mn), By Age Group 2012-2017
FIG. 39 North America Anti-Obesity Prescription Drugs Market Value (US$ Mn), By Age Group 2018-2026
FIG. 40 North America Anti-Obesity Prescription Drugs Market Value (US$ Mn), By Distribution Channel 2012-2017
FIG. 41 North America Anti-Obesity Prescription Drugs Market Value (US$ Mn), By Distribution Channel 2018-2026
FIG. 42 Latin America Anti-Obesity Prescription Drugs Market Value (US$ Mn), By Country 2012-2017
FIG. 43 Latin America Anti-Obesity Prescription Drugs Market Value (US$ Mn), By Country 2018-2026
FIG. 44 Latin America Anti-Obesity Prescription Drugs Market Value (US$ Mn), By Drug Class 2012-2017
FIG. 45 Latin America Anti-Obesity Prescription Drugs Market Value (US$ Mn), By Drug Class 2018-2026
FIG. 46 Latin America Anti-Obesity Prescription Drugs Market Value (US$ Mn), By Age Group 2012-2017
FIG. 47 Latin America Anti-Obesity Prescription Drugs Market Value (US$ Mn), By Age Group 2018-2026
FIG. 48 Latin America Anti-Obesity Prescription Drugs Market Value (US$ Mn), By Distribution Channel 2012-2017
FIG. 49 Latin America Anti-Obesity Prescription Drugs Market Value (US$ Mn), By Distribution Channel 2018-2026
FIG. 50 Europe Anti-Obesity Prescription Drugs Market Value (US$ Mn), By Country 2012-2017
FIG. 51 Europe Anti-Obesity Prescription Drugs Market Value (US$ Mn), By Country 2018-2026
FIG. 52 Europe Anti-Obesity Prescription Drugs Market Value (US$ Mn), By Drug Class 2012-2017
FIG. 53 Europe Anti-Obesity Prescription Drugs Market Value (US$ Mn), By Drug Class 2018-2026
FIG. 54 Europe Anti-Obesity Prescription Drugs Market Value (US$ Mn), By Age Group 2012-2017
FIG. 55 Europe Anti-Obesity Prescription Drugs Market Value (US$ Mn), By Age Group 2018-2026
FIG. 56 Europe Anti-Obesity Prescription Drugs Market Value (US$ Mn), By Distribution Channel 2012-2017
FIG. 57 Europe Anti-Obesity Prescription Drugs Market Value (US$ Mn), By Distribution Channel 2018-2026
FIG. 58 Japan Anti-Obesity Prescription Drugs Market Value (US$ Mn), By Country 2012-2017
FIG. 59 Japan Anti-Obesity Prescription Drugs Market Value (US$ Mn), By Country 2018-2026
FIG. 60 Japan Anti-Obesity Prescription Drugs Market Value (US$ Mn), By Drug Class 2012-2017
FIG. 61 Japan Anti-Obesity Prescription Drugs Market Value (US$ Mn), By Drug Class 2018-2026
FIG. 62 Japan Anti-Obesity Prescription Drugs Market Value (US$ Mn), By Distribution Channel 2012-2017
FIG. 63 Japan Anti-Obesity Prescription Drugs Market Value (US$ Mn), By Age Group 2018-2026
FIG. 64 Japan Anti-Obesity Prescription Drugs Market Value (US$ Mn), By Distribution Channel 2012-2017
FIG. 65 Japan Anti-Obesity Prescription Drugs Market Value (US$ Mn), By Distribution Channel 2018-2026
FIG. 66 APEJ Anti-Obesity Prescription Drugs Market Value (US$ Mn), By Country 2012-2017
FIG. 67 APEJ Anti-Obesity Prescription Drugs Market Value (US$ Mn), By Country 2018-2026
FIG. 68 APEJ Anti-Obesity Prescription Drugs Market Value (US$ Mn), By Drug Class 2012-2017
FIG. 69 APEJ Anti-Obesity Prescription Drugs Market Value (US$ Mn), By Drug Class 2018-2026
FIG. 70 APEJ Anti-Obesity Prescription Drugs Market Value (US$ Mn), By Age Group 2012-2017
FIG. 71 APEJ Anti-Obesity Prescription Drugs Market Value (US$ Mn), By Age Group 2018-2026
FIG. 72 APEJ Anti-Obesity Prescription Drugs Market Value (US$ Mn), By Distribution Channel 2012-2017
FIG. 73 APEJ Anti-Obesity Prescription Drugs Market Value (US$ Mn), By Distribution Channel 2018-2026
FIG. 74 MEA Anti-Obesity Prescription Drugs Market Value (US$ Mn), By Country 2012-2017
FIG. 75 MEA Anti-Obesity Prescription Drugs Market Value (US$ Mn), By Country 2018-2026
FIG. 76 MEA Anti-Obesity Prescription Drugs Market Value (US$ Mn), By Drug Class 2012-2017
FIG. 77 MEA Anti-Obesity Prescription Drugs Market Value (US$ Mn), By Drug Class 2018-2026
FIG. 78 MEA Anti-Obesity Prescription Drugs Market Value (US$ Mn), By Age Group 2012-2017
FIG. 79 MEA Anti-Obesity Prescription Drugs Market Value (US$ Mn), By Age Group 2018-2026
FIG. 80 MEA Anti-Obesity Prescription Drugs Market Value (US$ Mn), By Distribution Channel 2012-2017
FIG. 81 MEA Anti-Obesity Prescription Drugs Market Value (US$ Mn), By Distribution Channel 2018-2026
Copyright © Transparency Market Research, Inc. All Rights reserved
Trust Online

Anti-Obesity Prescription Drugs Market