
Reports
Reports
Sedentary and Stressed Lifestyle Necessitates Demand for Antacids
According to the data revealed by the Population Reference Bureau (PRB), the genarian population across the world is expected to reach 16% from 9% in 2018. As these people are more susceptible to weak digestion and stomach related issues due to low immunity, they are the important consumers of antacids. With the advancement in medical technology, there has been a rise in life expectancy in people, which leads to an increased number of the elderly population. Based on WHO statistics, the global life expectancy in 2016 was 72 years average, with 74.2 years in women and 69.8 years in men. Owing to improvement in sanitation, vaccination, and so on, the number of mid and early-life mortality is foreseen to decrease to a large extent. This fortifies the usage of antacids by the elderly population, stimulating the demand in global antacids market.
Besides this, the consumption of antacids has also increased due to a number of people relying on ready-to-eat foods due to a busy lifestyle. In addition, consumption of junk food which has certain preservatives responsible for disturbing the digestion, and chemicals triggering heartburn is another factor that encouraged Transparency market Research to come up with a report on antacids market. Lack of physical activities leading to obesity and chronic gastrointestinal disorders are additionally fortifying the motive behind presenting this report for the clients and investors for detailed analysis. The report highlights all the leading factors and trends in antacids market, along with certain drawbacks which should be considered before investment. It also unveils the important market figures depicting the current and upcoming market scenario.
.
Researchers Working on Developing More Instantly Effective and Long Lasting Antacids
Around two decades ago, proton pump inhibitors (PPIs) were among the most preferred drugs to treat patients suffering from chronic acidity. But, these agents still lacked the efficiency to treat acidity completely, as they did not possess accuracy in several aspects. Earlier, the PPIs, named (lansoprazole, omeprazole, and pantoprazole worked well for showing immediate relief from stomach-related issues. However, they were inefficient in treating acid-related issues for a long time. The advanced proton pump inhibitors drugs, esomeprazole, and rabeprazole, are more reliable and effective. These are known to have a greater and long-lasting effect during evening after 5 days of administration.. These new antacid drugs with PPI agents have several advantages in managing gastro-esophageal reflux disease (GERD). In addition, growing awareness about these disorders is adding to the demand in antacids market.
Proton pump inhibitors accounted for a whopping 66.4% revenue in 2016, leading the global antacids market. The consistent growth in revenue is expected to sustain its dominance in the coming years as well, owing to several developments coming its way. Looking at this, the global antacids market is prognosticated to expand at a CAGR of 4.1% during the forecast period from 2017 to 2025. In market was valued around worth of US$9,050 mn in 2016, which is likely to reach around US$12,857.3 mn. Looking at the figures, the players willing to invest as well as the existing ones are likely to have a huge scope of growth in the coming years. With an amount ~US$3,806.7 mn the global antacids market is expected to provide a significant incremental value for the key players in the market.
Reliability on Digestive Remedies Due to Low Physical Activity to Uplift Market Growth
Some of the leading factors responsible for the rising consumption of antacids are leisure habits, sedentary lifestyle, poor diets, obesity, and increasing stress in daily life. These aspects are known to have a detrimental effect on the digestive system and its functioning. Because of this, the consumers are relying on several digestive remedies, such as antacids. Additionally, there has been a major shift ] from prescribed drug to OTC drugs, in the pharmaceutical sector. Thus, the antacid drugs can be purchased over-the-counter, and are available at affordable price in various flavors. Some of the OTC drugs are Gelusil, Alka-Seltzer, and Pepto-Bismol. According to a study, the global antacids market grows by US$10 bn every years. The rising prevalence of GERD, heartburn, and acidity since a while, there is a growth in North America from 18% to 28%, among which 25% are adults complaining for acidity and heartburns regularly.
Consumption of Aluminum-Based Antacids to Have No Indications of Dementia
Lately, the intake of aluminum-based antacid was consumed without the fear of suffering from dementia. The amount of aluminum in antacids is extremely small, and a body has its own ways of excreting that negligible amount, without harming the function of any organ, and making it toxic.
A few years ago, concerns were raised against consumption of PPIs for a long duration. However, recently, a study fortified that the intake of proton pump inhibitors is not associated with mortality rate, as stated in other studies earlier. With PPIs claimed to be safe for consumption, the global antacids market finds another factor in its current situation.
According to a recent study published by Nature Communications journal, intake of drugs prescribed for treating heartburn could result in allergies in some people. Researchers studied the people prescribed with drugs such as H2 blockers and PPIs, who were also recommended to have an anti-allergy medicine. The study said that allergy might pop-up after few years after consumption of gastric acid inhibitors. Eight million people were kept under observation for this research.
Home Remedies for Acidity Related Issues to Have Reverse Impact on Market Growth
However, on the flipside, home remedies for occasional heartburns and acidity, and change in eating habits and lifestyle are some of the other alternatives posing a threat to global antacids market. Moreover, awareness about herbal medicines and traditional methods are also among the restrictive factors in the market growth.
Astudy published by Gut journal stated that young children who were prescribed drugs to reduce stomach acid, showed symptoms of obesity. Prolonged consumption of acid-related medicines tend to alter gut microbes resulting in weight gain.
Another study has showed the link between prescribing antacids to infants and bone fractures. Acid suppressants given to babies below the age of 1 year, resulted in 23% chances of fracture when consumed PPIs, and a huge 31% chances when PPIs and H2 blockers, both were prescribed. Having said that, there are other factors influencing the cause of fracture such as child being overweight, gender, and pre-mature birth, to state the least.
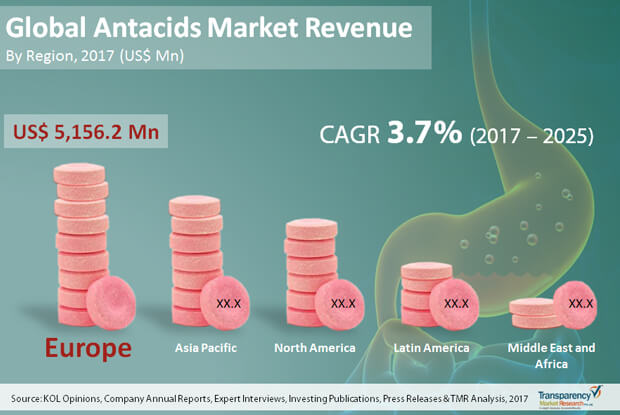
Growth in Online Pharmacy in Europe to Make it a Leading Region
The global antacids market was led by Europe by 36.9% share in 2016. The regional market is anticipated to witness a steep growth graph in coming years as well with a CAGR of 3.2% within the forecast period from 2017 to 2025, with an expected valuation of ~ US$6647.4 mn. This dominance is attributed to increasing cases of gastrointestinal diseases in the region, along with advanced facilities for therapeutics and diagnosis. As a result the region holds a huge demand and availability of antacids as over-the-counter drugs in several brand stores. Growth in online pharmacy and rise in e-commerce sector is another fueling factor behind the growth in Europe antacids market, resultantly fulfilling global demand.
In addition, the region is a home for many leading companies in global antacids market such as Bayer AG, AstraZenca, Boehringer Ingelheim GmbH, GlaxoSmithKline plc., and Sanofi. According to the analyst at TMR, these companies are majorly focusing on strategies like mergers and acquisitions and product development. In March 2015, AstraZeneca got into agreement with a company in the US, Daiichi Sankyo, Inc. for Movantik, which is an oral, once-a-day, peripherally-acting mu-opioid receptorantagonist (PAMORA) used for treating opioid-induced constipation (OIC). This has resulted in improved revenue for both the companies.
Similarly, GlaxoSmithKline in February 2015, took over GlycoVaxyn AG, headquartered at Switzerland, which is a specialist vaccine biopharmaceutical firm, to take ahead itsinitial stage vaccines pipeline. The company also invested US$294.39 million in 2016, for R&D in Consumer Healthcare, for innovations, like Excedrin Gel-tabs, Eno in new ajwain flavor in India, Sensodyne True White, and so on. These launches have helped the company to increase their reach among the masses, along with new flavors which would attract the customers to buy their product.
Relaxed Regulations for OTC to Help Market Penetration Easy for Players
The global antacids market seems to be fragmented due to presence of several players across the globe. Increasing number of companies involved in manufacturing of pharmaceutical products intensifies the competition in the global antacids market. However, various regional and local players are willing to invest, owing to low production cost and easy availability of raw materials for antacids.
In addition, relaxed regulations for over-the-counter drugs is another factor attracting the players to enter in the global market. Thus, there is a moderate threat for new players to set their foot and make their presence noticed.
Apart this, the players are investing heavily in the research activities looking at the lucrative scope in the market, and also to explore the untapped regions. Owing to better healthcare funding from the governments in various regions, such as North America and better healthcare policies, the global antacids market is foreseen to develop by leaps and bounds in coming years.
Nevertheless, owing to strong foothold by the leading companies in the regional and global market, it seems to be a bit difficult for the new entrants to secure their position easily.
1. Preface
1.1. Market Definition and Scope
1.2. Market Segmentation
1.3. Key Research Objectives
1.4. Research Highlights
2. Assumptions and Research Methodology
3. Executive Summary : Global Antacids Market
4. Market Overview
4.1. Introduction
4.1.1. Product Definition
4.1.2. Industry Evolution / Developments
4.2. Overview
4.3. Market Dynamics
4.3.1. Drivers
4.3.2. Restraints
4.3.3. Opportunity
4.4. Global Antacids Market Value (US$ Mn) Forecast, 2017 - 2025
4.5. Porter’s Five Force Analysis
4.6. Value Chain Analysis
4.7. Market Outlook
5. Global Antacids Market Analysis and Forecasts, By Drug Class
5.1. Introduction & Definition
5.2. Key Findings / Developments
5.3. Key Trends
5.4. Market Value (US$ Mn) Forecast, By Drug Class, 2017–2025
5.4.1. Proton pump inhibitors
5.4.2. H2 Antagonist
5.4.3. Acid neutralizers
5.5. Market Attractiveness By Drug Class
6. Global Antacids Market Analysis and Forecasts, By Formulation Type
6.1. Introduction & Definition
6.2. Key Findings / Developments
6.3. Key Trends
6.4. Market Value (US$ Mn) Forecast, By Formulation Type, 2017–2025
6.4.1. Tablet
6.4.2. Liquid
6.4.3. Powder
6.4.4. Others
6.5. Market Attractiveness By Formulation Type
7. Global Antacids Market Analysis and Forecasts, By Distribution Channel
7.1. Introduction & Definition
7.2. Key Findings / Developments
7.3. Key Trends
7.4. Market Value (US$ Mn) Forecast, By Distribution Channel, 2017–2025
7.4.1. Hospital Pharmacies
7.4.2. Retail Pharmacies
7.4.3. Others
7.5. Market Attractiveness By Distribution Channel
8. Global Antacids Market Analysis and Forecasts, By Region
8.1. Key Findings
8.2. Market Value (US$ Mn) Forecast, By Region, 2017-2025
8.2.1. North America
8.2.2. Europe
8.2.3. Asia Pacific
8.2.4. Latin America
8.2.5. Middle East and Africa
8.3. Market Attractiveness By Region
9. North America Antacids Market Analysis and Forecast
9.1. Introduction
9.1.1. Key Findings
9.1.2. Key Trends
9.2. Market Value (US$ Mn) Forecast, By Drug Class, 2017–2025
9.2.1. Proton pump inhibitors
9.2.2. H2 Antagonist
9.2.3. Acid neutralizers
9.3. Market Value (US$ Mn) Forecast, By Formulation Type, 2017–2025
9.3.1. Tablet
9.3.2. Liquid
9.3.3. Powder
9.3.4. Others
9.4. Market Value (US$ Mn) Forecast, By Distribution Channel, 2017–2025
9.4.1. Hospital Pharmacies
9.4.2. Retail Pharmacies
9.4.3. Others
9.5. Market Value (US$ Mn) Forecast, By Country, 2017–2025
9.5.1. U.S.
9.5.2. Canada
9.6. Market Attractiveness Analysis
9.6.1. By Drug Class
9.6.2. By Formulation Type
9.6.3. By Distribution Channel
9.6.4. By Country
10. Europe Antacids Market Analysis and Forecast
10.1. Introduction
10.1.1. Key Findings
10.1.2. Key Trends
10.2. Market Value (US$ Mn) Forecast, By Drug Class, 2017–2025
10.2.1. Proton pump inhibitors
10.2.2. H2 Antagonist
10.2.3. Acid neutralizers
10.3. Market Value (US$ Mn) Forecast, By Formulation Type, 2017–2025
10.3.1. Tablet
10.3.2. Liquid
10.3.3. Powder
10.3.4. Others
10.4. Market Value (US$ Mn) Forecast, By Distribution Channel, 2017–2025
10.4.1. Hospital Pharmacies
10.4.2. Retail Pharmacies
10.4.3. Others
10.5. Market Value (US$ Mn) Forecast, By Country, 2017–2025
10.5.1. U.K.
10.5.2. Germany
10.5.3. France
10.5.4. Spain
10.5.5. Italy
10.5.6. Rest of Europe
10.6. Market Attractiveness Analysis
10.6.1. By Drug Class
10.6.2. By Formulation Type
10.6.3. By Distribution Channel
10.6.4. By Country
11. Asia Pacific Antacids Market Analysis and Forecast
11.1. Introduction
11.1.1. Key Findings
11.1.2. Key Trends
11.2. Market Value (US$ Mn) Forecast, By Drug Class, 2017–2025
11.2.1. Proton pump inhibitors
11.2.2. H2 Antagonist
11.2.3. Acid neutralizers
11.3. Market Value (US$ Mn) Forecast, By Formulation Type, 2017–2025
11.3.1. Tablet
11.3.2. Liquid
11.3.3. Powder
11.3.4. Others
11.4. Market Value (US$ Mn) Forecast, By Distribution Channel, 2017–2025
11.4.1. Hospital Pharmacies
11.4.2. Retail Pharmacies
11.4.3. Others
11.5. Market Value (US$ Mn) Forecast, By Country, 2017–2025
11.5.1. India
11.5.2. China
11.5.3. Japan
11.5.4. Australia & New Zealand
11.5.5. Rest of Asia Pacific
11.6. Market Attractiveness Analysis
11.6.1. By Drug Class
11.6.2. By Formulation Type
11.6.3. By Distribution Channel
11.6.4. By Country
12. Latin America Antacids Market Analysis and Forecast
12.1. Introduction
12.1.1. Key Findings
12.1.2. Key Trends
12.2. Market Value (US$ Mn) Forecast, By Drug Class, 2017–2025
12.2.1. Proton pump inhibitors
12.2.2. H2 Antagonist
12.2.3. Acid neutralizers
12.3. Market Value (US$ Mn) Forecast, By Formulation Type, 2017–2025
12.3.1. Tablet
12.3.2. Liquid
12.3.3. Powder
12.3.4. Others
12.4. Market Value (US$ Mn) Forecast, By Distribution Channel, 2017–2025
12.4.1. Hospital Pharmacies
12.4.2. Retail Pharmacies
12.4.3. Others
12.5. Market Value (US$ Mn) Forecast, By Country, 2017–2025
12.5.1. Brazil
12.5.2. Mexico
12.5.3. Rest of Latin America
12.6. Market Attractiveness Analysis
12.6.1. By Drug Class
12.6.2. By Formulation Type
12.6.3. By Distribution Channel
12.6.4. By Country
13. Middle East and Africa Antacids Market Analysis and Forecast
13.1. Introduction
13.1.1. Key Findings
13.1.2. Key Trends
13.2. Market Value (US$ Mn) Forecast, By Drug Class, 2017–2025
13.2.1. Proton pump inhibitors
13.2.2. H2 Antagonist
13.2.3. Acid neutralizers
13.3. Market Value (US$ Mn) Forecast, By Formulation Type, 2017–2025
13.3.1. Tablet
13.3.2. Liquid
13.3.3. Powder
13.3.4. Others
13.4. Market Value (US$ Mn) Forecast, By Distribution Channel, 2017–2025
13.4.1. Hospital Pharmacies
13.4.2. Retail Pharmacies
13.4.3. Others
13.5. Market Value (US$ Mn) Forecast, By Country, 2017–2025
13.5.1. South Africa
13.5.2. Saudi Arabia
13.5.3. Rest of MEA
13.6. Market Attractiveness Analysis
13.6.1. By Drug Class
13.6.2. By Formulation Type
13.6.3. By Distribution Channel
13.6.4. By Country
14. Competition Landscape
14.1. Market Players
14.2. Company Profiles (Details – Overview, Financials, Recent Developments, Strategy)
14.2.1. AstraZeneca
14.2.1.1. Company Overview (HQ, Business Segments, Employee Strength)
14.2.1.2. Business Overview
14.2.1.3. Product Portfolio
14.2.1.4. Financial Overview
14.2.1.5. SWOT Analysis
14.2.1.6. Strategic overview
14.2.2. Bayer AG
14.2.2.1. Company Overview (HQ, Business Segments, Employee Strength)
14.2.2.2. Business Overview
14.2.2.3. Product Portfolio
14.2.2.4. Financial Overview
14.2.2.5. SWOT Analysis
14.2.2.6. Strategic overview
14.2.3. Boehringer Ingelheim GmbH
14.2.3.1. Company Overview (HQ, Business Segments, Employee Strength)
14.2.3.2. Business Overview
14.2.3.3. Product Portfolio
14.2.3.4. Financial Overview
14.2.3.5. SWOT Analysis
14.2.3.6. Strategic overview
14.2.4. Dr. Reddy’s Laboratories Ltd.
14.2.4.1. Company Overview (HQ, Business Segments, Employee Strength)
14.2.4.2. Business Overview
14.2.4.3. Product Portfolio
14.2.4.4. Financial Overview
14.2.4.5. SWOT Analysis
14.2.4.6. Strategic overview
14.2.5. GlaxoSmithKline plc
14.2.5.1. Company Overview (HQ, Business Segments, Employee Strength)
14.2.5.2. Business Overview
14.2.5.3. Product Portfolio
14.2.5.4. Financial Overview
14.2.5.5. SWOT Analysis
14.2.5.6. Strategic overview
14.2.6. Johnson & Johnson
14.2.6.1. Company Overview (HQ, Business Segments, Employee Strength)
14.2.6.2. Business Overview
14.2.6.3. Product Portfolio
14.2.6.4. Financial Overview
14.2.6.5. SWOT Analysis
14.2.6.6. Strategic overview
14.2.7. Pfizer Inc.
14.2.7.1. Company Overview (HQ, Business Segments, Employee Strength)
14.2.7.2. Business Overview
14.2.7.3. Product Portfolio
14.2.7.4. Financial Overview
14.2.7.5. SWOT Analysis
14.2.7.6. Strategic overview
14.2.8. Procter & Gamble
14.2.8.1. Company Overview (HQ, Business Segments, Employee Strength)
14.2.8.2. Business Overview
14.2.8.3. Product Portfolio
14.2.8.4. Financial Overview
14.2.8.5. SWOT Analysis
14.2.8.6. Strategic overview
14.2.9. Reckitt Benckiser Group plc
14.2.9.1. Company Overview (HQ, Business Segments, Employee Strength)
14.2.9.2. Business Overview
14.2.9.3. Product Portfolio
14.2.9.4. Financial Overview
14.2.9.5. SWOT Analysis
14.2.9.6. Strategic overview
14.2.10. Sanofi
14.2.10.1. Company Overview (HQ, Business Segments, Employee Strength)
14.2.10.2. Business Overview
14.2.10.3. Product Portfolio
14.2.10.4. Financial Overview
14.2.10.5. SWOT Analysis
14.2.10.6. Strategic overview
14.2.11. Sun Pharmaceuticals Ltd
14.2.11.1. Company Overview (HQ, Business Segments, Employee Strength)
14.2.11.2. Business Overview
14.2.11.3. Product Portfolio
14.2.11.4. Financial Overview
14.2.11.5. SWOT Analysis
14.2.11.6. Strategic overview
14.2.12. Takeda Pharmaceutical
14.2.12.1. Company Overview (HQ, Business Segments, Employee Strength)
14.2.12.2. Business Overview
14.2.12.3. Product Portfolio
14.2.12.4. Financial Overview
14.2.12.5. SWOT Analysis
14.2.12.6. Strategic overview
14.2.13. Valeant Pharmaceuticals International, Inc.
14.2.13.1. Company Overview (HQ, Business Segments, Employee Strength)
14.2.13.2. Business Overview
14.2.13.3. Product Portfolio
14.2.13.4. Financial Overview
14.2.13.5. SWOT Analysis
14.2.13.6. Strategic overview
List of Tables
Table 01: Global Antacids Market Size (US$ Mn) Forecast, By Drug Class, 2015–2025
Table 02: Global Antacids Market Size (US$ Mn) Forecast, By Formulation Type, 2017–2025
Table 03: Global Antacids Market Size (US$ Mn) Forecast, By Distribution Channel, 2015–2025
Table 04: Global Antacids Market (US$ Mn) Forecast, By Region, 2015–2025
Table 05: North America Antacids Market Size (US$ Mn) Forecast, by Drug Class, 2015–2025
Table 06: North America Antacids Market Size (US$ Mn) Forecast, by Formulation Type, 2015–2025
Table 07: North America Antacids Market Size (US$ Mn) Forecast, By Distribution Channel, 2015–2025
Table 08: North America Antacids Market Size (US$ Mn) Forecast, by Country, 2015–2025
Table 09: Europe Antacids Market Size (US$ Mn) Forecast, by Drug Class, 2015–2025
Table 10: Europe Antacids Market Size (US$ Mn) Forecast, by Formulation Type, 2015–2025
Table 11: Europe Antacids Market Size (US$ Mn) Forecast, By Distribution Channel, 2015 and 2025
Table 12: Europe Antacids Market Size (US$ Mn) Forecast, by Country, 2015–2025
Table 13: Asia Pacific Antacids Market Size (US$ Mn) Forecast, by Drug Class, 2015–2025
Table 14: Asia Pacific Antacids Market Size (US$ Mn) Forecast, by Formulation Type, 2015–2025
Table 15: Asia Pacific Antacids Market Size (US$ Mn) Forecast, By Distribution Channel, 2015 and 2025
Table 16: Asia Pacific Antacids Market Size (US$ Mn) Forecast, by Country, 2015–2025
Table 17: Latin America Antacids Market Size (US$ Mn) Forecast, by Drug Class, 2015–2025
Table 18: Latin America Antacids Market Size (US$ Mn) Forecast, by Formulation Type, 2015–2025
Table 19: Latin America Antacids Market Size (US$ Mn) Forecast, By Distribution Channel, 2015–2025
Table 20: Latin America Antacids Market Size (US$ Mn) Forecast, by Country, 2015–2025
Table 21: Middle East and Africa Antacids Market Size (US$ Mn) Forecast, by Drug Class, 2015–2025
Table 22: Middle East and Africa Antacids Market Size (US$ Mn) Forecast, by Formulation Type, 2015–2025
Table 23: Middle East and Africa Antacids Market Size (US$ Mn) Forecast, By Distribution Channel, 2015 and 2025
Table 24: Middle East and Africa Antacids Market Size (US$ Mn) Forecast, by Country, 2015–2025
List of Figures
Figure 01: Global Antacids Market Size (US$ Mn) Forecast, 2015–2025
Figure 02: Market Value Share, By Drug Class (2016)
Figure 03: Market Value Share, By Formulation Type (2016)
Figure 04: Market Value Share By, Distribution Channel (2016)
Figure 05: Market Value Share, By Region (2016)
Figure 06: Porter’s Five Force Analysis
Figure 07: Global Antacids Market Value Share Analysis, By Drug Class, 2016 and 2025
Figure 08: Global Proton Pump Inhibitor Market Revenue (US$ Mn) and Y-o-Y Growth (%), 2015–2025
Figure 09: Global H2 Antagonist Market Revenue (US$ Mn) and Y-o-Y Growth (%), 2015–2025
Figure 10: Global Acid Neutralizer Market Revenue (US$ Mn) and Y-o-Y Growth (%), 2015–2025
Figure 11: Antacids Market Attractiveness Analysis, By Drug Class
Figure 12: Global Antacids Market Value Share Analysis, By Formulation Type, 2016 and 2025
Figure 13: Global Antacids Tablet Market Revenue (US$ Mn) and Y-o-Y Growth (%), 2015–2025
Figure 14: Global Antacids Liquids Market Revenue (US$ Mn) and Y-o-Y Growth (%), 2015–2025
Figure 15: Global Antacids Powder Market Revenue (US$ Mn) and Y-o-Y Growth (%), 2015–2025
Figure 16: Global Others Market Revenue (US$ Mn) and Y-o-Y Growth (%), 2015–2025
Figure 17: Global Antacids Market Attractiveness Analysis, By Formulation Type
Figure 18: Global Antacids Market Value Share Analysis, By Distribution Channel, 2016 and 2025
Figure 19: Global Hospital Pharmacies Market Revenue (US$ Mn) and Y-o-Y Growth (%), 2015–2025
Figure 20: Global Retail Pharmacies Market Revenue (US$ Mn) and Y-o-Y Growth (%), 2015–2025
Figure 21: Global Others Market Revenue (US$ Mn) and Y-o-Y Growth (%), 2015–2025
Figure 22: Global Antacids Market Attractiveness Analysis, By Distribution Channel
Figure 23: Global Antacids Market Value Share, By Region, 2017 and 2025
Figure 24: Global Antacids Market Attractiveness Analysis, By Region Type
Figure 25: North America Antacids Market Size (US$ Mn) Forecast and Y-o-Y Growth (%), 2015–2025
Figure 26: North America Antacids Market Attractiveness Analysis, By Country
Figure 27: North America Antacids Market Value Share Analysis, By Drug Class, 2016 and 2025
Figure 28: North America Antacids Market Value Share Analysis, By Formulation Type, 2016 and 2025
Figure 29: North America Antacids Market Value Share Analysis, By Distribution Channel, 2016 and 2025
Figure 30: North America Market Value Share Analysis, By Country, 2016 and 2025
Figure 31: North America Antacids Market Attractiveness Analysis, By Drug Class
Figure 32: North America Antacids Market Attractiveness Analysis, By Formulation Type
Figure 33: North America Antacids Market Attractiveness Analysis, By Distribution Channel
Figure 34: Europe Antacids Market Size (US$ Mn) Forecast and Y-o-Y Growth (%), 2015–2025
Figure 35: Europe Antacids Market Attractiveness Analysis, By Country
Figure 36: Europe Market Value Share Analysis, By Drug Class, 2016 and 2025
Figure 37: Europe Market Value Share Analysis, By Formulation Type, 2016 and 2025
Figure 38: Europe Antacids Market Value Share Analysis, By Distribution Channel, 2016 and 2025
Figure 39: Europe Market Value Share Analysis, By Country, 2016 and 2025
Figure 40: Europe Antacids Market Attractiveness Analysis, By Drug Class
Figure 41: Europe Antacids Market Attractiveness Analysis, By Formulation Type
Figure 42: Europe Antacids Market Attractiveness Analysis, By Distribution Channel
Figure 43: Asia Pacific Antacids Market Size (US$ Mn) Forecast and Y-o-Y Growth (%), 2015–2025
Figure 44: Asia Pacific Antacids Market Attractiveness Analysis, By Country
Figure 45: Asia Pacific Market Value Share Analysis, By Drug Class, 2016 and 2025
Figure 46: Asia Pacific Market Value Share Analysis, By Formulation Type, 2016 and 2025
Figure 47: Asia Pacific Antacids Market Value Share Analysis, By Distribution Channel, 2016 and 2025
Figure 48: Asia Pacific Market Value Share Analysis, By Country, 2016 and 2024
Figure 49: Asia Pacific Antacids Market Attractiveness Analysis, By Drug Class
Figure 50: Asia Pacific Antacids Market Attractiveness Analysis, By Formulation Type
Figure 51: Asia Pacific Antacids Market Attractiveness Analysis, By Distribution Channel
Figure 52: Latin America Antacids Market Size (US$ Mn) Forecast and Y-o-Y Growth (%), 2015–2025
Figure 53: Latin America Antacids Market Attractiveness Analysis, By Country
Figure 54: Latin America Antacids Market Value Share Analysis, By Drug Class, 2016 and 2025
Figure 55: Latin America Antacids Market Value Share Analysis, By Formulation Type, 2016 and 2025
Figure 56: Latin America Antacids Market Value Share Analysis, By Distribution Channel, 2016 and 2025
Figure 57: Latin America Market Value Share Analysis, By Country, 2016 and 2024
Figure 58: Latin America Antacids Market Attractiveness Analysis, By Drug Class
Figure 59: Latin America Antacids Market Attractiveness Analysis, By Formulation Type
Figure 60: Latin America Antacids Market Attractiveness Analysis, By Distribution Channel
Figure 61: Middle East and Africa Antacids Market Size (US$ Mn) Forecast and Y-o-Y Growth (%), 2015–2025
Figure 62: Middle East and Africa Antacids Market Attractiveness Analysis, By Country
Figure 63: Middle East and Africa Market Value Share Analysis, By Drug Class, 2016 and 2025
Figure 64: Middle East and Africa Market Value Share Analysis, By Formulation Type, 2016 and 2025
Figure 65: Middle East and Africa Antacids Market Value Share Analysis, By Distribution Channel, 2016 and 2025
Figure 66: Middle East and Africa Market Value Share Analysis, By Country, 2016 and 2025
Figure 67: Middle East and Africa Antacids Market Attractiveness Analysis, By Drug Class
Figure 68: Middle East and Africa Antacids Market Attractiveness Analysis, By Formulation Type
Figure 69: Middle East and Africa Antacids Market Attractiveness Analysis, By Distribution Channel
Figure 70: AstraZeneca, Breakdown of Net Sales (%), by Region, 2016
Figure 71: AstraZeneca, Revenue (US$ Mn) and Y-o-Y Growth (%), 2013–2016
Figure 72: Bayer AG, Breakdown of Net Sales (%), by Region, 2016
Figure 73: Bayer AG, Revenue (US$ Mn) and Y-o-Y Growth (%), 2013–2016
Figure 74: Boehringer Ingelheim, Break down of Net Sales (%), by Region, 2016
Figure 75: Boehringer Ingelheim, Revenue (US$ Mn) & Y-o-Y Growth (%), 2013–2016
Figure 76: Dr. Reddy’s, Breakdown of Net Sales (%), by Region, 2016
Figure 77: Dr. Reddy’s, Revenue (US$ Mn) and Y-o-Y Growth (%), 2013–2016
Figure 78: GlaxoSmithKline, Breakdown of Net Sales (%), by Region, 2016
Figure 79: GlaxoSmithKline, Revenue (US$ Mn) and Y-o-Y Growth (%), 2013–2016
Figure 80: Johnson & Johnson, Break down of Net Sales (%), by Region, 2016
Figure 81: Johnson & Johnson, Revenue (US$ Mn) and Y-o-Y Growth (%), 2013-2016
Figure 82: Pfizer Inc., Breakdown of Net Sales (%), by Region, 2016 (%)
Figure 83: Pfizer Inc., Revenue (US$ Mn) and Y-o-Y Growth (%), 2013–2016
Figure 84: P&G, Breakdown of Net Sales (%), by Region, 2016
Figure 85: P&G, Revenue (US$ Mn) and Y-o-Y Growth (%), 2013–2016
Figure 86: Reckitt Benckiser, Breakdown of Net Sales (%), by Region, 2016
Figure 87: Reckitt Benckiser, Revenue (US$ Mn) and Y-o-Y Growth (%), 2013–2016
Figure 88: Sanofi, Breakdown of Net Sales (%), by Region, 2016
Figure 89: Sanofi, Revenue (US$ Mn) and Y-o-Y Growth (%), 2013–2016
Figure 90: Breakdown of Net Sales (%), by Region, 2016
Figure 91: Revenue (US$ Mn) and Y-o-Y Growth (%), 2014–2016
Figure 92: Takeda Pharmaceutical, Break down of Net Sales (%), by Region, 2016
Figure 93: Takeda Pharmaceutical, Revenue (US$ Bn) & Y-o-Y Growth (%), 2013–2016
Figure 94: Valeant Pharmaceuticals International, Inc., Break down of Net Sales (%), by Region, 2016
Figure 95: Valeant Pharmaceuticals International, Inc., Revenue (US$ Bn) & Y-o-Y Growth (%), 2013–2016
Copyright © Transparency Market Research, Inc. All Rights reserved
Trust Online

Antacids Market