
Reports
Reports
With the significant rise in the packaging industry across the world, the global market for aluminum barrier laminate tubes has witnessed a tremendous surge in its valuation and size. Aluminum barrier laminate tubes are majorly utilized for the packaging of various consumer goods, such as premium dental creams, antiseptics, oils, and adhesives, worldwide. These tubes are apt for food products as well. As the demand for premium consumer goods is increasing substantially, the market for aluminum barrier laminate tubes is expected to witness a noticeable growth, globally, in the years to come.
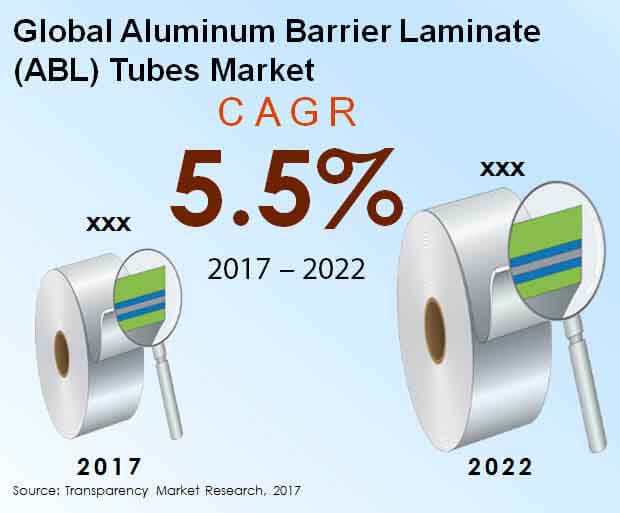
By 2017, the worldwide aluminum barrier laminate tubes market is anticipated to offer an opportunity worth US$772.3 mn. It is expected to rise further at a CAGR of 5.50% between 2017 and 2022 and attain a value of US$1.01 bn by the end of 2022. The rising awareness among consumers regarding the eco-friendliness of aluminum barrier laminate tubes when compared to ordinary plastic tubes is also expected to boost their demand in the near future, reflecting greatly on this market.
In general, the global aluminum barrier laminate tubes market is evaluated on the basis of the capacity, type of the cap, and the end users. In terms of capacity, the market is classified into less than 50 ml, 50 to 100 ml, 101 to 150 ml, and above 150 ml. Among these, the most prominent segment in this market is the 50 to 100 ml segment, which is likely to remain on the top over the next few years.
Stand-up cap, fez cap, nozzle cap, and flip top cap are the main segments of this market on the basis of the type of the cap and the cosmetics, commercial, oral care, home and other personal care, pharmaceuticals, and the food industries are the prime end user of aluminum barrier laminate tubes.
The Middle East and Africa (MEA), Asia Pacific excluding Japan (APEJ), Latin America, North America, Europe, and Japan are the prime regional markets for aluminum barrier laminate tubes across the world. Of these, Europe has surfaced as the leading contributor to the global market for aluminum barrier laminate tubes, thanks to the high disposable income of people in this region that allow them to spend on expensive premium consumer products. Expanding at a CAGR of 5.50% over the period of 2017–2022, the Europe market for aluminum barrier laminate tubes will continue to lead the global market over the next few years.
North America is also expected to register a steady growth in its market for aluminum barrier laminate tubes in the near future on the grounds of the presence of a large pool of aluminum barrier laminate tube vendors. This regional market is expected to report a CAGR of 4.70% between 2017 and 2022. Among other regional markets, Asia Pacific excluding Japan is anticipated to register a promising future, proliferating at a CAGR of 6.50% during the period from 2017 to 2022. Other regional markets are also projected to witness an increase in the demand for aluminum barrier laminate tubes in the years to come.
Ambertube International, Essel Propack Ltd., Pirlo GmbH & Co. KG, Montebello Packaging Inc., Hoffmann Neopac AG, Linhardt GmbH & Co. KG, Impact International Pty. Ltd., Huhtamaki Oyj, Tubapack S.A., and Intrapac International Corp. are some the leading players functioning in the global aluminum barrier laminate (ABL) tubes market.
Increasing Demand for Medical Services creates opportunities in Aluminum Barrier Laminate (ABL) Tubes Market
The growing demand for premium quality consumer goods is expected to emerge as the primary factor promoting the growth of the global aluminum barrier laminate tubes market. In addition to this, the rapidly accelerating packaging sector is also accelerating demand for aluminum barrier laminate tubes, thereby aiding in expansion of the market in the years to come. Aluminum barrier laminate tubes are used mainly for the bundling of different customer products like germ-killers, dental creams, oils, and glues, and others. These tubes can be used for storing food items too. As the interest for premium shopper products is expanding considerably, the market for aluminum barrier laminate tubes is likely to witness notable development, all around the world, in the years to come.
An expanding number of medical services activities including efforts, advancements, and wellbeing mindfulness programs are noticed around the world. This is attributable to rising examples of persistent illnesses including atherosclerosis, heart sicknesses, heftiness, and diabetes among others. Furthermore, rising discretionary cash flow combined with occupied schedules has prompted purchasers receiving unfortunate and lighthearted ways of life enlarging the interest for drug items including laminate tubes among others.
The significant expense of aluminum barrier laminate tubes is relied upon to restrict their compass among shoppers across the world, prompting a lull in the development pace of this market somewhat soon. In any case, the rising mindfulness among shoppers with respect to the climate amicability of aluminum barrier laminate tubes, when contrasted with standard plastic tubes, is additionally foreseen to fuel demand in the market in the following years, impelling this market immensely.
The Aluminum barrier laminate tubes market is likely to become further inferable from the interest for little measured bundling arrangements in beautifying agents and individual consideration industry. Aluminum barrier laminate tubes are practical bundling arrangements and simple to utilize which are delivered in different sizes. The market is relied upon to observe obstruction from sachets which are effectively accessible in little sizes.
Aluminum Barrier Laminate Tubes Market is expected to reach US$1.01 bn By 2022
Some of the key players in the Aluminum Barrier Laminate Tubes Market include Ambertube International, Essel Propack Ltd., Pirlo GmbH & Co. KG, Montebello Packaging Inc., Hoffmann Neopac AG, Linhardt GmbH & Co. KG, Impact International Pty. Ltd., Huhtamaki Oyj, Tubapack S.A., and Intrapac International Corp.
The growing demand for premium quality consumer goods is expected to emerge as the primary factor promoting the growth of the global aluminum barrier laminate tubes market.
The forecast period considered for the Aluminum Barrier Laminate Tubes Market is 2017 - 2022
North America is more attractive region for vendors in the Aluminum Barrier Laminate Tubes Market.
1. Global Aluminum Barrier Laminate (ABL) Tubes Market - Executive Summary
2. Global Aluminum Barrier Laminate (ABL) Tubes Market Overview
2.1. Introduction
2.1.1. Global Aluminum Barrier Laminate (ABL) Tubes Market Taxonomy
2.1.2. Global Aluminum Barrier Laminate (ABL) Tubes Market Definition
2.2. Global Aluminum Barrier Laminate (ABL) Tubes Market Size (US$ Mn) and Forecast, 2012-2022
2.2.1. Global Aluminum Barrier Laminate (ABL) Tubes Market Y-o-Y Growth
2.3. Global Aluminum Barrier Laminate (ABL) Tubes Market Dynamics
2.4. Supply Chain
2.5. Cost Structure
2.6. Pricing Analysis
2.7. Raw Material Sourcing Strategy and Analysis
2.8. List of Distributors
2.9. Key Participants Market Presence (Intensity Map) By Region
3. Global Aluminum Barrier Laminate (ABL) Tubes Market Analysis and Forecast By Capacity
3.1. Global Aluminum Barrier Laminate (ABL) Tubes Market Size and Forecast By Capacity, 2012-2022
3.1.1. Less than 50ml Capacity Type Market Size and Forecast, 2012-2022
3.1.1.1. Revenue (US$ Mn) Comparison, By Region
3.1.1.2. Market Share Comparison, By Region
3.1.1.3. Y-o-Y growth Comparison, By Region
3.1.2. 50 to 100 ml Capacity Type Market Size and Forecast, 2012-2022
3.1.2.1. Revenue (US$ Mn) Comparison, By Region
3.1.2.2. Market Share Comparison, By Region
3.1.2.3. Y-o-Y growth Comparison, By Region
3.1.3. 101 to 150 ml Capacity Type Market Size and Forecast, 2012-2022
3.1.3.1. Revenue (US$ Mn) Comparison, By Region
3.1.3.2. Market Share Comparison, By Region
3.1.3.3. Y-o-Y growth Comparison, By Region
3.1.4. Above 150 ml Capacity Type Market Size and Forecast, 2012-2022
3.1.4.1. Revenue (US$ Mn) Comparison, By Region
3.1.4.2. Market Share Comparison, By Region
3.1.4.3. Y-o-Y growth Comparison, By Region
4. Global Aluminum Barrier Laminate (ABL) Tubes Market Analysis and Forecast By End-Use
4.1. Global Aluminum Barrier Laminate (ABL) Tubes Market Size and Forecast By End-Use, 2012-2022
4.1.1. Cosmetics Market Size and Forecast, 2012-2022
4.1.1.1. Revenue (US$ Mn) Comparison, By Region
4.1.1.2. Market Share Comparison, By Region
4.1.1.3. Y-o-Y growth Comparison, By Region
4.1.2. Oral Care Market Size and Forecast, 2012-2022
4.1.2.1. Revenue (US$ Mn) Comparison, By Region
4.1.2.2. Market Share Comparison, By Region
4.1.2.3. Y-o-Y growth Comparison, By Region
4.1.3. Commercial Market Size and Forecast, 2012-2022
4.1.3.1. Revenue (US$ Mn) Comparison, By Region
4.1.3.2. Market Share Comparison, By Region
4.1.3.3. Y-o-Y growth Comparison, By Region
4.1.4. Pharmaceuticals Market Size and Forecast, 2012-2022
4.1.4.1. Revenue (US$ Mn) Comparison, By Region
4.1.4.2. Market Share Comparison, By Region
4.1.4.3. Y-o-Y growth Comparison, By Region
4.1.5. Home & Other Personal Care Market Size and Forecast, 2012-2022
4.1.5.1. Revenue (US$ Mn) Comparison, By Region
4.1.5.2. Market Share Comparison, By Region
4.1.5.3. Y-o-Y growth Comparison, By Region
4.1.6. Food Market Size and Forecast, 2012-2022
4.1.6.1. Revenue (US$ Mn) Comparison, By Region
4.1.6.2. Market Share Comparison, By Region
4.1.6.3. Y-o-Y growth Comparison, By Region
4.1.7. Others Market Size and Forecast, 2012-2022
4.1.7.1. Revenue (US$ Mn) Comparison, By Region
4.1.7.2. Market Share Comparison, By Region
4.1.7.3. Y-o-Y growth Comparison, By Region
5. Global Aluminum Barrier Laminate (ABL) Tubes Market Analysis and Forecast By Cap Type
5.1. Global Aluminum Barrier Laminate (ABL) Tubes Market Size and Forecast By Cap Type, 2012-2022
5.1.1. Stand-up Cap Market Size and Forecast, 2012-2022
5.1.1.1. Revenue (US$ Mn) Comparison, By Region
5.1.1.2. Market Share Comparison, By Region
5.1.1.3. Y-o-Y growth Comparison, By Region
5.1.2. Nozzle Cap Market Size and Forecast, 2012-2022
5.1.2.1. Revenue (US$ Mn) Comparison, By Region
5.1.2.2. Market Share Comparison, By Region
5.1.2.3. Y-o-Y growth Comparison, By Region
5.1.3. Fez Cap Market Size and Forecast, 2012-2022
5.1.3.1. Revenue (US$ Mn) Comparison, By Region
5.1.3.2. Market Share Comparison, By Region
5.1.3.3. Y-o-Y growth Comparison, By Region
5.1.4. Flip Top Cap Market Size and Forecast, 2012-2022
5.1.4.1. Revenue (US$ Mn) Comparison, By Region
5.1.4.2. Market Share Comparison, By Region
5.1.4.3. Y-o-Y growth Comparison, By Region
5.1.5. Other Caps Market Size and Forecast, 2012-2022
5.1.5.1. Revenue (US$ Mn) Comparison, By Region
5.1.5.2. Market Share Comparison, By Region
5.1.5.3. Y-o-Y growth Comparison, By Region
6. Global Aluminum Barrier Laminate (ABL) Tubes Market Analysis and Forecast By Region
6.1. Global Aluminum Barrier Laminate (ABL) Tubes Market Size and Forecast, 2012-2022
6.1.1. North America Aluminum Barrier Laminate (ABL) Tubes Market Size and Forecast, 2012-2022
6.1.1.1. Revenue (US$ Mn) Comparison, By Capacity
6.1.1.2. Revenue (US$ Mn) Comparison, By End-Use
6.1.1.3. Revenue (US$ Mn) Comparison, By Cap Type
6.1.2. Latin America Aluminum Barrier Laminate (ABL) Tubes Market Size and Forecast, 2012-2022
6.1.2.1. Revenue (US$ Mn) Comparison, By Capacity
6.1.2.2. Revenue (US$ Mn) Comparison, By End-Use
6.1.2.3. Revenue (US$ Mn) Comparison, By Cap Type
6.1.3. Europe Aluminum Barrier Laminate (ABL) Tubes Market Size and Forecast, 2012-2022
6.1.3.1. Revenue (US$ Mn) Comparison, By Capacity
6.1.3.2. Revenue (US$ Mn) Comparison, By End-Use
6.1.3.3. Revenue (US$ Mn) Comparison, By Cap Type
6.1.4. Japan Aluminum Barrier Laminate (ABL) Tubes Market Size and Forecast, 2012-2022
6.1.4.1. Revenue (US$ Mn) Comparison, By Capacity
6.1.4.2. Revenue (US$ Mn) Comparison, By End-Use
6.1.4.3. Revenue (US$ Mn) Comparison, By Cap Type
6.1.5. APEJ Aluminum Barrier Laminate (ABL) Tubes Market Size and Forecast, 2012-2022
6.1.5.1. Revenue (US$ Mn) Comparison, By Capacity
6.1.5.2. Revenue (US$ Mn) Comparison, By End-Use
6.1.5.3. Revenue (US$ Mn) Comparison, By Cap Type
6.1.6. MEA Aluminum Barrier Laminate (ABL) Tubes Market Size and Forecast, 2012-2022
6.1.6.1. Revenue (US$ Mn) Comparison, By Capacity
6.1.6.2. Revenue (US$ Mn) Comparison, By End-Use
6.1.6.3. Revenue (US$ Mn) Comparison, By Cap Type
7. North America Aluminum Barrier Laminate (ABL) Tubes Market Analysis and Forecast, By Country, 2012-2022
7.1. US Aluminum Barrier Laminate (ABL) Tubes Market Size and Forecast, 2012-2022
7.1.1. Revenue (US$ Mn) Comparison, By Capacity
7.1.2. Revenue (US$ Mn) Comparison, By End-Use
7.1.3. Revenue (US$ Mn) Comparison, By Cap Type
7.2. Canada Aluminum Barrier Laminate (ABL) Tubes Market Size and Forecast, 2012-2022
7.2.1. Revenue (US$ Mn) Comparison, By Capacity
7.2.2. Revenue (US$ Mn) Comparison, By End-Use
7.2.3. Revenue (US$ Mn) Comparison, By Cap Type
8. Latin America Aluminum Barrier Laminate (ABL) Tubes Market Analysis and Forecast, By Country, 2012-2022
8.1. Brazil Aluminum Barrier Laminate (ABL) Tubes Market Size and Forecast, 2012-2022
8.1.1. Revenue (US$ Mn) Comparison, By Capacity
8.1.2. Revenue (US$ Mn) Comparison, By End-Use
8.1.3. Revenue (US$ Mn) Comparison, By Cap Type
8.2. Mexico Aluminum Barrier Laminate (ABL) Tubes Market Size and Forecast, 2012-2022
8.2.1. Revenue (US$ Mn) Comparison, By Capacity
8.2.2. Revenue (US$ Mn) Comparison, By End-Use
8.2.3. Revenue (US$ Mn) Comparison, By Cap Type
8.3. Rest of Latin America Aluminum Barrier Laminate (ABL) Tubes Market Size and Forecast, 2012-2022
8.3.1. Revenue (US$ Mn) Comparison, By Capacity
8.3.2. Revenue (US$ Mn) Comparison, By End-Use
8.3.3. Revenue (US$ Mn) Comparison, By Cap Type
9. Europe Aluminum Barrier Laminate (ABL) Tubes Market Analysis and Forecast, By Country, 2012-2022
9.1. Germany Aluminum Barrier Laminate (ABL) Tubes Market Size and Forecast, 2012-2022
9.1.1. Revenue (US$ Mn) Comparison, By Capacity
9.1.2. Revenue (US$ Mn) Comparison, By End-Use
9.1.3. Revenue (US$ Mn) Comparison, By Cap Type
9.2. UK Aluminum Barrier Laminate (ABL) Tubes Market Size and Forecast, 2012-2022
9.2.1. Revenue (US$ Mn) Comparison, By Capacity
9.2.2. Revenue (US$ Mn) Comparison, By End-Use
9.2.3. Revenue (US$ Mn) Comparison, By Cap Type
9.3. France Aluminum Barrier Laminate (ABL) Tubes Market Size and Forecast, 2012-2022
9.3.1. Revenue (US$ Mn) Comparison, By Capacity
9.3.2. Revenue (US$ Mn) Comparison, By End-Use
9.3.3. Revenue (US$ Mn) Comparison, By Cap Type
9.4. Russia Aluminum Barrier Laminate (ABL) Tubes Market Size and Forecast, 2012-2022
9.4.1. Revenue (US$ Mn) Comparison, By Capacity
9.4.2. Revenue (US$ Mn) Comparison, By End-Use
9.4.3. Revenue (US$ Mn) Comparison, By Cap Type
9.5. Italy Aluminum Barrier Laminate (ABL) Tubes Market Size and Forecast, 2012-2022
9.5.1. Revenue (US$ Mn) Comparison, By Capacity
9.5.2. Revenue (US$ Mn) Comparison, By End-Use
9.5.3. Revenue (US$ Mn) Comparison, By Cap Type
9.6. Rest of Europe Aluminum Barrier Laminate (ABL) Tubes Market Size and Forecast, 2012-2022
9.6.1. Revenue (US$ Mn) Comparison, By Capacity
9.6.2. Revenue (US$ Mn) Comparison, By End-Use
9.6.3. Revenue (US$ Mn) Comparison, By Cap Type
10. Japan Aluminum Barrier Laminate (ABL) Tubes Market Analysis and Forecast, By Country, 2012-2022
10.1. Japan Aluminum Barrier Laminate (ABL) Tubes Market Size and Forecast, 2012-2022
10.1.1. Revenue (US$ Mn) Comparison, By Capacity
10.1.2. Revenue (US$ Mn) Comparison, By End-Use
10.1.3. Revenue (US$ Mn) Comparison, By Cap Type
11. APEJ Aluminum Barrier Laminate (ABL) Tubes Market Analysis and Forecast, By Country, 2012-2022
11.1. China Aluminum Barrier Laminate (ABL) Tubes Market Size and Forecast, 2012-2022
11.1.1. Revenue (US$ Mn) Comparison, By Capacity
11.1.2. Revenue (US$ Mn) Comparison, By End-Use
11.1.3. Revenue (US$ Mn) Comparison, By Cap Type
11.2. India Aluminum Barrier Laminate (ABL) Tubes Market Size and Forecast, 2012-2022
11.2.1. Revenue (US$ Mn) Comparison, By Capacity
11.2.2. Revenue (US$ Mn) Comparison, By End-Use
11.2.3. Revenue (US$ Mn) Comparison, By Cap Type
11.3. Malaysia Aluminum Barrier Laminate (ABL) Tubes Market Size and Forecast, 2012-2022
11.3.1. Revenue (US$ Mn) Comparison, By Capacity
11.3.2. Revenue (US$ Mn) Comparison, By End-Use
11.3.3. Revenue (US$ Mn) Comparison, By Cap Type
11.4. Thailand Aluminum Barrier Laminate (ABL) Tubes Market Size and Forecast, 2012-2022
11.4.1. Revenue (US$ Mn) Comparison, By Capacity
11.4.2. Revenue (US$ Mn) Comparison, By End-Use
11.4.3. Revenue (US$ Mn) Comparison, By Cap Type
11.5. Australia Aluminum Barrier Laminate (ABL) Tubes Market Size and Forecast, 2012-2022
11.5.1. Revenue (US$ Mn) Comparison, By Capacity
11.5.2. Revenue (US$ Mn) Comparison, By End-Use
11.5.3. Revenue (US$ Mn) Comparison, By Cap Type
11.6. Rest of APEJ Aluminum Barrier Laminate (ABL) Tubes Market Size and Forecast, 2012-2022
11.6.1. Revenue (US$ Mn) Comparison, By Capacity
11.6.2. Revenue (US$ Mn) Comparison, By End-Use
11.6.3. Revenue (US$ Mn) Comparison, By Cap Type
12. MEA Aluminum Barrier Laminate (ABL) Tubes Market Analysis and Forecast, By Country, 2012-2022
12.1. GCC Countries Aluminum Barrier Laminate (ABL) Tubes Market Size and Forecast, 2012-2022
12.1.1. Revenue (US$ Mn) Comparison, By Capacity
12.1.2. Revenue (US$ Mn) Comparison, By End-Use
12.1.3. Revenue (US$ Mn) Comparison, By Cap Type
12.2. South Africa Aluminum Barrier Laminate (ABL) Tubes Market Size and Forecast, 2012-2022
12.2.1. Revenue (US$ Mn) Comparison, By Capacity
12.2.2. Revenue (US$ Mn) Comparison, By End-Use
12.2.3. Revenue (US$ Mn) Comparison, By Cap Type
12.3. Israel Aluminum Barrier Laminate (ABL) Tubes Market Size and Forecast, 2012-2022
12.3.1. Revenue (US$ Mn) Comparison, By Capacity
12.3.2. Revenue (US$ Mn) Comparison, By End-Use
12.3.3. Revenue (US$ Mn) Comparison, By Cap Type
12.4. Rest of MEA Aluminum Barrier Laminate (ABL) Tubes Market Size and Forecast, 2012-2022
12.4.1. Revenue (US$ Mn) Comparison, By Capacity
12.4.2. Revenue (US$ Mn) Comparison, By End-Use
12.4.3. Revenue (US$ Mn) Comparison, By Cap Type
13. Global Aluminum Barrier Laminate (ABL) Tubes Market Company Share, Competition Landscape and Company Profiles
13.1. Company Share Analysis
13.2. Competition Landscape
13.3. Company Profiles
13.3.1. Essel Propack Ltd.
13.3.2. Huhtamaki Oyj
13.3.3. Montebello Packaging Inc.
13.3.4. Linhardt GmbH & Co KG
13.3.5. Hoffmann Neopac Ag
13.3.6. Intrapac International Corporation
13.3.7. Pirlo GmbH & Co KG
13.3.8. Impact International Pty. Limited
13.3.9. Tubapack S.A.
13.3.10. Ambertube International
14. Research Methodology
15. Secondary and Primary Sources
16. Assumptions and Acronyms
17. Disclaimer
List of Tables
TABLE 1 Global Aluminum Barrier Laminate (ABL) Tubes Market Value (US$ Mn), 2012-2016
TABLE 2 Global Aluminum Barrier Laminate (ABL) Tubes Market Value (US$ Mn), 2017-2022
TABLE 3 Global Aluminum Barrier Laminate (ABL) Tubes Market Value (US$ Mn) and Y-o-Y, 2015-2022
TABLE 4 Global Less than 50ml Capacity Segment Value (US$ Mn), By Region 2012-2016
TABLE 5 Global Less than 50ml Capacity Segment Value (US$ Mn), By Region 2017-2022
TABLE 6 Global Less than 50ml Capacity Segment Market Share, By Region 2012-2016
TABLE 7 Global Less than 50ml Capacity Segment Market Share, By Region 2017-2022
TABLE 8 Global Less than 50ml Capacity Segment Y-o-Y, By Region 2015-2022
TABLE 9 Global 50 to 100 ml Capacity Segment Value (US$ Mn), By Region 2012-2016
TABLE 10 Global 50 to 100 ml Capacity Segment Value (US$ Mn), By Region 2017-2022
TABLE 11 Global 50 to 100 ml Capacity Segment Market Share, By Region 2012-2016
TABLE 12 Global 50 to 100 ml Capacity Segment Market Share, By Region 2017-2022
TABLE 13 Global 50 to 100 ml Capacity Segment Y-o-Y, By Region 2015-2022
TABLE 14 Global 101 to 150 ml Capacity Segment Value (US$ Mn), By Region 2012-2016
TABLE 15 Global 101 to 150 ml Capacity Segment Value (US$ Mn), By Region 2017-2022
TABLE 16 Global 101 to 150 ml Capacity Segment Market Share, By Region 2012-2016
TABLE 17 Global 101 to 150 ml Capacity Segment Market Share, By Region 2017-2022
TABLE 18 Global 101 to 150 ml Capacity Segment Y-o-Y, By Region 2015-2022
TABLE 19 Global Above 150 ml Capacity Segment Value (US$ Mn), By Region 2012-2016
TABLE 20 Global Above 150 ml Capacity Segment Value (US$ Mn), By Region 2017-2022
TABLE 21 Global Above 150 ml Capacity Segment Market Share, By Region 2012-2016
TABLE 22 Global Above 150 ml Capacity Segment Market Share, By Region 2017-2022
TABLE 23 Global Above 150 ml Capacity Segment Y-o-Y, By Region 2015-2022
TABLE 24 Global Cosmetics Segment Value (US$ Mn), By Region 2012-2016
TABLE 25 Global Cosmetics Segment Value (US$ Mn), By Region 2017-2022
TABLE 26 Global Cosmetics Segment Market Share, By Region 2012-2016
TABLE 27 Global Cosmetics Segment Market Share, By Region 2017-2022
TABLE 28 Global Cosmetics Segment Y-o-Y, By Region 2015-2022
TABLE 29 Global Oral Care Segment Value (US$ Mn), By Region 2012-2016
TABLE 30 Global Oral Care Segment Value (US$ Mn), By Region 2017-2022
TABLE 31 Global Oral Care Segment Market Share, By Region 2012-2016
TABLE 32 Global Oral Care Segment Market Share, By Region 2017-2022
TABLE 33 Global Oral Care Segment Y-o-Y, By Region 2015-2022
TABLE 34 Global Commercial Segment Value (US$ Mn), By Region 2012-2016
TABLE 35 Global Commercial Segment Value (US$ Mn), By Region 2017-2022
TABLE 36 Global Commercial Segment Market Share, By Region 2012-2016
TABLE 37 Global Commercial Segment Market Share, By Region 2017-2022
TABLE 38 Global Commercial Segment Y-o-Y, By Region 2015-2022
TABLE 39 Global Pharmaceuticals Segment Value (US$ Mn), By Region 2012-2016
TABLE 40 Global Pharmaceuticals Segment Value (US$ Mn), By Region 2017-2022
TABLE 41 Global Pharmaceuticals Segment Market Share, By Region 2012-2016
TABLE 42 Global Pharmaceuticals Segment Market Share, By Region 2017-2022
TABLE 43 Global Pharmaceuticals Segment Y-o-Y, By Region 2015-2022
TABLE 44 Global Home & Other Personal Care Segment Value (US$ Mn), By Region 2012-2016
TABLE 45 Global Home & Other Personal Care Segment Value (US$ Mn), By Region 2017-2022
TABLE 46 Global Home & Other Personal Care Segment Market Share, By Region 2012-2016
TABLE 47 Global Home & Other Personal Care Segment Market Share, By Region 2017-2022
TABLE 48 Global Home & Other Personal Care Segment Y-o-Y, By Region 2015-2022
TABLE 49 Global Food Segment Value (US$ Mn), By Region 2012-2016
TABLE 50 Global Food Segment Value (US$ Mn), By Region 2017-2022
TABLE 51 Global Food Segment Market Share, By Region 2012-2016
TABLE 52 Global Food Segment Market Share, By Region 2017-2022
TABLE 53 Global Food Segment Y-o-Y, By Region 2015-2022
TABLE 54 Global Others Segment Value (US$ Mn), By Region 2012-2016
TABLE 55 Global Others Segment Value (US$ Mn), By Region 2017-2022
TABLE 56 Global Others Segment Market Share, By Region 2012-2016
TABLE 57 Global Others Segment Market Share, By Region 2017-2022
TABLE 58 Global Others Segment Y-o-Y, By Region 2015-2022
TABLE 59 Global Stand-up Cap Segment Value (US$ Mn), By Region 2012-2016
TABLE 60 Global Stand-up Cap Segment Value (US$ Mn), By Region 2017-2022
TABLE 61 Global Stand-up Cap Segment Market Share, By Region 2012-2016
TABLE 62 Global Stand-up Cap Segment Market Share, By Region 2017-2022
TABLE 63 Global Stand-up Cap Segment Y-o-Y, By Region 2015-2022
TABLE 64 Global Nozzle Cap Segment Value (US$ Mn), By Region 2012-2016
TABLE 65 Global Nozzle Cap Segment Value (US$ Mn), By Region 2017-2022
TABLE 66 Global Nozzle Cap Segment Market Share, By Region 2012-2016
TABLE 67 Global Nozzle Cap Segment Market Share, By Region 2017-2022
TABLE 68 Global Nozzle Cap Segment Y-o-Y, By Region 2015-2022
TABLE 69 Global Fez Cap Segment Value (US$ Mn), By Region 2012-2016
TABLE 70 Global Fez Cap Segment Value (US$ Mn), By Region 2017-2022
TABLE 71 Global Fez Cap Segment Market Share, By Region 2012-2016
TABLE 72 Global Fez Cap Segment Market Share, By Region 2017-2022
TABLE 73 Global Fez Cap Segment Y-o-Y, By Region 2015-2022
TABLE 74 Global Flip Top Cap Segment Value (US$ Mn), By Region 2012-2016
TABLE 75 Global Flip Top Cap Segment Value (US$ Mn), By Region 2017-2022
TABLE 76 Global Flip Top Cap Segment Market Share, By Region 2012-2016
TABLE 77 Global Flip Top Cap Segment Market Share, By Region 2017-2022
TABLE 78 Global Flip Top Cap Segment Y-o-Y, By Region 2015-2022
TABLE 79 Global Other Caps Segment Value (US$ Mn), By Region 2012-2016
TABLE 80 Global Other Caps Segment Value (US$ Mn), By Region 2017-2022
TABLE 81 Global Other Caps Segment Market Share, By Region 2012-2016
TABLE 82 Global Other Caps Segment Market Share, By Region 2017-2022
TABLE 83 Global Other Caps Segment Y-o-Y, By Region 2015-2022
TABLE 84 North America Aluminum Barrier Laminate (ABL) Tubes Market Value (US$ Mn), By Capacity2012-2016
TABLE 85 North America Aluminum Barrier Laminate (ABL) Tubes Market Value (US$ Mn), By Capacity2017-2022
TABLE 86 North America Aluminum Barrier Laminate (ABL) Tubes Market Value (US$ Mn), By End-Use2012-2016
TABLE 87 North America Aluminum Barrier Laminate (ABL) Tubes Market Value (US$ Mn), By End-Use2017-2022
TABLE 88 North America Aluminum Barrier Laminate (ABL) Tubes Market Value (US$ Mn), By Cap Type2012-2016
TABLE 89 North America Aluminum Barrier Laminate (ABL) Tubes Market Value (US$ Mn), By Cap Type2017-2022
TABLE 90 Latin America Aluminum Barrier Laminate (ABL) Tubes Market Value (US$ Mn), By Capacity2012-2016
TABLE 91 Latin America Aluminum Barrier Laminate (ABL) Tubes Market Value (US$ Mn), By Capacity2017-2022
TABLE 92 Latin America Aluminum Barrier Laminate (ABL) Tubes Market Value (US$ Mn), By End-Use2012-2016
TABLE 93 Latin America Aluminum Barrier Laminate (ABL) Tubes Market Value (US$ Mn), By End-Use2017-2022
TABLE 94 Latin America Aluminum Barrier Laminate (ABL) Tubes Market Value (US$ Mn), By Cap Type2012-2016
TABLE 95 Latin America Aluminum Barrier Laminate (ABL) Tubes Market Value (US$ Mn), By Cap Type2017-2022
TABLE 96 Europe Aluminum Barrier Laminate (ABL) Tubes Market Value (US$ Mn), By Capacity2012-2016
TABLE 97 Europe Aluminum Barrier Laminate (ABL) Tubes Market Value (US$ Mn), By Capacity2017-2022
TABLE 98 Europe Aluminum Barrier Laminate (ABL) Tubes Market Value (US$ Mn), By End-Use2012-2016
TABLE 99 Europe Aluminum Barrier Laminate (ABL) Tubes Market Value (US$ Mn), By End-Use2017-2022
TABLE 100 Europe Aluminum Barrier Laminate (ABL) Tubes Market Value (US$ Mn), By Cap Type2012-2016
TABLE 101 Europe Aluminum Barrier Laminate (ABL) Tubes Market Value (US$ Mn), By Cap Type2017-2022
TABLE 102 Japan Aluminum Barrier Laminate (ABL) Tubes Market Value (US$ Mn), By Capacity2012-2016
TABLE 103 Japan Aluminum Barrier Laminate (ABL) Tubes Market Value (US$ Mn), By Capacity2017-2022
TABLE 104 Japan Aluminum Barrier Laminate (ABL) Tubes Market Value (US$ Mn), By End-Use2012-2016
TABLE 105 Japan Aluminum Barrier Laminate (ABL) Tubes Market Value (US$ Mn), By End-Use2017-2022
TABLE 106 Japan Aluminum Barrier Laminate (ABL) Tubes Market Value (US$ Mn), By Cap Type2012-2016
TABLE 107 Japan Aluminum Barrier Laminate (ABL) Tubes Market Value (US$ Mn), By Cap Type2017-2022
TABLE 108 APEJ Aluminum Barrier Laminate (ABL) Tubes Market Value (US$ Mn), By Capacity2012-2016
TABLE 109 APEJ Aluminum Barrier Laminate (ABL) Tubes Market Value (US$ Mn), By Capacity2017-2022
TABLE 110 APEJ Aluminum Barrier Laminate (ABL) Tubes Market Value (US$ Mn), By End-Use2012-2016
TABLE 111 APEJ Aluminum Barrier Laminate (ABL) Tubes Market Value (US$ Mn), By End-Use2017-2022
TABLE 112 APEJ Aluminum Barrier Laminate (ABL) Tubes Market Value (US$ Mn), By Cap Type2012-2016
TABLE 113 APEJ Aluminum Barrier Laminate (ABL) Tubes Market Value (US$ Mn), By Cap Type2017-2022
TABLE 114 MEA Aluminum Barrier Laminate (ABL) Tubes Market Value (US$ Mn), By Capacity2012-2016
TABLE 115 MEA Aluminum Barrier Laminate (ABL) Tubes Market Value (US$ Mn), By Capacity2017-2022
TABLE 116 MEA Aluminum Barrier Laminate (ABL) Tubes Market Value (US$ Mn), By End-Use2012-2016
TABLE 117 MEA Aluminum Barrier Laminate (ABL) Tubes Market Value (US$ Mn), By End-Use2017-2022
TABLE 118 MEA Aluminum Barrier Laminate (ABL) Tubes Market Value (US$ Mn), By Cap Type2012-2016
TABLE 119 MEA Aluminum Barrier Laminate (ABL) Tubes Market Value (US$ Mn), By Cap Type2017-2022
TABLE 120 US Aluminum Barrier Laminate (ABL) Tubes Market Value (US$ Mn), By Capacity2012-2016
TABLE 121 US Aluminum Barrier Laminate (ABL) Tubes Market Value (US$ Mn), By Capacity2017-2022
TABLE 122 US Aluminum Barrier Laminate (ABL) Tubes Market Value (US$ Mn), By End-Use2012-2016
TABLE 123 US Aluminum Barrier Laminate (ABL) Tubes Market Value (US$ Mn), By End-Use2017-2022
TABLE 124 US Aluminum Barrier Laminate (ABL) Tubes Market Value (US$ Mn), By Cap Type2012-2016
TABLE 125 US Aluminum Barrier Laminate (ABL) Tubes Market Value (US$ Mn), By Cap Type2017-2022
TABLE 126 Canada Aluminum Barrier Laminate (ABL) Tubes Market Value (US$ Mn), By Capacity2012-2016
TABLE 127 Canada Aluminum Barrier Laminate (ABL) Tubes Market Value (US$ Mn), By Capacity2017-2022
TABLE 128 Canada Aluminum Barrier Laminate (ABL) Tubes Market Value (US$ Mn), By End-Use2012-2016
TABLE 129 Canada Aluminum Barrier Laminate (ABL) Tubes Market Value (US$ Mn), By End-Use2017-2022
TABLE 130 Canada Aluminum Barrier Laminate (ABL) Tubes Market Value (US$ Mn), By Cap Type2012-2016
TABLE 131 Canada Aluminum Barrier Laminate (ABL) Tubes Market Value (US$ Mn), By Cap Type2017-2022
TABLE 132 Brazil Aluminum Barrier Laminate (ABL) Tubes Market Value (US$ Mn), By Capacity2012-2016
TABLE 133 Brazil Aluminum Barrier Laminate (ABL) Tubes Market Value (US$ Mn), By Capacity2017-2022
TABLE 134 Brazil Aluminum Barrier Laminate (ABL) Tubes Market Value (US$ Mn), By End-Use2012-2016
TABLE 135 Brazil Aluminum Barrier Laminate (ABL) Tubes Market Value (US$ Mn), By End-Use2017-2022
TABLE 136 Brazil Aluminum Barrier Laminate (ABL) Tubes Market Value (US$ Mn), By Cap Type2012-2016
TABLE 137 Brazil Aluminum Barrier Laminate (ABL) Tubes Market Value (US$ Mn), By Cap Type2017-2022
TABLE 138 Mexico Aluminum Barrier Laminate (ABL) Tubes Market Value (US$ Mn), By Capacity2012-2016
TABLE 139 Mexico Aluminum Barrier Laminate (ABL) Tubes Market Value (US$ Mn), By Capacity2017-2022
TABLE 140 Mexico Aluminum Barrier Laminate (ABL) Tubes Market Value (US$ Mn), By End-Use2012-2016
TABLE 141 Mexico Aluminum Barrier Laminate (ABL) Tubes Market Value (US$ Mn), By End-Use2017-2022
TABLE 142 Mexico Aluminum Barrier Laminate (ABL) Tubes Market Value (US$ Mn), By Cap Type2012-2016
TABLE 143 Mexico Aluminum Barrier Laminate (ABL) Tubes Market Value (US$ Mn), By Cap Type2017-2022
TABLE 144 Rest of Latin America Aluminum Barrier Laminate (ABL) Tubes Market Value (US$ Mn), By Capacity2012-2016
TABLE 145 Rest of Latin America Aluminum Barrier Laminate (ABL) Tubes Market Value (US$ Mn), By Capacity2017-2022
TABLE 146 Rest of Latin America Aluminum Barrier Laminate (ABL) Tubes Market Value (US$ Mn), By End-Use2012-2016
TABLE 147 Rest of Latin America Aluminum Barrier Laminate (ABL) Tubes Market Value (US$ Mn), By End-Use2017-2022
TABLE 148 Rest of Latin America Aluminum Barrier Laminate (ABL) Tubes Market Value (US$ Mn), By Cap Type2012-2016
TABLE 149 Rest of Latin America Aluminum Barrier Laminate (ABL) Tubes Market Value (US$ Mn), By Cap Type2017-2022
TABLE 150 Germany Aluminum Barrier Laminate (ABL) Tubes Market Value (US$ Mn), By Capacity2012-2016
TABLE 151 Germany Aluminum Barrier Laminate (ABL) Tubes Market Value (US$ Mn), By Capacity2017-2022
TABLE 152 Germany Aluminum Barrier Laminate (ABL) Tubes Market Value (US$ Mn), By End-Use2012-2016
TABLE 153 Germany Aluminum Barrier Laminate (ABL) Tubes Market Value (US$ Mn), By End-Use2017-2022
TABLE 154 Germany Aluminum Barrier Laminate (ABL) Tubes Market Value (US$ Mn), By Cap Type2012-2016
TABLE 155 Germany Aluminum Barrier Laminate (ABL) Tubes Market Value (US$ Mn), By Cap Type2017-2022
TABLE 156 UK Aluminum Barrier Laminate (ABL) Tubes Market Value (US$ Mn), By Capacity2012-2016
TABLE 157 UK Aluminum Barrier Laminate (ABL) Tubes Market Value (US$ Mn), By Capacity2017-2022
TABLE 158 UK Aluminum Barrier Laminate (ABL) Tubes Market Value (US$ Mn), By End-Use2012-2016
TABLE 159 UK Aluminum Barrier Laminate (ABL) Tubes Market Value (US$ Mn), By End-Use2017-2022
TABLE 160 UK Aluminum Barrier Laminate (ABL) Tubes Market Value (US$ Mn), By Cap Type2012-2016
TABLE 161 UK Aluminum Barrier Laminate (ABL) Tubes Market Value (US$ Mn), By Cap Type2017-2022
TABLE 162 France Aluminum Barrier Laminate (ABL) Tubes Market Value (US$ Mn), By Capacity2012-2016
TABLE 163 France Aluminum Barrier Laminate (ABL) Tubes Market Value (US$ Mn), By Capacity2017-2022
TABLE 164 France Aluminum Barrier Laminate (ABL) Tubes Market Value (US$ Mn), By End-Use2012-2016
TABLE 165 France Aluminum Barrier Laminate (ABL) Tubes Market Value (US$ Mn), By End-Use2017-2022
TABLE 166 France Aluminum Barrier Laminate (ABL) Tubes Market Value (US$ Mn), By Cap Type2012-2016
TABLE 167 France Aluminum Barrier Laminate (ABL) Tubes Market Value (US$ Mn), By Cap Type2017-2022
TABLE 168 Russia Aluminum Barrier Laminate (ABL) Tubes Market Value (US$ Mn), By Capacity2012-2016
TABLE 169 Russia Aluminum Barrier Laminate (ABL) Tubes Market Value (US$ Mn), By Capacity2017-2022
TABLE 170 Russia Aluminum Barrier Laminate (ABL) Tubes Market Value (US$ Mn), By End-Use2012-2016
TABLE 171 Russia Aluminum Barrier Laminate (ABL) Tubes Market Value (US$ Mn), By End-Use2017-2022
TABLE 172 Russia Aluminum Barrier Laminate (ABL) Tubes Market Value (US$ Mn), By Cap Type2012-2016
TABLE 173 Russia Aluminum Barrier Laminate (ABL) Tubes Market Value (US$ Mn), By Cap Type2017-2022
TABLE 174 Italy Aluminum Barrier Laminate (ABL) Tubes Market Value (US$ Mn), By Capacity2012-2016
TABLE 175 Italy Aluminum Barrier Laminate (ABL) Tubes Market Value (US$ Mn), By Capacity2017-2022
TABLE 176 Italy Aluminum Barrier Laminate (ABL) Tubes Market Value (US$ Mn), By End-Use2012-2016
TABLE 177 Italy Aluminum Barrier Laminate (ABL) Tubes Market Value (US$ Mn), By End-Use2017-2022
TABLE 178 Italy Aluminum Barrier Laminate (ABL) Tubes Market Value (US$ Mn), By Cap Type2012-2016
TABLE 179 Italy Aluminum Barrier Laminate (ABL) Tubes Market Value (US$ Mn), By Cap Type2017-2022
TABLE 180 Rest of Europe Aluminum Barrier Laminate (ABL) Tubes Market Value (US$ Mn), By Capacity2012-2016
TABLE 181 Rest of Europe Aluminum Barrier Laminate (ABL) Tubes Market Value (US$ Mn), By Capacity2017-2022
TABLE 182 Rest of Europe Aluminum Barrier Laminate (ABL) Tubes Market Value (US$ Mn), By End-Use2012-2016
TABLE 183 Rest of Europe Aluminum Barrier Laminate (ABL) Tubes Market Value (US$ Mn), By End-Use2017-2022
TABLE 184 Rest of Europe Aluminum Barrier Laminate (ABL) Tubes Market Value (US$ Mn), By Cap Type2012-2016
TABLE 185 Rest of Europe Aluminum Barrier Laminate (ABL) Tubes Market Value (US$ Mn), By Cap Type2017-2022
TABLE 186 Japan Aluminum Barrier Laminate (ABL) Tubes Market Value (US$ Mn), By Capacity2012-2016
TABLE 187 Japan Aluminum Barrier Laminate (ABL) Tubes Market Value (US$ Mn), By Capacity2017-2022
TABLE 188 Japan Aluminum Barrier Laminate (ABL) Tubes Market Value (US$ Mn), By End-Use2012-2016
TABLE 189 Japan Aluminum Barrier Laminate (ABL) Tubes Market Value (US$ Mn), By End-Use2017-2022
TABLE 190 Japan Aluminum Barrier Laminate (ABL) Tubes Market Value (US$ Mn), By Cap Type2012-2016
TABLE 191 Japan Aluminum Barrier Laminate (ABL) Tubes Market Value (US$ Mn), By Cap Type2017-2022
TABLE 192 China Aluminum Barrier Laminate (ABL) Tubes Market Value (US$ Mn), By Capacity2012-2016
TABLE 193 China Aluminum Barrier Laminate (ABL) Tubes Market Value (US$ Mn), By Capacity2017-2022
TABLE 194 China Aluminum Barrier Laminate (ABL) Tubes Market Value (US$ Mn), By End-Use2012-2016
TABLE 195 China Aluminum Barrier Laminate (ABL) Tubes Market Value (US$ Mn), By End-Use2017-2022
TABLE 196 China Aluminum Barrier Laminate (ABL) Tubes Market Value (US$ Mn), By Cap Type2012-2016
TABLE 197 China Aluminum Barrier Laminate (ABL) Tubes Market Value (US$ Mn), By Cap Type2017-2022
TABLE 198 India Aluminum Barrier Laminate (ABL) Tubes Market Value (US$ Mn), By Capacity2012-2016
TABLE 199 India Aluminum Barrier Laminate (ABL) Tubes Market Value (US$ Mn), By Capacity2017-2022
TABLE 200 India Aluminum Barrier Laminate (ABL) Tubes Market Value (US$ Mn), By End-Use2012-2016
TABLE 201 India Aluminum Barrier Laminate (ABL) Tubes Market Value (US$ Mn), By End-Use2017-2022
TABLE 202 India Aluminum Barrier Laminate (ABL) Tubes Market Value (US$ Mn), By Cap Type2012-2016
TABLE 203 India Aluminum Barrier Laminate (ABL) Tubes Market Value (US$ Mn), By Cap Type2017-2022
TABLE 204 Malaysia Aluminum Barrier Laminate (ABL) Tubes Market Value (US$ Mn), By Capacity2012-2016
TABLE 205 Malaysia Aluminum Barrier Laminate (ABL) Tubes Market Value (US$ Mn), By Capacity2017-2022
TABLE 206 Malaysia Aluminum Barrier Laminate (ABL) Tubes Market Value (US$ Mn), By End-Use2012-2016
TABLE 207 Malaysia Aluminum Barrier Laminate (ABL) Tubes Market Value (US$ Mn), By End-Use2017-2022
TABLE 208 Malaysia Aluminum Barrier Laminate (ABL) Tubes Market Value (US$ Mn), By Cap Type2012-2016
TABLE 209 Malaysia Aluminum Barrier Laminate (ABL) Tubes Market Value (US$ Mn), By Cap Type2017-2022
TABLE 210 Thailand Aluminum Barrier Laminate (ABL) Tubes Market Value (US$ Mn), By Capacity2012-2016
TABLE 211 Thailand Aluminum Barrier Laminate (ABL) Tubes Market Value (US$ Mn), By Capacity2017-2022
TABLE 212 Thailand Aluminum Barrier Laminate (ABL) Tubes Market Value (US$ Mn), By End-Use2012-2016
TABLE 213 Thailand Aluminum Barrier Laminate (ABL) Tubes Market Value (US$ Mn), By End-Use2017-2022
TABLE 214 Thailand Aluminum Barrier Laminate (ABL) Tubes Market Value (US$ Mn), By Cap Type2012-2016
TABLE 215 Thailand Aluminum Barrier Laminate (ABL) Tubes Market Value (US$ Mn), By Cap Type2017-2022
TABLE 216 Australia Aluminum Barrier Laminate (ABL) Tubes Market Value (US$ Mn), By Capacity2012-2016
TABLE 217 Australia Aluminum Barrier Laminate (ABL) Tubes Market Value (US$ Mn), By Capacity2017-2022
TABLE 218 Australia Aluminum Barrier Laminate (ABL) Tubes Market Value (US$ Mn), By End-Use2012-2016
TABLE 219 Australia Aluminum Barrier Laminate (ABL) Tubes Market Value (US$ Mn), By End-Use2017-2022
TABLE 220 Australia Aluminum Barrier Laminate (ABL) Tubes Market Value (US$ Mn), By Cap Type2012-2016
TABLE 221 Australia Aluminum Barrier Laminate (ABL) Tubes Market Value (US$ Mn), By Cap Type2017-2022
TABLE 222 Rest of APEJ Aluminum Barrier Laminate (ABL) Tubes Market Value (US$ Mn), By Capacity2012-2016
TABLE 223 Rest of APEJ Aluminum Barrier Laminate (ABL) Tubes Market Value (US$ Mn), By Capacity2017-2022
TABLE 224 Rest of APEJ Aluminum Barrier Laminate (ABL) Tubes Market Value (US$ Mn), By End-Use2012-2016
TABLE 225 Rest of APEJ Aluminum Barrier Laminate (ABL) Tubes Market Value (US$ Mn), By End-Use2017-2022
TABLE 226 Rest of APEJ Aluminum Barrier Laminate (ABL) Tubes Market Value (US$ Mn), By Cap Type2012-2016
TABLE 227 Rest of APEJ Aluminum Barrier Laminate (ABL) Tubes Market Value (US$ Mn), By Cap Type2017-2022
TABLE 228 GCC Countries Aluminum Barrier Laminate (ABL) Tubes Market Value (US$ Mn), By Capacity2012-2016
TABLE 229 GCC Countries Aluminum Barrier Laminate (ABL) Tubes Market Value (US$ Mn), By Capacity2017-2022
TABLE 230 GCC Countries Aluminum Barrier Laminate (ABL) Tubes Market Value (US$ Mn), By End-Use2012-2016
TABLE 231 GCC Countries Aluminum Barrier Laminate (ABL) Tubes Market Value (US$ Mn), By End-Use2017-2022
TABLE 232 GCC Countries Aluminum Barrier Laminate (ABL) Tubes Market Value (US$ Mn), By Cap Type2012-2016
TABLE 233 GCC Countries Aluminum Barrier Laminate (ABL) Tubes Market Value (US$ Mn), By Cap Type2017-2022
TABLE 234 South Africa Aluminum Barrier Laminate (ABL) Tubes Market Value (US$ Mn), By Capacity2012-2016
TABLE 235 South Africa Aluminum Barrier Laminate (ABL) Tubes Market Value (US$ Mn), By Capacity2017-2022
TABLE 236 South Africa Aluminum Barrier Laminate (ABL) Tubes Market Value (US$ Mn), By End-Use2012-2016
TABLE 237 South Africa Aluminum Barrier Laminate (ABL) Tubes Market Value (US$ Mn), By End-Use2017-2022
TABLE 238 South Africa Aluminum Barrier Laminate (ABL) Tubes Market Value (US$ Mn), By Cap Type2012-2016
TABLE 239 South Africa Aluminum Barrier Laminate (ABL) Tubes Market Value (US$ Mn), By Cap Type2017-2022
TABLE 240 Israel Aluminum Barrier Laminate (ABL) Tubes Market Value (US$ Mn), By Capacity2012-2016
TABLE 241 Israel Aluminum Barrier Laminate (ABL) Tubes Market Value (US$ Mn), By Capacity2017-2022
TABLE 242 Israel Aluminum Barrier Laminate (ABL) Tubes Market Value (US$ Mn), By End-Use2012-2016
TABLE 243 Israel Aluminum Barrier Laminate (ABL) Tubes Market Value (US$ Mn), By End-Use2017-2022
TABLE 244 Israel Aluminum Barrier Laminate (ABL) Tubes Market Value (US$ Mn), By Cap Type2012-2016
TABLE 245 Israel Aluminum Barrier Laminate (ABL) Tubes Market Value (US$ Mn), By Cap Type2017-2022
TABLE 246 Rest of MEA Aluminum Barrier Laminate (ABL) Tubes Market Value (US$ Mn), By Capacity2012-2016
TABLE 247 Rest of MEA Aluminum Barrier Laminate (ABL) Tubes Market Value (US$ Mn), By Capacity2017-2022
TABLE 248 Rest of MEA Aluminum Barrier Laminate (ABL) Tubes Market Value (US$ Mn), By End-Use2012-2016
TABLE 249 Rest of MEA Aluminum Barrier Laminate (ABL) Tubes Market Value (US$ Mn), By End-Use2017-2022
TABLE 250 Rest of MEA Aluminum Barrier Laminate (ABL) Tubes Market Value (US$ Mn), By Cap Type2012-2016
TABLE 251 Rest of MEA Aluminum Barrier Laminate (ABL) Tubes Market Value (US$ Mn), By Cap Type2017-2022
List of Figures
FIG. 1 Global Aluminum Barrier Laminate (ABL) Tubes Market Value (US$ Mn), 2012-2016
FIG. 2 Global Aluminum Barrier Laminate (ABL) Tubes Market Value (US$ Mn) Forecast, 2017-2022
FIG. 3 Global Aluminum Barrier Laminate (ABL) Tubes Market Value (US$ Mn) and Y-o-Y, 2015-2022
FIG. 4 Global Less than 50ml Capacity Segment Market Value (US$ Mn) By Region, 2012-2016
FIG. 5 Global Less than 50ml Capacity Segment Market Value (US$ Mn) By Region, 2017-2022
FIG. 6 Global Less than 50ml Capacity Segment Y-o-Y Growth Rate, By Region, 2015-2022
FIG. 7 Global 50 to 100 ml Capacity Segment Market Value (US$ Mn) By Region, 2012-2016
FIG. 8 Global 50 to 100 ml Capacity Segment Market Value (US$ Mn) By Region, 2017-2022
FIG. 9 Global 50 to 100 ml Capacity Segment Y-o-Y Growth Rate, By Region, 2015-2022
FIG. 10 Global 101 to 150 ml Capacity Segment Market Value (US$ Mn) By Region, 2012-2016
FIG. 11 Global 101 to 150 ml Capacity Segment Market Value (US$ Mn) By Region, 2017-2022
FIG. 12 Global 101 to 150 ml Capacity Segment Y-o-Y Growth Rate, By Region, 2015-2022
FIG. 13 Global Above 150 ml Capacity Segment Market Value (US$ Mn) By Region, 2012-2016
FIG. 14 Global Above 150 ml Capacity Segment Market Value (US$ Mn) By Region, 2017-2022
FIG. 15 Global Above 150 ml Capacity Segment Y-o-Y Growth Rate, By Region, 2015-2022
FIG. 16 Global Cosmetics Segment Market Value (US$ Mn) By Region, 2012-2016
FIG. 17 Global Cosmetics Segment Market Value (US$ Mn) By Region, 2017-2022
FIG. 18 Global Cosmetics Segment Y-o-Y Growth Rate, By Region, 2015-2022
FIG. 19 Global Oral Care Segment Market Value (US$ Mn) By Region, 2012-2016
FIG. 20 Global Oral Care Segment Market Value (US$ Mn) By Region, 2017-2022
FIG. 21 Global Oral Care Segment Y-o-Y Growth Rate, By Region, 2015-2022
FIG. 22 Global Commercial Segment Market Value (US$ Mn) By Region, 2012-2016
FIG. 23 Global Commercial Segment Market Value (US$ Mn) By Region, 2017-2022
FIG. 24 Global Commercial Segment Y-o-Y Growth Rate, By Region, 2015-2022
FIG. 25 Global Pharmaceuticals Segment Market Value (US$ Mn) By Region, 2012-2016
FIG. 26 Global Pharmaceuticals Segment Market Value (US$ Mn) By Region, 2017-2022
FIG. 27 Global Pharmaceuticals Segment Y-o-Y Growth Rate, By Region, 2015-2022
FIG. 28 Global Home & Other Personal Care Segment Market Value (US$ Mn) By Region, 2012-2016
FIG. 29 Global Home & Other Personal Care Segment Market Value (US$ Mn) By Region, 2017-2022
FIG. 30 Global Home & Other Personal Care Segment Y-o-Y Growth Rate, By Region, 2015-2022
FIG. 31 Global Food Segment Market Value (US$ Mn) By Region, 2012-2016
FIG. 32 Global Food Segment Market Value (US$ Mn) By Region, 2017-2022
FIG. 33 Global Food Segment Y-o-Y Growth Rate, By Region, 2015-2022
FIG. 34 Global Others Segment Market Value (US$ Mn) By Region, 2012-2016
FIG. 35 Global Others Segment Market Value (US$ Mn) By Region, 2017-2022
FIG. 36 Global Others Segment Y-o-Y Growth Rate, By Region, 2015-2022
FIG. 37 Global Stand-up Cap Segment Market Value (US$ Mn) By Region, 2012-2016
FIG. 38 Global Stand-up Cap Segment Market Value (US$ Mn) By Region, 2017-2022
FIG. 39 Global Stand-up Cap Segment Y-o-Y Growth Rate, By Region, 2015-2022
FIG. 40 Global Nozzle Cap Segment Market Value (US$ Mn) By Region, 2012-2016
FIG. 41 Global Nozzle Cap Segment Market Value (US$ Mn) By Region, 2017-2022
FIG. 42 Global Nozzle Cap Segment Y-o-Y Growth Rate, By Region, 2015-2022
FIG. 43 Global Fez Cap Segment Market Value (US$ Mn) By Region, 2012-2016
FIG. 44 Global Fez Cap Segment Market Value (US$ Mn) By Region, 2017-2022
FIG. 45 Global Fez Cap Segment Y-o-Y Growth Rate, By Region, 2015-2022
FIG. 46 Global Flip Top Cap Segment Market Value (US$ Mn) By Region, 2012-2016
FIG. 47 Global Flip Top Cap Segment Market Value (US$ Mn) By Region, 2017-2022
FIG. 48 Global Flip Top Cap Segment Y-o-Y Growth Rate, By Region, 2015-2022
FIG. 49 Global Other Caps Segment Market Value (US$ Mn) By Region, 2012-2016
FIG. 50 Global Other Caps Segment Market Value (US$ Mn) By Region, 2017-2022
FIG. 51 Global Other Caps Segment Y-o-Y Growth Rate, By Region, 2015-2022
FIG. 52 North America Aluminum Barrier Laminate (ABL) Tubes Market Value (US$ Mn), By Capacity2012-2016
FIG. 53 North America Aluminum Barrier Laminate (ABL) Tubes Market Value (US$ Mn), By Capacity2017-2022
FIG. 54 North America Aluminum Barrier Laminate (ABL) Tubes Market Value (US$ Mn), By End-Use2012-2016
FIG. 55 North America Aluminum Barrier Laminate (ABL) Tubes Market Value (US$ Mn), By End-Use2017-2022
FIG. 56 North America Aluminum Barrier Laminate (ABL) Tubes Market Value (US$ Mn), By Cap Type2012-2016
FIG. 57 North America Aluminum Barrier Laminate (ABL) Tubes Market Value (US$ Mn), By Cap Type2017-2022
FIG. 58 Latin America Aluminum Barrier Laminate (ABL) Tubes Market Value (US$ Mn), By Capacity2012-2016
FIG. 59 Latin America Aluminum Barrier Laminate (ABL) Tubes Market Value (US$ Mn), By Capacity2017-2022
FIG. 60 Latin America Aluminum Barrier Laminate (ABL) Tubes Market Value (US$ Mn), By End-Use2012-2016
FIG. 61 Latin America Aluminum Barrier Laminate (ABL) Tubes Market Value (US$ Mn), By End-Use2017-2022
FIG. 62 Latin America Aluminum Barrier Laminate (ABL) Tubes Market Value (US$ Mn), By Cap Type2012-2016
FIG. 63 Latin America Aluminum Barrier Laminate (ABL) Tubes Market Value (US$ Mn), By Cap Type2017-2022
FIG. 64 Europe Aluminum Barrier Laminate (ABL) Tubes Market Value (US$ Mn), By Capacity2012-2016
FIG. 65 Europe Aluminum Barrier Laminate (ABL) Tubes Market Value (US$ Mn), By Capacity2017-2022
FIG. 66 Europe Aluminum Barrier Laminate (ABL) Tubes Market Value (US$ Mn), By End-Use2012-2016
FIG. 67 Europe Aluminum Barrier Laminate (ABL) Tubes Market Value (US$ Mn), By End-Use2017-2022
FIG. 68 Europe Aluminum Barrier Laminate (ABL) Tubes Market Value (US$ Mn), By Cap Type2012-2016
FIG. 69 Europe Aluminum Barrier Laminate (ABL) Tubes Market Value (US$ Mn), By Cap Type2017-2022
FIG. 70 Japan Aluminum Barrier Laminate (ABL) Tubes Market Value (US$ Mn), By Capacity2012-2016
FIG. 71 Japan Aluminum Barrier Laminate (ABL) Tubes Market Value (US$ Mn), By Capacity2017-2022
FIG. 72 Japan Aluminum Barrier Laminate (ABL) Tubes Market Value (US$ Mn), By End-Use2012-2016
FIG. 73 Japan Aluminum Barrier Laminate (ABL) Tubes Market Value (US$ Mn), By End-Use2017-2022
FIG. 74 Japan Aluminum Barrier Laminate (ABL) Tubes Market Value (US$ Mn), By Cap Type2012-2016
FIG. 75 Japan Aluminum Barrier Laminate (ABL) Tubes Market Value (US$ Mn), By Cap Type2017-2022
FIG. 76 APEJ Aluminum Barrier Laminate (ABL) Tubes Market Value (US$ Mn), By Capacity2012-2016
FIG. 77 APEJ Aluminum Barrier Laminate (ABL) Tubes Market Value (US$ Mn), By Capacity2017-2022
FIG. 78 APEJ Aluminum Barrier Laminate (ABL) Tubes Market Value (US$ Mn), By End-Use2012-2016
FIG. 79 APEJ Aluminum Barrier Laminate (ABL) Tubes Market Value (US$ Mn), By End-Use2017-2022
FIG. 80 APEJ Aluminum Barrier Laminate (ABL) Tubes Market Value (US$ Mn), By Cap Type2012-2016
FIG. 81 APEJ Aluminum Barrier Laminate (ABL) Tubes Market Value (US$ Mn), By Cap Type2017-2022
FIG. 82 MEA Aluminum Barrier Laminate (ABL) Tubes Market Value (US$ Mn), By Capacity2012-2016
FIG. 83 MEA Aluminum Barrier Laminate (ABL) Tubes Market Value (US$ Mn), By Capacity2017-2022
FIG. 84 MEA Aluminum Barrier Laminate (ABL) Tubes Market Value (US$ Mn), By End-Use2012-2016
FIG. 85 MEA Aluminum Barrier Laminate (ABL) Tubes Market Value (US$ Mn), By End-Use2017-2022
FIG. 86 MEA Aluminum Barrier Laminate (ABL) Tubes Market Value (US$ Mn), By Cap Type2012-2016
FIG. 87 MEA Aluminum Barrier Laminate (ABL) Tubes Market Value (US$ Mn), By Cap Type2017-2022
Copyright © Transparency Market Research, Inc. All Rights reserved
Trust Online

Aluminum Barrier Laminate (ABL) Tubes Market Growth Outlook