
Reports
Reports
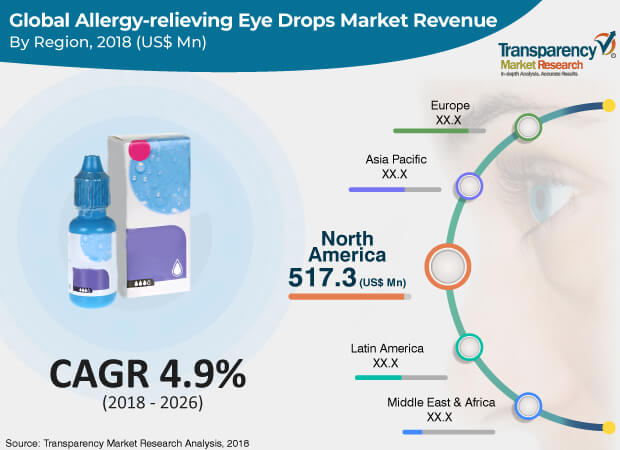
The global allergy-relieving eye drops market is expected to reach a value of US$ 1,930.3 Mn by the end of 2026, expanding at a significant CAGR of 5.0% during the forecast period. Increase in prevalence and incidence rates of eye-related disorders, high unmet needs in patients with ocular allergy, increased geriatric population, raised awareness about eye diseases in developing countries are expected to boost the allergy-relieving eye drops market during the forecast period. Moreover, significant rise in incidence of eye-related diseases, especially in developed countries, is anticipated to drive the allergy-relieving eye drops market between 2018 and 2026. According to the Prevent Blindness Report, the number of people in the U.S. suffering from cataract is expected to increase from 24.4 Mn in 2010, to 30.5 Mn by 2020, and the number of people suffering from diabetic retinopathy in the U.S. is projected to rise from 7.7 Mn in 2010 to reach 9.2 Mn by 2020
The global allergy-relieving eye drops market has been segmented based on drug class, type, distribution channel, and region. In terms of drug class, the global market has been classified into antihistamines, non-steroidal anti-inflammatory drugs, vasoconstrictors, and others. The antihistamines segment dominates the allergy-relieving eye drops market, in terms of value. The wide acceptance of antihistamines as the first line of treatment for allergic conjunctivitis is likely to drive the segment. Furthermore, increase in the prevalence of allergic conjunctivitis and rise in awareness about eye-related disorders are anticipated to propel the segment during the forecast period. This segment is also expected to expand at a significant CAGR, owing to its effectiveness in the treatment of ocular allergy. The vasoconstrictors segment follows the antihistamines segment, in terms of share, of the global allergy-relieving eye drops market. The dominance of the segment is attributed to the extensive utilization of vasoconstrictors to relieve redness of the eyes associated with ocular allergy.
In terms of type, the global market has been classified into seasonal and perennial allergic conjunctivitis, vernal keratoconjunctivitis, atopic keratoconjunctivitis, giant papillary conjunctivitis, and others. The seasonal and perennial allergic conjunctivitis segment is likely to dominate the global allergy-relieving eye drops market during the forecast period.
In terms of distribution channel, the allergy-relieving eye drops market has been segregated into hospital pharmacies, retail, and online sales. The retail segment held a major share of the market in 2017, followed by hospital pharmacies. The retail segment is expected to maintain its market share during forecast period due to the availability of both prescription as well as OTC drugs for allergic conjunctivitis. The online pharmacies segment is projected to expand at a considerable CAGR during the forecast period, owing to easy availability of drugs at home at a discounted price and long-term treatment required for certain form of ocular allergies.
In terms of region, the allergy-relieving eye drops market has been segmented into North America, Europe, Asia Pacific, Latin America, and Middle East & Africa. North America dominates the allergy-relieving eye drops market, owing to the high awareness about minor eye-related disorders in the U.S. and increased prevalence of allergic conjunctivitis in the region. Moreover, North America is anticipated to be a highly attractive market for allergy-relieving eye drops during the forecast period, owing to the high cost of prescription drugs and a significant number of people in this region covered by medical insurance.
Major players operating in the allergy-relieving eye drops market include Allergan Plc., Johnson & Johnson Services, Inc., Pfizer, Inc., F. Hoffmann-La Roche Ltd., Novartis AG, Bausch Health Companies Inc., Regeneron Pharmaceuticals, Inc., and Santen Pharmaceutical Co., Ltd. Key players are expanding their product portfolios through mergers & acquisitions and partnerships & collaborations with leading pharmaceutical companies, which is expected to increase the product availability and thereby boost the market.
Rising Prevalence of Eye Infections Worldwide to Propel Growth of Allergy Relieving Eye Drops Market
Increasing prevalence and occurrence paces of eye-related issues, high neglected requirements in patients with visual allergy, expanded geriatric populace, brought issues to light about eye sicknesses in agricultural nations are relied upon to support the allergy-relieving eye drops market during the conjecture time frame. Also, critical ascent in rate of eye-related sicknesses, particularly in created nations, is expected to drive the allergy-relieving eye drops market.
The wide acknowledgment of antihistamines as the main line of treatment for hypersensitive conjunctivitis is probably going to drive the antihistamines section of this market. Moreover, expansion in the pervasiveness of hypersensitive conjunctivitis and ascend in mindfulness about eye-related problems are expected to impel the portion during the gauge time frame. This fragment is likewise expected to grow at a huge CAGR, attributable to its adequacy in the treatment of visual allergy. The vasoconstrictors section follows the antihistamines fragment, as far as offer, of the worldwide allergy-relieving eye drops market. The predominance of the fragment is credited to the broad usage of vasoconstrictors to alleviate redness of the eyes related with visual allergy.
The rapidly expanding geriatric populace is inclined to huge danger of eye-related issues, including visual deficiency. Public mindfulness with respect to regular eye conditions is expanding in non-industrial nations, prompting early analysis and treatment of eye illnesses. Besides, countless associations are committed to battle visual impairment, reestablish vision, and make mindfulness with respect to eye wellbeing. Critical ascent in frequency of eye-related infections, particularly in created nations, is expected to drive this market.
Geographically, North America rules the allergy-relieving eye drops market, attributable to the high mindfulness about minor eye-related issues in the U.S. furthermore, expanded predominance of unfavorably susceptible conjunctivitis around there. Besides, North America is expected to be a profoundly alluring business sector for allergy-free eye drops during the gauge time frame, inferable from the significant expense of physician endorsed drugs and a critical number of individuals in this district covered by clinical protection.
1. Preface
1.1. Market Definition and Scope
1.2. Market Segmentation
1.3. Key Research Objectives
1.4. Research Highlights
2. Assumptions and Research Methodology
3. Executive Summary: Global Allergy-relieving Eye Drops Market
4. Market Overview
4.1. Introduction
4.1.1. Market Definition
4.1.2. Industry Evolution / Developments
4.2. Overview
4.3. Market Dynamics
4.3.1. Drivers
4.3.2. Restraints
4.3.3. Opportunities
4.4. Global Allergy-relieving Eye Drops Market Analysis and Forecast, 2016–2026
4.4.1. Market Revenue Projections (US$ Mn)
4.5. Porter’s Five Force Analysis
5. Market Outlook
5.1. Disease Prevalence & Incidence Rate Globally with Key Countries
5.2. Pipeline Analysis
5.3. Regulatory Scenario by Region
6. Global Allergy-relieving Eye Drops Market Analysis and Forecast, by Drug Class
6.1. Introduction & Definition
6.2. Key Findings / Developments
6.3. Global Allergy-relieving Eye Drops Market Value Forecast, by Drug Class, 2016–2026
6.3.1. Antihistamines
6.3.2. Non-steroidal Anti-inflammatory Drugs
6.3.3. Vasoconstrictors
6.3.4. Others
6.4. Global Allergy-relieving Eye Drops Market Attractiveness, by Drug Class
7. Global Allergy-relieving Eye Drops Market Analysis and Forecast, by Type
7.1. Introduction & Definition
7.2. Key Findings / Developments
7.3. Global Allergy-relieving Eye Drops Market Value Forecast, by Type, 2016–2026
7.3.1. Seasonal and Perennial Allergic Conjunctivitis
7.3.2. Vernal Keratoconjunctivitis
7.3.3. Atopic Keratoconjunctivitis
7.3.4. Giant Papillary Conjunctivitis
7.3.5. Others
7.4. Global Allergy-relieving Eye Drops Market Attractiveness, by Type
8. Global Allergy-relieving Eye Drops Market Analysis and Forecast, by Distribution Channel
8.1. Introduction & Definition
8.2. Key Findings / Developments
8.3. Global Allergy-relieving Eye Drops Market Value Forecast, by Distribution Channel, 2016–2026
8.3.1. Hospital Pharmacies
8.3.2. Retail
8.3.3. Online Sales
8.4. Global Allergy-relieving Eye Drops Market Attractiveness, by Distribution Channel
9. Global Allergy-relieving Eye Drops Market Analysis and Forecast, by Region
9.1. Key Findings
9.2. Global Allergy-relieving Eye Drops Market Value Forecast, by Region
9.2.1. North America
9.2.2. Europe
9.2.3. Asia Pacific
9.2.4. Latin America
9.2.5. Middle East & Africa
9.3. Global Allergy-relieving Eye Drops Market Attractiveness, by Country/Region
10. North America Allergy-relieving Eye Drops Market Analysis and Forecast
10.1. Introduction
10.1.1. Key Findings
10.2. North America Allergy-relieving Eye Drops Market Value Forecast, by Drug Class, 2016–2026
10.2.1. Antihistamines
10.2.2. Non-steroidal Anti-inflammatory Drugs
10.2.3. Vasoconstrictors
10.2.4. Others
10.3. North America Allergy-relieving Eye Drops Market Value Forecast, by Type, 2016–2026
10.3.1. Seasonal and Perennial Allergic Conjunctivitis
10.3.2. Vernal Keratoconjunctivitis
10.3.3. Atopic Keratoconjunctivitis
10.3.4. Giant Papillary Conjunctivitis
10.3.5. Others
10.4. North America Allergy-relieving Eye Drops Market Value Forecast, by Distribution Channel, 2016–2026
10.4.1. Hospital Pharmacies
10.4.2. Retail
10.4.3. Online Sales
10.5. North America Allergy-relieving Eye Drops Market Value Forecast, by Country, 2016–2026
10.5.1. US
10.5.2. Canada
10.6. North America Allergy-relieving Eye Drops Market Attractiveness Analysis
10.6.1. By Drug Class
10.6.2. By Type
10.6.3. By Distribution Channel
10.6.4. By Country
11. Europe Allergy-relieving Eye Drops Market Analysis and Forecast
11.1. Introduction
11.1.1. Key Findings
11.2. Europe Allergy-relieving Eye Drops Market Value Forecast, by Drug Class, 2016–2026
11.2.1. Antihistamines
11.2.2. Non-steroidal Anti-inflammatory Drugs
11.2.3. Vasoconstrictors
11.2.4. Others
11.3. Europe Allergy-relieving Eye Drops Market Value Forecast, by Type, 2016–2026
11.3.1. Seasonal and Perennial Allergic Conjunctivitis
11.3.2. Vernal Keratoconjunctivitis
11.3.3. Atopic Keratoconjunctivitis
11.3.4. Giant Papillary Conjunctivitis
11.3.5. Others
11.4. Europe Allergy-relieving Eye Drops Market Value Forecast, by Distribution Channel, 2016–2026
11.4.1. Hospital Pharmacies
11.4.2. Retail
11.4.3. Online Sales
11.5. Europe Allergy-relieving Eye Drops Market Value Forecast, by Country/Sub-region, 2016–2026
11.5.1. Germany
11.5.2. France
11.5.3. U.K.
11.5.4. Italy
11.5.5. Spain
11.5.6. Rest of Europe
11.6. Europe Allergy-relieving Eye Drops Market Attractiveness Analysis
11.6.1. By Drug Class
11.6.2. By Type
11.6.3. By Distribution Channel
11.6.4. By Country/Sub-region
12. Asia Pacific Allergy-relieving Eye Drops Market Analysis and Forecast
12.1. Introduction
12.1.1. Key Findings
12.2. Asia Pacific Allergy-relieving Eye Drops Market Value Forecast, by Drug Class, 2016–2026
12.2.1. Antihistamines
12.2.2. Non-steroidal Anti-inflammatory Drugs
12.2.3. Vasoconstrictors
12.2.4. Others
12.3. Asia Pacific Allergy-relieving Eye Drops Market Value Forecast, by Type, 2016–2026
12.3.1. Seasonal and Perennial Allergic Conjunctivitis
12.3.2. Vernal Keratoconjunctivitis
12.3.3. Atopic Keratoconjunctivitis
12.3.4. Giant Papillary Conjunctivitis
12.3.5. Others
12.4. Asia Pacific Allergy-relieving Eye Drops Market Value Forecast, by Distribution Channel, 2016–2026
12.4.1. Hospital Pharmacies
12.4.2. Retail
12.4.3. Online Sales
12.5. Asia Pacific Allergy-relieving Eye Drops Market Value Forecast, by Country/Sub-region, 2016–2026
12.5.1. Japan
12.5.2. China
12.5.3. India
12.5.4. Australia & New Zealand
12.5.5. Rest of Asia Pacific
12.6. Asia Pacific Allergy-relieving Eye Drops Market Attractiveness Analysis
12.6.1. By Drug Class
12.6.2. By Type
12.6.3. By Distribution Channel
12.6.4. By Country/Sub-region
13. Latin America Allergy-relieving Eye Drops Market Analysis and Forecast
13.1. Introduction
13.1.1. Key Findings
13.2. Latin America Allergy-relieving Eye Drops Market Value Forecast, by Drug Class, 2016–2026
13.2.1. Antihistamines
13.2.2. Non-steroidal Anti-inflammatory Drugs
13.2.3. Vasoconstrictors
13.2.4. Others
13.3. Latin America Allergy-relieving Eye Drops Market Value Forecast, by Type, 2016–2026
13.3.1. Seasonal and Perennial Allergic Conjunctivitis
13.3.2. Vernal Keratoconjunctivitis
13.3.3. Atopic Keratoconjunctivitis
13.3.4. Giant Papillary Conjunctivitis
13.3.5. Others
13.4. Latin America Allergy-relieving Eye Drops Market Value Forecast, by Distribution Channel, 2016–2026
13.4.1. Hospital Pharmacies
13.4.2. Retail
13.4.3. Online Sales
13.5. Latin America Allergy-relieving Eye Drops Market Value Forecast, by Country/Sub-region, 2016–2026
13.5.1. Brazil
13.5.2. Mexico
13.5.3. Rest of Latin America
13.6. Latin America Allergy-relieving Eye Drops Market Attractiveness Analysis
13.6.1. By Drug Class
13.6.2. By Type
13.6.3. By Distribution Channel
13.6.4. By Country/Sub-region
14. Middle East & Africa Allergy-relieving Eye Drops Market Analysis and Forecast
14.1. Introduction
14.1.1. Key Findings
14.2. Middle East & Africa Allergy-relieving Eye Drops Market Value Forecast, by Drug Class, 2016–2026
14.2.1. Antihistamines
14.2.2. Non-steroidal Anti-inflammatory Drugs
14.2.3. Vasoconstrictors
14.2.4. Others
14.3. Middle East & Africa Allergy-relieving Eye Drops Market Value Forecast, by Type, 2016–2026
14.3.1. Seasonal and Perennial Allergic Conjunctivitis
14.3.2. Vernal Keratoconjunctivitis
14.3.3. Atopic Keratoconjunctivitis
14.3.4. Giant Papillary Conjunctivitis
14.3.5. Others
14.4. Middle East & Africa Allergy-relieving Eye Drops Market Value Forecast, by Distribution Channel, 2016–2026
14.4.1. Hospital Pharmacies
14.4.2. Retail
14.4.3. Online Sales
14.5. Middle East & Africa Allergy-relieving Eye Drops Market Value Forecast, by Country/Sub-region 2016–2026
14.5.1. GCC Countries
14.5.2. Israel
14.5.3. South Africa
14.5.4. Rest of MEA
14.6. Middle East & Africa Allergy-relieving Eye Drops Market Attractiveness Analysis
14.6.1. By Drug Class
14.6.2. By Type
14.6.3. By Distribution Channel
14.6.4. By Country/Sub-region
15. Competition Landscape
15.1. Global Allergy-relieving Eye Drops Market Share Analysis, by Company (2016)
15.2. Company Profiles
15.2.1. Allergan plc.
15.2.1.1. Company Overview (HQ, Business Segments, Employee Strength)
15.2.1.2. Product Portfolio
15.2.1.3. SWOT Analysis
15.2.1.4. Financial Overview
15.2.1.5. Strategic Overview
15.2.2. Novartis AG
15.2.2.1. Company Overview (HQ, Business Segments, Employee Strength)
15.2.2.2. Product Portfolio
15.2.2.3. SWOT Analysis
15.2.2.4. Financial Overview
15.2.2.5. Strategic Overview
15.2.3. Johnson & Johnson Services, Inc.
15.2.3.1. Company Overview (HQ, Business Segments, Employee Strength)
15.2.3.2. Product Portfolio
15.2.3.3. SWOT Analysis
15.2.3.4. Financial Overview
15.2.3.5. Strategic Overview
15.2.4. Pfizer, Inc.
15.2.4.1. Company Overview (HQ, Business Segments, Employee Strength)
15.2.4.2. Product Portfolio
15.2.4.3. SWOT Analysis
15.2.4.4. Financial Overview
15.2.4.5. Strategic Overview
15.2.5. F. Hoffmann-La Roche Ltd.
15.2.5.1. Company Overview (HQ, Business Segments, Employee Strength)
15.2.5.2. Product Portfolio
15.2.5.3. SWOT Analysis
15.2.5.4. Financial Overview
15.2.5.5. Strategic Overview
15.2.6. Bausch Health Companies Inc.
15.2.6.1. Company Overview (HQ, Business Segments, Employee Strength)
15.2.6.2. Product Portfolio
15.2.6.3. SWOT Analysis
15.2.6.4. Financial Overview
15.2.6.5. Strategic Overview
15.2.7. Regeneron Pharmaceuticals, Inc.
15.2.7.1. Company Overview (HQ, Business Segments, Employee Strength)
15.2.7.2. Product Portfolio
15.2.7.3. SWOT Analysis
15.2.7.4. Financial Overview
15.2.7.5. Strategic Overview
15.2.8. Santen Pharmaceutical Co., Ltd.
15.2.8.1. Company Overview (HQ, Business Segments, Employee Strength)
15.2.8.2. Product Portfolio
15.2.8.3. SWOT Analysis
15.2.8.4. Financial Overview
15.2.8.5. Strategic Overview
List of Tables
Table 01: Global Allergy-relieving Eye Drops Market Value (US$ Mn) Forecast, by Drug Class, 2016–2026
Table 02: Global Allergy-relieving Eye Drops Market Value (US$ Mn) Forecast, by Type, 2016–2026
Table 03: Global Allergy-relieving Eye Drops Market Value (US$ Mn) Forecast, by Distribution Channel, 2016–2026
Table 04: Global Allergy-relieving Eye Drops Market Value (US$ Mn) Forecast, by Region, 2016–2026
Table 05: North America Allergy-relieving Eye Drops Market Value (US$ Mn) Forecast, by Country, 2016–2026
Table 06: North America Allergy-relieving Eye Drops Market Value (US$ Mn) Forecast, by Drug Class, 2016–2026
Table 07: North America Allergy-relieving Eye Drops Market Value (US$ Mn) Forecast, by Type, 2016–2026
Table 08: North America Allergy-relieving Eye Drops Market Value (US$ Mn) Forecast, by Distribution Channel, 2016–2026
Table 09: Europe Allergy-relieving Eye Drops Market Value (US$ Mn) Forecast, by Country/Sub-Region, 2016–2026
Table 10: Europe Allergy-relieving Eye Drops Market Value (US$ Mn) Forecast, by Drug Class, 2016–2026
Table 11: Europe Allergy-relieving Eye Drops Market Value (US$ Mn) Forecast, by Type, 2016–2026
Table 12: Europe Allergy-relieving Eye Drops Market Value (US$ Mn) Forecast, by Distribution Channel, 2016–2026
Table 13: Asia Pacific Allergy-relieving Eye Drops Market Value (US$ Mn) Forecast, by Country/Sub-region, 2016–2026
Table 14: Asia Pacific Allergy-relieving Eye Drops Market Value (US$ Mn) Forecast, by Drug Class, 2016–2026
Table 15: Asia Pacific Allergy-relieving Eye Drops Market Value (US$ Mn) Forecast, by Type, 2016–2026
Table 16: Asia Pacific Allergy-relieving Eye Drops Market Value (US$ Mn) Forecast, by Distribution Channel, 2016–2026
Table 17: Latin America Allergy-relieving Eye Drops Market Value (US$ Mn) Forecast, by Country/Sub-region, 2016–2026
Table 18: Latin America Allergy-relieving Eye Drops Market Value (US$ Mn) Forecast, by Drug Class, 2016–2026
Table 19: Latin America Allergy-relieving Eye Drops Market Value (US$ Mn) Forecast, by Type, 2016–2026
Table 20: Latin America Allergy-relieving Eye Drops Market Value (US$ Mn) Forecast, by Distribution Channel, 2016–2026
Table 21: Middle East & Africa Allergy-relieving Eye Drops Market Value (US$ Mn) Forecast, by Country/Sub-region, 2016–2026
Table 22: Middle East & Africa Allergy-relieving Eye Drops Market Value (US$ Mn) Forecast, by Drug Class, 2016–2026
Table 23: Middle East & Africa Allergy-relieving Eye Drops Market Value (US$ Mn) Forecast, by Type, 2016–2026
Table 24: Middle East & Africa Allergy-relieving Eye Drops Market Value (US$ Mn) Forecast, by Distribution Channel, 2016–2026
List of Figures
Figure 01: Global Allergy-relieving Eye Drops Market Value (US$ Mn) and Distribution, by Region, 2018 and 2026
Figure 02: Global Allergy-relieving Eye Drops Market Revenue, by Drug Class, 2018(E)
Figure 04: Global Allergy-relieving Eye Drops Market Revenue Share
Figure 05: Global Allergy-relieving Eye Drops Market Revenue Share
Figure 06: Global Allergy-relieving Eye Drops Market Value (US$ Mn) Forecast and Y-o-Y Growth (%) Projection, 2016–2026
Figure 07: Global Allergy-relieving Eye Drops Market Value Share, by Type (2017)
Figure 08: Global Allergy-relieving Eye Drops Market Value Share, by Distribution Channel (2017)
Figure 09: Global Allergy-relieving Eye Drops Market Value Share, by Region (2017)
Figure 10: Global Allergy-relieving Eye Drops Market Value Share Analysis, by Drug Class, 2018 and 2026
Figure 11: Global Allergy-relieving Eye Drops Market Value (US$ Mn) Forecast and Y-o-Y Growth (%) Projection, by Antihistamines, 2016–2026
Figure 12: Global Allergy-relieving Eye Drops Market Value (US$ Mn) Forecast and Y-o-Y Growth (%) Projection, by Non-steroidal Anti-inflammatory Drugs, 2016–2026
Figure 13: Global Allergy-relieving Eye Drops Market Value (US$ Mn) Forecast and Y-o-Y Growth (%) Projection, by Vasoconstrictors, 2016–2026
Figure 14: Global Allergy-relieving Eye Drops Market Value (US$ Mn) Forecast and Y-o-Y Growth (%) Projection, by Others, 2016–2026
Figure 15: Global Allergy-relieving Eye Drops Market Attractiveness, by Drug Class, 2018–2026
Figure 16: Global Allergy-relieving Eye Drops Market Value Share Analysis, by Type, 2017 and 2026
Figure 17: Global Allergy-relieving Eye Drops Market Value (US$ Mn) Forecast and Y-o-Y Growth (%) Projection, Seasonal and Perennial Allergic Conjunctivitis, 2016–2026
Figure 18: Global Allergy-relieving Eye Drops Market Value (US$ Mn) Forecast and Y-o-Y Growth (%) Projection, by Vernal Keratoconjunctivitis, 2016–2026
Figure 19: Global Allergy-relieving Eye Drops Market Value (US$ Mn) Forecast and Y-o-Y Growth (%) Projection, by Atopic Keratoconjunctivitis, 2016–2026
Figure 20: Global Allergy-relieving Eye Drops Market Value (US$ Mn) Forecast and Y-o-Y Growth (%) Projection, by Giant Papillary Conjunctivitis, 2016–2026
Figure 21: Global Allergy-relieving Eye Drops Market Value (US$ Mn) Forecast and Y-o-Y Growth (%) Projection, by Others, 2016–2026
Figure 22: Global Allergy-relieving Eye Drops Market Attractiveness, by Type, 2018–2026
Figure 23: Global Allergy-relieving Eye Drops Market Value Share Analysis, by Distribution Channel, 2018 and 2026
Figure 24: Global Allergy-relieving Eye Drops Market Value (US$ Mn) Forecast and Y-o-Y Growth (%) Projection, by Hospital Pharmacies, 2016–2026
Figure 25: Global Allergy-relieving Eye Drops Market Value (US$ Mn) Forecast and Y-o-Y Growth (%) Projection, by Retail, 2016–2026
Figure 26: Global Allergy-relieving Eye Drops Market Value (US$ Mn) Forecast and Y-o-Y Growth (%) Projection, by Online Sales, 2016–2026
Figure 27: Global Allergy-relieving Eye Drops Market Attractiveness Analysis, by Distribution Channel
Figure 28: Global Allergy-relieving Eye Drops Market Value Share (%), by Region, 2018 and 2026
Figure 29: Global Allergy-relieving Eye Drops Market Attractiveness, by Region, 2018–2026
Figure 30: North America Allergy-relieving Eye Drops Market Value (US$ Mn) Forecast and Y-o-Y Growth Projection (%), 2016–2026
Figure 31: North America Allergy-relieving Eye Drops Market Attractiveness, by Country, 2018–2026
Figure 32: North America Allergy-relieving Eye Drops Market Value Share, by Country, 2017 and 2026
Figure 33: North America Allergy-relieving Eye Drops Market Value Share, by Drug Class, 2017 and 2026
Figure 34: North America Allergy-relieving Eye Drops Market Attractiveness, by Drug Class, 2018–2026
Figure 35: North America Allergy-relieving Eye Drops Market Value Share Analysis, by Type, 2017 and 2026
Figure 36: North America Allergy-relieving Eye Drops Market Attractiveness, by Type, 2018–2026
Figure 37: North America Allergy-relieving Eye Drops Market Value Share, by Distribution Channel, 2017 and 2026
Figure 38: North America Allergy-relieving Eye Drops Market Attractiveness, by Distribution Channel, 2018–2026
Figure 39: Europe Allergy-relieving Eye Drops Market Value (US$ Mn) Forecast and Y-o-Y Growth Projection (%), 2016–2026
Figure 40: Europe Allergy-relieving Eye Drops Market Attractiveness, by Country/Sub-Region, 2018–2026
Figure 41: Europe Allergy-relieving Eye Drops Market Value Share, by Country/Sub-Region, 2017 and 2026
Figure 42: Europe Allergy-relieving Eye Drops Market Value Share, by Drug Class, 2017 and 2026
Figure 43: Europe Allergy-relieving Eye Drops Market Attractiveness, by Drug Class, 2018–2026
Figure 44: Europe Allergy-relieving Eye Drops Market Value Share Analysis, by Type, 2017 and 2026
Figure 45: Europe Allergy-relieving Eye Drops Market Attractiveness, by Type, 2018–2026
Figure 46: Europe Allergy-relieving Eye Drops Market Value Share, by Distribution Channel, 2017 and 2026
Figure 47: Europe Allergy-relieving Eye Drops Market Attractiveness, by Distribution Channel, 2018–2026
Figure 48: Asia Pacific Allergy-relieving Eye Drops Market Value (US$ Mn) Forecast and Y-o-Y Growth Projection (%), 2016–2026
Figure 49: Asia Pacific Allergy-relieving Eye Drops Market Attractiveness, by Country/Sub-region, 2018–2026
Figure 50: Asia Pacific Allergy-relieving Eye Drops Market Value Share, by Country/Sub-region, 2017 and 2026
Figure 51: Asia Pacific Allergy-relieving Eye Drops Market Value Share, by Drug Class, 2017 and 2026
Figure 52: Asia Pacific Allergy-relieving Eye Drops Market Attractiveness, by Drug Class, 2018–2026
Figure 53: Asia Pacific Allergy-relieving Eye Drops Market Value Share Analysis, by Type, 2017 and 2026
Figure 54: Asia Pacific Allergy-relieving Eye Drops Market Attractiveness, by Type, 2018–2026
Figure 55: Asia Pacific Allergy-relieving Eye Drops Market Value Share, by Distribution Channel, 2017 and 2026
Figure 56: Asia Pacific Allergy-relieving Eye Drops Market Attractiveness, by Distribution Channel, 2018–2026
Figure 57: Latin America Allergy-relieving Eye Drops Market Value (US$ Mn) Forecast and Y-o-Y Growth Projection (%), 2016–2026
Figure 58: Latin America Allergy-relieving Eye Drops Market Attractiveness, by Country/Sub-region, 2018–2026
Figure 59: Latin America Allergy-relieving Eye Drops Market Value Share, by Country/Sub-region, 2017 and 2026
Figure 60: Latin America Allergy-relieving Eye Drops Market Value Share, by Drug Class, 2017 and 2026
Figure 61: Latin America Allergy-relieving Eye Drops Market Attractiveness, by Drug Class, 2018–2026
Figure 62: Latin America Allergy-relieving Eye Drops Market Value Share Analysis, by Type, 2017 and 2026
Figure 63: Latin America Allergy-relieving Eye Drops Market Attractiveness, by Type, 2018–2026
Figure 64: Latin America Allergy-relieving Eye Drops Market Value Share, by Distribution Channel, 2017 and 2026
Figure 65: Latin America Allergy-relieving Eye Drops Market Attractiveness, by Distribution Channel, 2018–2026
Figure 66: Middle East & Africa Allergy-relieving Eye Drops Market Value (US$ Mn) Forecast and Y-o-Y Growth Projection (%), 2016–2026
Figure 67: Middle East & Africa Allergy-relieving Eye Drops Market Attractiveness, by Country/Sub-Region, 2018–2026
Figure 68: Middle East & Africa Allergy-relieving Eye Drops Market Value Share, by Country/Sub-Region, 2017 and 2026
Figure 69: Middle East & Africa Allergy-relieving Eye Drops Market Value Share, by Drug Class, 2017 and 2026
Figure 70: Middle East & Africa Allergy-relieving Eye Drops Market Attractiveness, by Drug Class, 2018–2026
Figure 71: Middle East & Africa Allergy-relieving Eye Drops Market Value Share Analysis, by Type, 2017 and 2026
Figure 72: Middle East & Africa Allergy-relieving Eye Drops Market Attractiveness, by Type, 2018–2026
Figure 73: Middle East & Africa Allergy-relieving Eye Drops Market Value Share, by Distribution Channel, 2017 and 2026
Figure 74: Middle East & Africa Allergy-relieving Eye Drops Market Attractiveness, by Distribution Channel, 2018–2026
Figure 75: Allergan plc. Revenue (US$ Bn) and Y-o-Y Growth (%), 2015–2017
Figure 76: Allergen plc. R&D Expenses (USD Mn), 2016–2017
Figure 77: Allergan plc. Sales and Marketing Expenses (USD Mn), 2017
Figure 78: Allergan plc. Breakdown of Net Sales, by Business Segment, 2017
Figure 79 : Johnson & Johnson Services, Inc. Revenue (US$ Bn) & Y-o-Y Growth (%), 2014–2017
Figure 80: Johnson & Johnson Services, Inc. Vision care revenue (US$ Bn) & Y-o-Y Growth (%), 2015–2017
Figure 81: Johnson & Johnson Services, Inc. Breakdown of Net Sales, by Business Segment, 2017
Figure 82: Johnson & Johnson Services, Inc.(Research & Development Cost, 2015 – 2017 (US$ Bn)
Figure 83: Pfizer, Inc. Revenue (US$ Bn) & Y-o-Y Growth (%), 2013–2017
Figure 84: Pfizer, Inc. R&D Expenses and SI&A Expenses (%) 2015–2017
Figure 85: Pfizer, Inc. Breakdown of Net Sales, by Geography (Essential Health Segment), 2017
Figure 86: Pfizer, Inc. Breakdown of Net Sales, by Business Segments (%), 2017
Figure 87: F. Hoffmann-La Roche Ltd. Breakdown of Net Sales, by Business Segment, 2017
Figure 88: F. Hoffmann-La Roche Ltd. Revenue (US$ Bn) & Y-o-Y Growth (%), 2014–2017
Figure 89: F. Hoffmann-La Roche Ltd. Research & Development Cost, 2015 – 2017 (US$ Bn)
Figure 90: Novartis AG Revenue (US$ Mn) and Y-o-Y Growth (%), 2014–2017
Figure 91: Novartis AG R&D Expenses (US$ Mn) and Y-o-Y Growth (%), 2014–2017
Figure 92: Novartis AG Breakdown of Net Sales, by Region, 2017
Figure 93: Novartis AG Breakdown of Net Sales, by Business Segments, 2017
Figure 94: Bausch Health Companies Inc. Breakdown of Net Sales (%), by Region, 2017
Figure 95: Bausch Health Companies Inc. Revenue (US$ Bn) and Y-o-Y Growth (%), 2015–2017
Figure 96: Bausch Health Companies Inc. Breakdown of Revenues(%), by Product Category, 2017
Figure 97: Bausch Health Companies Inc. R&D Expenses (US$ Mn), 2015-2017
Figure 98: Regeneron Pharmaceuticals, Inc. Revenue (US$ Mn) & Y-o-Y Growth (%), 2014–2017
Figure 99: Regeneron Pharmaceuticals, Inc. R&D Expenses (US$ Mn), 2013-2017
Figure 100: Santen Pharmaceutical Co., Ltd. Revenue (US$ Mn) & Y-o-Y Growth (%), 2015–2017
Figure 101: Santen Pharmaceutical Co., Ltd. Breakdown of Net Sales, by Operating Segments, 2017
Figure 102: Santen Pharmaceutical Co., Ltd. Breakdown of Net Sales, by Region, 2017
Figure 103: Santen Pharmaceutical Co., Ltd. Research & Development Cost, 2015–2017 (US$ Mn)
Copyright © Transparency Market Research, Inc. All Rights reserved
Trust Online

Allergy relieving Eye Drops Market