
Reports
Reports
Drones, better known as the unmanned aerial vehicle is aircraft without a human pilot. It has been in existence for a long time and is used in various industry including mining, construction, agriculture and military drone. The agricultural use of drones has recently gained traction after the world started witnessing the tremendous growth in population leading towards the growing demand for food. However, use of such UAV for precision agriculture has been in use since 1990s in some part of Asia-pacific, North America and Europe. These UAV were largely used for spraying pesticides, crops in farm area and are still being used for the same purpose in many parts of the world. The agriculture drone market is therefore the most attractive market that is expected to change the way farming was earlier done.
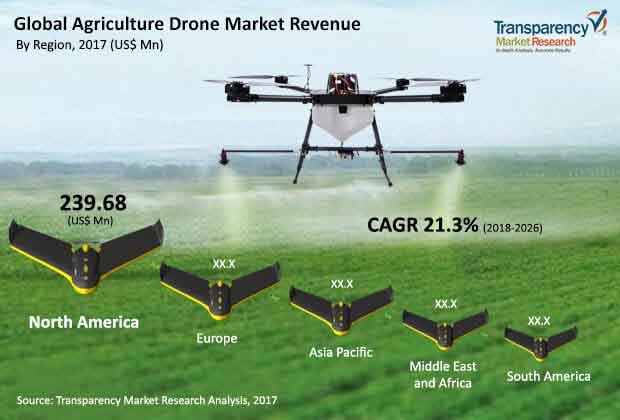
The global agriculture drone market revenue stood at US$ 293.6 Mn in 2016 and is anticipated to expand at a CAGR of 21.3% during the forecast period from 2018 to 2026.
Major factor leading to the growth of agriculture drones market are growing awareness about precision farming, need to enhance the yield and government support to use advance technologies in agriculture. Drones are responsible for generating accurate data that can be helpful for farmers to monitor crop health, reduce the impact of climate change and efficiently detect weed. The drones are also helpful in uniform spraying of crops and pesticide for better result. For instance Yamaha RMAX, which is probably the first UAV crop sprayer which has 2x8 liter spray tank has proved effective for precise small scale spraying. OPtim Agri drone is the joint project among local government, university and IT Company of Japan that has the capability to identify insects so that it can initiate accurate attack on those areas with chemicals. These benefits, among several others are helping farmers do effective farming.
The global agriculture drone market has been segmented on the basis of type, and application. The type segment has further been categorized into fixed-wing, multi-rotor (also known as quad copter) and hybrid drones. Fixed-Wing type of drones holds the largest market share globally. However, multi-rotor type of drones are expected to display comparatively healthy growth during the forecast period. On the basis of application, the market has been divided as spraying, crop scouting, field mapping and others. Spraying is one of the dominated application globally. Countries around the globe are increasingly using drones for spraying crop, pesticides on the farming filed. Application including field monitoring and crop scouting is expected to gain momentum in coming three to four year when framers across the globe will become familiar with drones and their capabilities.
The global agriculture drone market is expected to be driven by the North America region However, Europe is estimated to contribute major share in the overall agriculture drone market, closely followed by Asia Pacific. In Europe, France is anticipated to drive the growth of agriculture drone market. The growing deployment of drone in European countries are largely due to the growing need among countries to enhance the overall farm productivity. The European Union (EU) is also actively working in the direction of deploying drones for farming.
In Asia Pacific, countries including Japan, China and Australia are anticipated to drive the growth of agriculture drone market. Japan dominated the market in 2016 and is expected to continue its dominance over the forecast period from 2018 to 2026. China and Australia are expected to grow at a considerable rate. In the rest of Asia Pacific countries including India, New Zealand have witnessed relatively healthy deployment of drones than other Asia-pacific countries.
Key vendors in the market are continuously involved in introducing more easy-to-use drones that can effectively cater the needs of farmers. Major players profiled in the global agriculture drone market include Agribotix LLC, Delair Technologies Inc., Honeycomb Corporation, Precision Hawk, Drone AG, Ag Eagle Aerial Systems, Parrot SA, Aerovironment Inc., and DJI Innovate among others.
The agriculture drones market share is expected to witness notable growth during the forecast period, owing to rise in venture funding for deployment of drones in the agriculture industry, globally.
Some of the leading vendors in the market are Agribotix LLC, Delair Technologies Inc., Honeycomb Corporation, Precision Hawk, Drone AG, Ag Eagle Aerial Systems, Parrot SA, Aerovironment Inc., DJI Innovate, Yamaha Corporation, Sentera LLC., and Ideaforge India Private Ltd.
The Agriculture Drones Market is estimated to grow at a 21.35% CAGR from 2018 to 2026
The Agriculture Drones Market is segmented on the basis of offering, components, application and region.
The key growth strategies of Agriculture Drones Market players include product portfolio expansion, mergers & acquisitions, agreements, geographical expansion, and collaborations.
1. Preface
1.1. Market Definition and Scope
1.2. Market Segmentation
1.3. Key Research Objectives
1.4. Research Highlights
2. Assumptions and Research Methodology
3. Executive Summary: Global Agriculture Drone Market
4. Market Overview
4.1. Introduction
4.2. Market Dynamics
4.2.1. Drivers
4.2.2. Restraints
4.2.3. Opportunities
4.2.3. Key Trends
4.3. Key Market Indicators
4.3.1. Agriculture Robot Market
4.3.2. Investment trend in Agriculture Technology
4.4. Global Agriculture Drone Market Analysis and Forecasts, 2016 - 2026
4.4.1. Market Revenue Projections (US$ Mn and Thousand Units)
4.5. Porter’s Five Force Analysis
4.6. Agriculture Drone Market: Value Chain Analysis
4.7. Market Outlook
5. Global Agriculture Drone Market Analysis and Forecasts, By Type
5.1. Overview & Definition
5.2. Key Findings
5.3. Agriculture Drone Market Size (US$ Mn and Thousand Units) Forecast By Type, 2016 - 2026
5.3.1. Fixed-Wing
5.3.2. Multi-Rotor
5.3.3. Hybrid UAVs
5.4. Type Comparison Matrix
5.5. Market Attractiveness: By Type
6. Global Agriculture Drone Market Analysis and Forecasts, By Application
6.1. Overview & Definition
6.2. Key Findings
6.3. Agriculture Drone Market Size (US$ Mn) Forecast By Application, 2016 - 2026
6.3.1. Spraying
6.3.2. Field Mapping
6.3.3. Crop Scouting
6.3.4. Others
6.4. Application Comparison Matrix
6.5. Market Attractiveness: By Application
7. Global Agriculture Drone Market Analysis and Forecasts, By Region
7.1. Key Findings
7.2. Agriculture Drone Market Size (US$ Mn and Thousand Units) Forecast by Region, 2016 - 2026
7.2.1. North America
7.2.2. Europe
7.2.3. Asia Pacific
7.2.4. Middle East and Africa
7.2.5. South America
7.3. Market Attractiveness by Region
8. North America Agriculture Drone Market Analysis and Forecast
8.1. Key Findings
8.2. Agriculture Drone Market Size (US$ Mn and Thousand Units) Forecast By Type, 2016 - 2026
8.2.1. Fixed-Wing
8.2.2. Multi-Rotor
8.2.3. Hybrid UAVs
8.3. Agriculture Drone Market Size (US$ Mn) Forecast By Application, 2016 - 2026
8.3.1. Spraying
8.3.2. Field Mapping
8.3.3. Crop Scouting
8.3.4. Others
8.4. Agriculture Drone Market Size (US$ Mn and Thousand Units) Forecast by Country, 2016 - 2026
8.4.1. The U.S.
8.4.2. Canada
8.4.3. Rest of North America
8.5. Market Attractiveness Analysis
8.5.1. By Type
8.5.2. By Application
8.5.3. By Country
9. Europe Agriculture Drone Market Analysis and Forecast
9.1. Key Findings
9.2. Agriculture Drone Market Size (US$ Mn and Thousand Units) Forecast By Type, 2016 - 2026
9.2.1. Fixed-Wing
9.3.2. Multi-Rotor
9.3.3. Hybrid UAVs
9.3. Agriculture Drone Market Size (US$ Mn) Forecast By Application, 2016 - 2026
9.3.1. Spraying
9.3.2. Field Mapping
9.3.3. Crop Scouting
9.3.4. Others
9.4. Agriculture Drone Market Size (US$ Mn and Thousand Units) Forecast by Country, 2016 - 2026
9.4.1. Germany
9.4.2. U.K.
9.4.3. France
9.4.4. Rest of Europe
9.5. Market Attractiveness Analysis
9.5.1. By Type
9.5.2. By Application
9.5.3. By Country
10. Asia-Pacific Agriculture Drone Market Analysis and Forecast
10.1. Key Findings
10.2. Agriculture Drone Market Size (US$ Mn and Thousand Units) Forecast By Type, 2016 - 2026
10.2.1. Fixed-Wing
10.2.2. Multi-Rotor
10.2.3. Hybrid UAVs
10.3. Agriculture Drone Market Size (US$ Mn) Forecast By Application, 2016 - 2026
10.3.1. Spraying
10.3.2. Field Mapping
10.3.3. Crop Scouting
10.3.4. Others
10.4. Agriculture Drone Market Size (US$ Mn and Thousand Units) Forecast by Country, 2016 - 2026
10.4.1. Japan
10.4.2. China
10.4.3. Australia
10.4.4. Rest of Asia-Pacific
10.5. Market Attractiveness Analysis
10.5.1. By Type
10.5.2. By Application
10.5.3. By Country
11. Middle-East and Africa Agriculture Drone Market Analysis and Forecast
11.1. Key Findings
11.2. Agriculture Drone Market Size (US$ Mn and Thousand Units) Forecast By Type, 2016 - 2026
11.2.1. Fixed-Wing
11.2.2. Multi-Rotor
11.2.3. Hybrid UAVs
11.3. Agriculture Drone Market Size (US$ Mn and Thousand Units) Forecast By Application, 2016 - 2026
11.3.1. Spraying
11.3.2. Field Mapping
11.3.3. Crop Scouting
11.3.4. Others
11.4. Agriculture Drone Market Size (US$ Mn and Thousand Units) Forecast by Country, 2016 - 2026
11.4.1. UAE
11.4.2. South Africa
11.4.3. Rest of MEA
11.5. Market Attractiveness Analysis
11.5.1. By Type
11.5.2. By Application
11.5.3. By Country
12. South America Agriculture Drone Market Analysis and Forecast
12.1. Key Findings
12.2. Agriculture Drone Market Size (US$ Mn and Thousand Units) Forecast By Type, 2016 - 2026
12.2.1. Fixed-Wing
12.2.2. Multi-Rotor
12.2.3. Hybrid UAVs
12.3. Agriculture Drone Market Size (US$ Mn and Thousand Units) Forecast By Application, 2016 - 2026
12.3.1. Spraying
12.3.2. Field Mapping
12.3.3. Crop Scouting
12.3.4. Others
12.4. Agriculture Drone Market Size (US$ Mn and Thousand Units) Forecast by Country, 2016 - 2026
12.4.1. Brazil
12.4.2. Argentina
12.4.3. Rest of South America
12.5. Market Attractiveness Analysis
12.5.1. By Type
12.5.2. By Application
12.5.3. By Country
13. Competition Landscape
13.1. Market Player – Competition Matrix
13.2. Market Positioning Analysis: By Company (2016)
13.3. Key Competitive Strategies
13.4. Company Profiles (Details – Overview, Financials, SWOT, Strategy)
13.4.1. AeroVironment, Inc.
13.4.2. AgEagle Aerial Systems
13.4.3. Agribotix LLC
13.4.4. HoneyComb Corporation
13.4.5. Parrot SA.
13.4.6. PrecisionHawk
13.4.7. Sentera, LLC
13.4.8. Delair Tech SAS
13.4.9. Insitu Pacific Pty Ltd
13.4.10. Drone AG
13.4.11. DJI innovation Science and Technology Co.
13.4.12. ideaForge Technology Pvt. Ltd
13.4.13. Yamaha Corporation
14. Key Takeaways
List of Tables
Table 1: Global Agriculture Drones Market Forecast, By Type, 2016–2026 (US$ Mn)
Table 2: Global Agriculture Drones Market Forecast, By Type, 2016–2026 (Thousand Units)
Table 3: Global Agriculture Drones Market Forecast, By Application, 2016–2026 (US$ Mn)
Table 4: Global Agriculture Drones Market Forecast, By Application, 2016–2026 (Thousand Units)
Table 5: Global Agriculture Drones Market Value Forecast, By Region (US$ Mn)
Table 6: Global Agriculture Drones Market Volume Forecast, By Region (Thousand Units)
Table 7: North America Agriculture Drones Market Size (US$ Mn) Forecast, by Type, 2016–2026
Table 8: North America Agriculture Drones Market Volume (Thousand Units) Forecast, by Type, 2016–2026
Table 9: North America Agriculture Drones Market Size (US$ Mn) Forecast, by Application, 2016–2026
Table 10: North America Agriculture Drones Market Volume (Thousand Units) Forecast, by Application, 2016–2026
Table 11: North America Agriculture Drones Market Size (US$ Mn) Forecast, by Country, 2016–2026
Table 12: North America Agriculture Drones Market Volume (US$ Mn) Forecast, by Country, 2016–2026
Table 13: Europe Agriculture Drones Market Size (US$ Mn) Forecast, by Type, 2016–2026
Table 14: Europe Agriculture Drones Market Volume (Thousand Units) Forecast, by Type, 2016–2026
Table 15: Europe Agriculture Drones Market Size (US$ Mn) Forecast, by Application, 2016–2026
Table 16: Europe Agriculture Drones Market Volume (Thousand Units) Forecast, by Application, 2016–2026
Table 17: Europe Agriculture Drones Market Size (US$ Mn) Forecast, by Country, 2016–2026
Table 18: Europe Agriculture Drones Market Volume (Thousand Units) Forecast, by Country, 2016–2026
Table 19: Asia-Pacific Agriculture Drones Market Size (US$ Mn) Forecast, by Type, 2016–2026
Table 20: Asia-Pacific Agriculture Drones Market Volume (Thousand Units) Forecast, by Type, 2016–2026
Table 21; Asia-Pacific Agriculture Drones Market Size (USD Mn) Forecast, by Application, 2016–2026
Table 22: Asia-Pacific Agriculture Drones Market Volume (Thousand Units) Forecast, by Application, 2016–2026
Table 23: North America Agriculture Drones Market Size (US$ Mn) Forecast, by Country, 2016–2026
Table 24: North America Agriculture Drones Market Volume (US$ Mn) Forecast, by Country, 2016–2026
Table 25: Middle East and Africa Agriculture Drones Market Size (US$ Mn) Forecast, by Type, 2016 – 2026
Table 26: Middle East and Africa Agriculture Drones Market Size (Thousand Units) Forecast, by Type, 2016–2026
Table 27: Middle East and Africa Agriculture Drones Market Size (US$ Mn) Forecast, by Application, 2016 – 2026
Table 28: Middle East and Africa Agriculture Drones Market Size (US$ Thousand Units) Forecast, by Application, 2016–2026
Table 29: Middle East and Africa Agriculture Drones Market Size (US$ Thousand Units) Forecast, by Country, 2016–2026
Table 30: South America Agriculture Drones Market Size (US$ Mn) Forecast, by Type, 2016 – 2026
Table 31: South America Agriculture Drones Market Size (Thousand Units) Forecast, by Type, 2016 – 2026
Table 32: South America Agriculture Drones Market Size (US$ Mn) Forecast, by Application, 2016 – 2026
Table 33: South America Agriculture Drones Market Size (Thousand Units) Forecast, by Application, 2016 – 2026
Table 34: South America Agriculture Drones Market Size (US$ Mn) Forecast, by Country, 2016 – 2026
Table 35: Parrot S.A - Key Financial Indicators, 2015- 2016
Table 36: Aerovironment Inc- Key Financial Indicators, 2015- 2016
Table 37: Yamaha Corporation- Key Financial Indicators, 2015- 2016
List of Figures
Figure 1: Market Revenue Projections, 2016 - 2026 (US$ Mn)
Figure 2: Market Revenue Y-O-Y (%) 2017 - 2026
Figure 3: Market Value Share, by Application (2017)
Figure 4: Market Value Share, by Region (2017)
Figure 5: Market Value Share, by Type (2017)
Figure 6: Global Agriculture Drones Market Value Share Analysis, By Type, 2017 and 2026
Figure 7: Global Agriculture Drones Market Volume Share Analysis, By Type, 2017 and 2026
Figure 8: Global Agriculture Drones Matrix
Figure 9: Global Agriculture Drones Market Attractiveness Analysis, By Type
Figure 10: Global Agriculture Drones Market Value Share Analysis, By Application, 2017 and 2026
Figure 11: Agriculture Drones Matrix
Figure 12: Agriculture Drones Market Attractiveness Analysis, By Application
Figure 13: Global Agriculture Drones Market Value Share Analysis, by Region, 2017 and 2026
Figure 14: Agriculture Drones Market- Market Attractiveness Analysis, by Region
Figure: 15 North America Agriculture Drones Market Revenue (US$ Mn) and Y-o-Y Forecast, 2016– 2026
Figure 16: North America Agriculture Drones Market Volume (Thousand Units) and Y-o-Y Forecast, 2016–2026
Figure 17: North America Agriculture Drones Market Value Share Analysis, By Type, 2017 and 2026
Figure 18: North America Agriculture Drones Market Value Share Analysis, By Application, 2017 and 2026
Figure 19: North America Agriculture Drones Market Value Share Analysis, By Country, 2017 and 2026
Figure 20: North America Agriculture Drones Market Attractiveness Analysis, By Type
Figure 21: North America Agriculture Drones Market Attractiveness Analysis, By Application
Figure 22: North America Agriculture Drones Market Attractiveness Analysis, By Country
Figure 23: Europe Agriculture Drones Market Revenue (US$ Mn) and Y-o-Y Forecast, 2016–2026
Figure 24: Europe Agriculture Drones Market Volume (Thousand Units) and Y-o-Y Forecast, 2016–2026
Figure 25: Europe Agriculture Drones Market Value Share Analysis, By Type, 2017 and 2026
Figure 26: Europe Agriculture Drones Market Value Share Analysis, By Application, 2017 and 2026
Figure 27: Europe Agriculture Drones Market Value Share Analysis, By Country, 2017 and 2026
Figure 28: Europe Agriculture Drones Market Attractiveness Analysis, By Type
Figure 29: Europe Agriculture Drones Market Attractiveness Analysis, By Application
Figure 30: Europe Agriculture Drones Market Attractiveness Analysis, By Country
Figure 31: Asia-Pacific Agriculture Drones Market Revenue (US$ Mn) and Y-o-Y Forecast, 2016–2026
Figure 32: Asia-Pacific Agriculture Drones Market Volume (Thousand Units) and Y-o-Y Forecast, 2016–2026
Figure 33: Asia-Pacific Agriculture Drones Market Value Share Analysis, By Type, 2017 and 2026
Figure 34: Asia-Pacific Agriculture Drones Market Value Share Analysis, By Application, 2017 and 2026
Figure 35: Asia-Pacific Agriculture Drones Market Value Share Analysis, By Country, 2017 and 2026
Figure 36: Asia-Pacific Agriculture Drones Market Attractiveness Analysis, By Type
Figure 37: Asia-Pacific Agriculture Drones Market Attractiveness Analysis, By Application
Figure 38: Asia-Pacific Agriculture Drones Market Attractiveness Analysis, By Country
Figure 39: Middle East and Africa Agriculture Drones Market Revenue (US$ Mn) and Y-o-Y Forecast, 2017– 2026
Figure 40: Middle East and Africa Agriculture Drones Market Revenue (Mn Units) and Y-o-Y Forecast, 2017– 2026
Figure 41: Middle East and Africa Agriculture Drones Market Value Share Analysis, By Type, 2017 and 2026
Figure 42: Middle East and Africa Agriculture Drones Market Value Share Analysis, By Application, 2017 and 2026
Figure 43: Middle East and Africa Agriculture Drones Market Value Share Analysis, By Country, 2017 and 2026
Figure 44: Middle East and Africa Agriculture Drones Market Attractiveness Analysis, By Type
Figure 45: Middle East and Africa Agriculture Drones Market Attractiveness Analysis, By Application
Figure 46: Middle East and Africa Agriculture Drones Market Attractiveness Analysis, By Country
Figure 47: South America Agriculture Drones Market Revenue (US$ Mn) and Y-o-Y Forecast, 2016– 2026
Figure 48: South America Agriculture Drones Market Revenue (Thousand Units) and Y-o-Y Forecast, 2017– 2026
Figure 49: South America Agriculture Drones Market Value Share Analysis, By Type, 2017 and 2026
Figure 50: South America Agriculture Drones Market Value Share Analysis, By Application, 2017 and 2026
Figure 51: South America Agriculture Drones Market Value Share Analysis, By Country, 2017 and 2026
Figure 52: South America Agriculture Drones Market Attractiveness Analysis, By Type
Figure 53: South America Agriculture Drones Market Attractiveness Analysis, By Application
Figure 54: South America Agriculture Drones Market Attractiveness Analysis, By Country
Figure 55: Global Agriculture Drones Market Share Analysis (2017)
Figure 56: Competition Matrix
Figure 57: Delair Tech SAS- Net Sales, by Region, 2016
Figure 58: Delair Tech SAS- Revenue (USD Mn) & Y-o-Y Growth (%), 2014-2016
Figure 59: Parrot S.A - Revenue (USD Mn) & Y-o-Y Growth (%), 2014–2016
Figure 60: Parrot S.A -Breakdown of Net Sales, by Geography, 2016 (%)
Figure 61: Aerovironment Inc. - Revenue (USD Mn) & Y-o-Y Growth (%), 2014–2016
Figure 62: Yamaha Corporation- Revenue (USD Mn) & Y-o-Y Growth (%), 2014–2016
Figure 63: Yamaha Corporation- Breakdown of Net Sales, by Geography, 2016 (%)
Copyright © Transparency Market Research, Inc. All Rights reserved
Trust Online

Agriculture Drone Market Forecast Report, 2018 - 2026