
Reports
Reports
Analysts’ Viewpoint on Agricultural Films Market Scenario
Increase in demand for agricultural films in farming applications has augmented the agricultural films market. Agricultural films help preserve nutrients present in the soil by maintaining the moisture content. They also help minimize the adverse effect of weeds on the soil. Agricultural films ensure higher yield along with the utilization of the harvest. Hence, they are used in modern farming in order to enhance output. Companies operating in the agricultural films market are focusing on developing low-cost agricultural films such as nano-greenhouse films. These films are highly compatible for usage in remote areas, and do not require electricity. Rise in demand for organic food grains, fruits, and vegetables due to the increase in health awareness among the people is driving the agricultural films market.
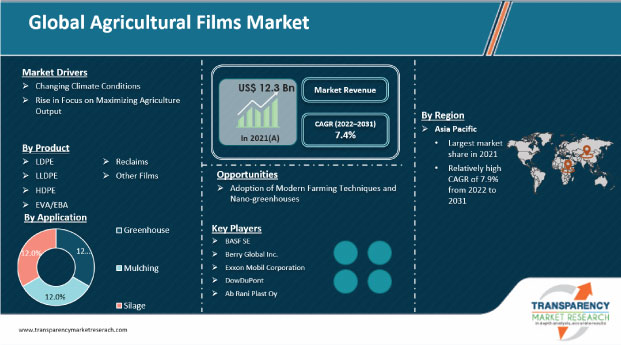
The usage of agricultural plastic films has revolutionized farming and society in general. Plastic films for agricultural applications have also made it possible to convert barren land into productive farmland. Agricultural films are made of LDPE, LLDPE, HDPE, EVA/EBA, reclaims, and others films. The agricultural films market is significantly driven by the steady evolution of farming and the greenhouse industry. Increase in adoption of greenhouses to enhance yield and recent developments in the agricultural films market are anticipated to boost the demand for agricultural films during the forecast period. Rise in usage of farm films, agricultural plastic mulch, or agricultural mulch films is creating value-grab opportunities for agricultural film manufacturers.
Healthy, sustainable, and inclusive food systems are critical to achieving the world’s development goals. Agricultural development is one of the most powerful tools to feed a projected 9.7 billion people by 2050. Agricultural films are used to increase farm production. Greenhouse is the most effective way to protect the harvest from wind and rain, as well as internal temperature. This helps prevent appreciable temperature changes in the greenhouse during day and night. Demand for food items such as crops, fruits, and vegetables has been increasing due to the rise in the global population. Hence, countries across the globe are focusing on maximizing agriculture output.
Agricultural films are used to provide a desirable climate, enhance soil nutrients, and maintain the value of nutrients. Usage of mulching, greenhouses, and silage bags increases the agriculture production rate by 20% to 35%. Countries across the globe are shifting their focus on expansion of the agriculture output. This is anticipated to propel the agricultural films market during the forecast period. Every manufacturing process that produces agricultural film products needs to assess the benefits of bio-degradable plastic films. Thus, bio-degradable plastic caters to the production demands of the agricultural industry.
Agricultural films are widely used to help maintain particular climatic conditions for crops, fruits, and vegetables. Global warming adversely affects agriculture. This is driving the demand for artificial climate control techniques. Greenhouse films provide the desirable climate for farming, while silage bags help maintain the value of nutrients. Thus, increase in demand for food across the globe is boosting the agricultural films market. Unrestricted rise in greenhouse gas emissions is driving the Earth’s temperature. The consequences include increasingly extreme weather conditions. Rapid pace of climate change combined with global population and income growth threatens food security everywhere. Agriculture is vulnerable to climate change. The higher temperature eventually yields desirable crops while encouraging weed and pest proliferation. Agricultural films are used to protect the harvest in odd conditions. This is further boosting the agricultural films market.
Based on product, the LLDPE segment dominated the global agricultural films market with nearly 61.3% share in 2021. Furthermore, the segment is expected to grow at a CAGR of 7.5% during the forecast period. Linear low-density polyethylene (LLDPE) is a linear polyethylene that is commonly made of copolymerization of ethylene with longer-chain olefins such as propene and butene. LLDPE has higher tensile strength and higher puncture resistance than LDPE. It is flexible and stretches under stress. It can be employed to make thinner films, with better environmental stress and good resistance to chemicals. LLDPE is a key product employed in the production of agricultural films such as greenhouse, mulch, and silage films. Hence, LLDPE is the largest revenue generator product in the agricultural films market.
In terms of volume, Asia Pacific holds major share of the global agricultural films market. Rise in population and presence of countries with agriculture-based economies are key factors driving the demand for agricultural films in the region. Growth in agriculture and horticulture has boosted the demand for agricultural films in Asia Pacific. In terms of value, Asia Pacific held 49.3% share of the global agricultural films market in 2021. The agricultural films market in the region is anticipated to grow at a CAGR of nearly 7.9% in terms of value during the forecast period. Europe is the fastest growing market for agricultural films. In terms of value, Europe and North America were also prominent regions of the global agricultural films market and held 28.5% and 12.2% share, respectively, in 2021.
The global agricultural films market comprises several small and large-scale manufacturers and suppliers who control majority of the share. Most of the firms are adopting new technologies and strategies with comprehensive research and development, primarily to increase flexibility and manufacturing operations. Expansion of product portfolio and mergers & acquisitions are major strategies adopted by key players. BASF SE, Berry Global Inc., Exxon Mobil Corporation, DowDuPont, Ab Rani Plast Oy, RPC Group PLC., NOVAMONT S.P.A., RKW Group, AGRIPOLYANE, and Trioplast Industrier AB are prominent entities operating in the market.
Each of these players has been profiled in the global agricultural films market report based on parameters such as company overview, financial overview, business strategies, product portfolio, business segments, and recent developments.
|
Attribute |
Detail |
|
Market Size Value in 2021 |
US$ 12.3 Bn |
|
Market Forecast Value in 2031 |
US$ 25.1 Bn |
|
Growth Rate (CAGR) |
7.4% |
|
Forecast Period |
2022–2031 |
|
Historical Data Available for |
2020 |
|
Quantitative Units |
US$ Bn for Value and Kilo Tons for Volume |
|
Market Analysis |
It includes cross-segment analysis at the global as well as country levels. Furthermore, the qualitative analysis includes drivers, restraints, opportunities, key trends, Porter’s Five Forces analysis, value chain analysis, and key trend analysis. |
|
Competition Landscape |
|
|
Format |
Electronic (PDF) + Excel |
|
Market Segmentation |
|
|
Regions Covered |
|
|
Countries Covered |
|
|
Companies Profiled |
|
|
Customization Scope |
Available upon request |
|
Pricing |
Available upon request |
The agricultural films market stood at US$ 12.3 Bn in 2021
The agricultural films market is expected to grow at a CAGR of 7.4% from 2022 to 2031
Rise in focus on maximizing agriculture output and changing climate conditions are projected to boost the agricultural films market
LLDPE was the largest segment that held 61.3% share of the market in 2021
Asia Pacific was the most lucrative region of the agricultural films market in 2021
BASF SE, Berry Global Inc., Exxon Mobil Corporation, Dow DuPont, Ab Rani Plast Oy, RPC Group PLC, NOVAMONT S.P.A, RKW Group, AGRIPOLYANE, and Trioplast Industrier AB
1. Executive Summary
1.1. Agricultural Films Snapshot
1.2. Current Market and Future Potential
2. Market Overview
2.1. Market Segmentation
2.2. Market Trends
2.3. Market Dynamics
2.3.1. Drivers
2.3.2. Restraints
2.3.3. Opportunities
2.4. Porter’s Five Forces Analysis
2.5. Regulatory Analysis
2.6. Value Chain Analysis
2.6.1. List of Raw Material Providers
2.6.2. List of Key Manufacturers
2.6.3. List of Suppliers/ Distributors
2.6.4. List of Potential Customers
2.6.5. Production Overview/ Route of Synthesis
3. COVID-19 Impact Analysis
4. Production Output Analysis, 2022
5. Price Trend Analysis
6. Global Agricultural Films Analysis and Forecast, by Product, 2020–2031
6.1. Introduction and Definitions
6.2. Global Agricultural Films Volume (Kilo Tons) and Value (US$ Bn) Forecast, by Product, 2020–2031
6.2.1. LDPE
6.2.2. LLDPE
6.2.3. HDPE
6.2.4. EVA/EBA
6.2.5. Reclaims
6.2.6. Others Films
6.3. Global Agricultural Films Attractiveness, by Product
7. Global Agricultural Films Analysis and Forecast, by Application, 2020–2031
7.1. Introduction and Definitions
7.2. Global Agricultural Films Volume (Kilo Tons) and Value (US$ Bn) Forecast, by Application, 2020–2031
7.2.1. Greenhouse
7.2.2. Mulching
7.2.3. Silage
7.3. Global Agricultural Films Attractiveness, by Application
8. Global Agricultural Films Analysis and Forecast, by Region, 2020–2031
8.1. Key Findings
8.2. Global Agricultural Films Volume (Kilo Tons) and Value (US$ Bn) Forecast, by Region, 2020–2031
8.2.1. North America
8.2.2. Europe
8.2.3. Asia Pacific
8.2.4. Middle East & Africa
8.2.5. Latin America
8.3. Global Agricultural Films Attractiveness, by Region
9. North America Agricultural Films Analysis and Forecast, 2020–2031
9.1. Key Findings
9.2. North America Agricultural Films Volume (Kilo Tons) and Value (US$ Bn) Forecast, by Product, 2020–2031
9.3. North America Agricultural Films Volume (Kilo Tons) and Value (US$ Bn) Forecast, by Application, 2020–2031
9.4. North America Agricultural Films Volume (Kilo Tons) and Value (US$ Bn) Forecast, by Country, 2020–2031
9.4.1. U.S. Agricultural Films Volume (Kilo Tons) and Value (US$ Bn) Forecast, by Product, 2020–2031
9.4.2. U.S. Agricultural Films Volume (Kilo Tons) and Value (US$ Bn) Forecast, by Application, 2020–2031
9.4.3. Canada Agricultural Films Volume (Kilo Tons) and Value (US$ Bn) Forecast, by Product, 2020–2031
9.4.4. Canada Agricultural Films Volume (Kilo Tons) and Value (US$ Bn) Forecast, by Application, 2020–2031
9.5. North America Agricultural Films Attractiveness Analysis
10. Europe Agricultural Films Analysis and Forecast, 2020–2031
10.1. Key Findings
10.2. Europe Agricultural Films Volume (Kilo Tons) and Value (US$ Bn) Forecast, by Product, 2020–2031
10.3. Europe Agricultural Films Volume (Kilo Tons) and Value (US$ Bn) Forecast, by Application, 2020–2031
10.4. Europe Agricultural Films Volume (Kilo Tons) and Value (US$ Bn) Forecast, by Country and Sub-region, 2020‒2031
10.4.1. Germany Agricultural Films Volume (Kilo Tons) and Value (US$ Bn) Forecast, by Product, 2020–2031
10.4.2. Germany Agricultural Films Volume (Kilo Tons) and Value (US$ Bn) Forecast, by Application, 2020–2031
10.4.3. France Agricultural Films Volume (Kilo Tons) and Value (US$ Bn) Forecast, by Product, 2020–2031
10.4.4. France Agricultural Films Volume (Kilo Tons) and Value (US$ Bn) Forecast, by Application, 2020–2031
10.4.5. U.K. Agricultural Films Volume (Kilo Tons) and Value (US$ Bn) Forecast, by Product, 2020–2031
10.4.6. U.K. Agricultural Films Volume (Kilo Tons) and Value (US$ Bn) Forecast, by Application, 2020–2031
10.4.7. Italy. Agricultural Films Volume (Kilo Tons) and Value (US$ Bn) Forecast, by Product, 2020–2031
10.4.8. Italy Agricultural Films Volume (Kilo Tons) and Value (US$ Bn) Forecast, by Application, 2020–2031
10.4.9. Russia & CIS Agricultural Films Volume (Kilo Tons) and Value (US$ Bn) Forecast, by Product, 2020–2031
10.4.10. Russia & CIS Agricultural Films Volume (Kilo Tons) and Value (US$ Bn) Forecast, by Application, 2020–2031
10.4.11. Rest of Europe Agricultural Films Volume (Kilo Tons) and Value (US$ Bn) Forecast, by Product, 2020–2031
10.4.12. Rest of Europe Agricultural Films Volume (Kilo Tons) and Value (US$ Bn) Forecast, by Application, 2020–2031
10.5. Europe Agricultural Films Attractiveness Analysis
11. Asia Pacific Agricultural Films Analysis and Forecast, 2020–2031
11.1. Key Findings
11.2. Asia Pacific Agricultural Films Volume (Kilo Tons) and Value (US$ Bn) Forecast, by Product
11.3. Asia Pacific Agricultural Films Volume (Kilo Tons) and Value (US$ Bn) Forecast, by Application, 2020–2031
11.4. Asia Pacific Agricultural Films Volume (Kilo Tons) and Value (US$ Bn) Forecast, by Country and Sub-region, 2020‒2031
11.4.1. China Agricultural Films Volume (Kilo Tons) and Value (US$ Bn) Forecast, by Product, 2020–2031
11.4.2. China Agricultural Films Volume (Kilo Tons) and Value (US$ Bn) Forecast, by Application, 2020–2031
11.4.3. Japan Agricultural Films Volume (Kilo Tons) and Value (US$ Bn) Forecast, by Product, 2020–2031
11.4.4. Japan Agricultural Films Volume (Kilo Tons) and Value (US$ Bn) Forecast, by Application, 2020–2031
11.4.5. India Agricultural Films Volume (Kilo Tons) and Value (US$ Bn) Forecast, by Product, 2020–2031
11.4.6. India Agricultural Films Volume (Kilo Tons) and Value (US$ Bn) Forecast, by Application, 2020–2031
11.4.7. ASEAN Agricultural Films Volume (Kilo Tons) and Value (US$ Bn) Forecast, by Product, 2020–2031
11.4.8. ASEAN Agricultural Films Volume (Kilo Tons) and Value (US$ Bn) Forecast, by Application, 2020–2031
11.4.9. Rest of Asia Pacific Agricultural Films Volume (Kilo Tons) and Value (US$ Bn) Forecast, by Product, 2020–2031
11.4.10. Rest of Asia Pacific Agricultural Films Volume (Kilo Tons) and Value (US$ Bn) Forecast, by Application, 2020–2031
11.5. Asia Pacific Agricultural Films Attractiveness Analysis
12. Latin America Agricultural Films Analysis and Forecast, 2020–2031
12.1. Key Findings
12.2. Latin America Agricultural Films Volume (Kilo Tons) and Value (US$ Bn) Forecast, by Product, 2020–2031
12.3. Latin America Agricultural Films Volume (Kilo Tons) and Value (US$ Bn) Forecast, by Application, 2020–2031
12.4. Latin America Agricultural Films Volume (Kilo Tons) and Value (US$ Bn) Forecast, by Country and Sub-region, 2020‒2031
12.4.1. Brazil Agricultural Films Volume (Kilo Tons) and Value (US$ Bn) Forecast, by Product, 2020–2031
12.4.2. Brazil Agricultural Films Volume (Kilo Tons) and Value (US$ Bn) Forecast, by Application, 2020–2031
12.4.3. Mexico Agricultural Films Volume (Kilo Tons) and Value (US$ Bn) Forecast, by Product, 2020–2031
12.4.4. Mexico Agricultural Films Volume (Kilo Tons) and Value (US$ Bn) Forecast, by Application, 2020–2031
12.4.5. Rest of Latin America Agricultural Films Volume (Kilo Tons) and Value (US$ Bn) Forecast, by Product, 2020–2031
12.4.6. Rest of Latin America Agricultural Films Volume (Kilo Tons) and Value (US$ Bn) Forecast, by Application, 2020–2031
12.5. Latin America Agricultural Films Attractiveness Analysis
13. Middle East & Africa Agricultural Films Analysis and Forecast, 2020–2031
13.1. Key Findings
13.2. Middle East & Africa Agricultural Films Volume (Kilo Tons) and Value (US$ Bn) Forecast, by Product, 2020–2031
13.3. Middle East & Africa Agricultural Films Volume (Kilo Tons) and Value (US$ Bn) Forecast, by Application, 2020–2031
13.4. Middle East & Africa Agricultural Films Volume (Kilo Tons) and Value (US$ Bn) Forecast, by Country and Sub-region, 2020‒2031
13.4.1. GCC Agricultural Films Volume (Kilo Tons) and Value (US$ Bn) Forecast, by Product, 2020–2031
13.4.2. GCC Agricultural Films Volume (Kilo Tons) and Value (US$ Bn) Forecast, by Application, 2020–2031
13.4.3. South Africa Agricultural Films Volume (Kilo Tons) and Value (US$ Bn) Forecast, by Product, 2020–2031
13.4.4. South Africa Agricultural Films Volume (Kilo Tons) and Value (US$ Bn) Forecast, by Application, 2020–2031
13.4.5. Rest of Middle East & Africa Agricultural Films Volume (Kilo Tons) and Value (US$ Bn) Forecast, by Product, 2020–2031
13.4.6. Rest of Middle East & Africa Agricultural Films Volume (Kilo Tons) and Value (US$ Bn) Forecast, by Application, 2020–2031
13.5. Middle East & Africa Agricultural Films Attractiveness Analysis
14. Competition Landscape
14.1. Global Enzymes Company Market Share Analysis, 2022
14.2. Company Profiles (Details – Overview, Financials, Recent Developments, and Strategy)
14.2.1. BASF SE
14.2.1.1. Company Description
14.2.1.2. Business Overview
14.2.1.3. Financial Overview
14.2.1.4. Strategic Overview
14.2.2. Berry Global Inc
14.2.2.1. Company Description
14.2.2.2. Business Overview
14.2.2.3. Financial Overview
14.2.2.4. Strategic Overview
14.2.3. Exxon Mobil Corporation
14.2.3.1. Company Description
14.2.3.2. Business Overview
14.2.3.3. Financial Overview
14.2.3.4. Strategic Overview
14.2.4. AB Enzymes GmbH
14.2.4.1. Company Description
14.2.4.2. Business Overview
14.2.4.3. Financial Overview
14.2.4.4. Strategic Overview
14.2.5. DowDuPont
14.2.5.1. Company Description
14.2.5.2. Business Overview
14.2.5.3. Financial Overview
14.2.5.4. Strategic Overview
14.2.6. Ab Rani Plast Oy
14.2.6.1. Company Description
14.2.6.2. Business Overview
14.2.6.3. Financial Overview
14.2.6.4. Strategic Overview
14.2.7. RPC Group PLC.
14.2.7.1. Company Description
14.2.7.2. Business Overview
14.2.7.3. Financial Overview
14.2.7.4. Strategic Overview
14.2.8. NOVAMONT S.P.A
14.2.8.1. Company Description
14.2.8.2. Business Overview
14.2.8.3. Financial Overview
14.2.8.4. Strategic Overview
14.2.9. Advanced Enzyme Technologies Limited
14.2.9.1. Company Description
14.2.9.2. Business Overview
14.2.9.3. Financial Overview
14.2.9.4. Strategic Overview
14.2.10. RKW Group
14.2.10.1. Company Description
14.2.10.2. Business Overview
14.2.10.3. Financial Overview
14.2.10.4. Strategic Overview
14.2.11. AGRIPOLYANE
14.2.11.1. Company Description
14.2.11.2. Business Overview
14.2.11.3. Financial Overview
14.2.11.4. Strategic Overview
14.2.12. Trioplast Industrier AB
14.2.12.1. Business Overview
14.2.12.2. Financial Overview
14.2.12.3. Strategic Overview
14.2.13. POLIFILM GROUP
14.2.13.1. Company Description
14.2.13.2. Business Overview
14.2.13.3. Financial Overview
14.2.13.4. Strategic Overview
14.2.14. Others
15. Primary Research: Key Insights
16. Appendix
List of Tables
Table 1: Global Agricultural Films Volume (Kilo Tons) Forecast, by Product, 2020–2031
Table 2: Global Agricultural Films Value (US$ Bn) Forecast, by Product, 2020–2031
Table 3: Global Agricultural Films Volume (Kilo Tons) Forecast, by Application, 2020–2031
Table 4: Global Agricultural Films Value (US$ Bn) Forecast, by Application, 2020–2031
Table 5: Global Agricultural Films Volume (Kilo Tons) Forecast, by Region, 2020–2031
Table 6: Global Agricultural Films Value (US$ Bn) Forecast, by Region, 2020–2031
Table 7: North America Agricultural Films Volume (Kilo Tons) Forecast, by Product, 2020–2031
Table 8: North America Agricultural Films Value (US$ Bn) Forecast, by Product, 2020–2031
Table 9: North America Agricultural Films Volume (Kilo Tons) Forecast, by Application, 2020–2031
Table 10: North America Agricultural Films Value (US$ Bn) Forecast, by Application, 2020–2031
Table 11: North America Agricultural Films Volume (Kilo Tons) Forecast, by Country, 2020–2031
Table 12: North America Agricultural Films Value (US$ Bn) Forecast, by Country, 2020–2031
Table 13: U.S. Agricultural Films Volume (Kilo Tons) Forecast, by Product, 2020–2031
Table 14: U.S. Agricultural Films Value (US$ Bn) Forecast, by Product, 2020–2031
Table 15: U.S. Agricultural Films Volume (Kilo Tons) Forecast, by Application, 2020–2031
Table 16: U.S. Agricultural Films Value (US$ Bn) Forecast, by Application, 2020–2031
Table 17: Canada Agricultural Films Volume (Kilo Tons) Forecast, by Product, 2020–2031
Table 18: Canada Agricultural Films Value (US$ Bn) Forecast, by Product, 2020–2031
Table 19: Canada Agricultural Films Volume (Kilo Tons) Forecast, by Application, 2020–2031
Table 20: Canada Agricultural Films Value (US$ Bn) Forecast, by Application, 2020–2031
Table 21: Europe Agricultural Films Volume (Kilo Tons) Forecast, by Product, 2020–2031
Table 22: Europe Agricultural Films Value (US$ Bn) Forecast, by Product, 2020–2031
Table 23: Europe Agricultural Films Volume (Kilo Tons) Forecast, by Application, 2020–2031
Table 24: Europe Agricultural Films Value (US$ Bn) Forecast, by Application, 2020–2031
Table 25: Europe Agricultural Films Volume (Kilo Tons) Forecast, by Country and Sub-region, 2020–2031
Table 26: Europe Agricultural Films Value (US$ Bn) Forecast, by Country and Sub-region, 2020–2031
Table 27: Germany Agricultural Films Volume (Kilo Tons) Forecast, by Product, 2020–2031
Table 28: Germany Agricultural Films Value (US$ Bn) Forecast, by Product, 2020–2031
Table 29: Germany Agricultural Films Volume (Kilo Tons) Forecast, by Application, 2020–2031
Table 30: Germany Agricultural Films Value (US$ Bn) Forecast, by Application, 2020–2031
Table 31: France Agricultural Films Volume (Kilo Tons) Forecast, by Product, 2020–2031
Table 32: France Agricultural Films Value (US$ Bn) Forecast, by Product, 2020–2031
Table 33: France Agricultural Films Volume (Kilo Tons) Forecast, by Application, 2020–2031
Table 34: France Agricultural Films Value (US$ Bn) Forecast, by Application, 2020–2031
Table 35: U.K. Agricultural Films Volume (Kilo Tons) Forecast, by Product, 2020–2031
Table 36: U.K. Agricultural Films Value (US$ Bn) Forecast, by Product, 2020–2031
Table 37: U.K. Agricultural Films Volume (Kilo Tons) Forecast, by Application, 2020–2031
Table 38: U.K. Agricultural Films Value (US$ Bn) Forecast, by Application, 2020–2031
Table 39: Italy Agricultural Films Volume (Kilo Tons) Forecast, by Product, 2020–2031
Table 40: Italy Agricultural Films Value (US$ Bn) Forecast, by Product, 2020–2031
Table 41: Italy Agricultural Films Volume (Kilo Tons) Forecast, by Application, 2020–2031
Table 42: Italy Agricultural Films Value (US$ Bn) Forecast, by Application, 2020–2031
Table 43: Spain Agricultural Films Volume (Kilo Tons) Forecast, by Product, 2020–2031
Table 44: Spain Agricultural Films Value (US$ Bn) Forecast, by Product, 2020–2031
Table 45: Spain Agricultural Films Volume (Kilo Tons) Forecast, by Application, 2020–2031
Table 46: Spain Agricultural Films Value (US$ Bn) Forecast, by Application, 2020–2031
Table 47: Russia & CIS Agricultural Films Volume (Kilo Tons) Forecast, by Product, 2020–2031
Table 48: Russia & CIS Agricultural Films Value (US$ Bn) Forecast, by Product, 2020–2031
Table 49: Russia & CIS Agricultural Films Volume (Kilo Tons) Forecast, by Application, 2020–2031
Table 50: Russia & CIS Agricultural Films Value (US$ Bn) Forecast, by Application, 2020–2031
Table 51: Rest of Europe Agricultural Films Volume (Kilo Tons) Forecast, by Product, 2020–2031
Table 52: Rest of Europe Agricultural Films Value (US$ Bn) Forecast, by Product, 2020–2031
Table 53: Rest of Europe Agricultural Films Volume (Kilo Tons) Forecast, by Product, 2020–2031
Table 54: Rest of Europe Agricultural Films Value (US$ Bn) Forecast, by Product, 2020–2031
Table 55: Rest of Europe Agricultural Films Volume (Kilo Tons) Forecast, by Application, 2020–2031
Table 56: Rest of Europe Agricultural Films Value (US$ Bn) Forecast, by Application, 2020–2031
Table 57: Asia Pacific Agricultural Films Value (US$ Bn) Forecast, by Product, 2020–2031
Table 58: Asia Pacific Agricultural Films Volume (Kilo Tons) Forecast, by Application, 2020–2031
Table 59: Asia Pacific Agricultural Films Value (US$ Bn) Forecast, by Application, 2020–2031
Table 60: Asia Pacific Agricultural Films Volume (Kilo Tons) Forecast, by Country and Sub-region, 2020–2031
Table 61: Asia Pacific Agricultural Films Value (US$ Bn) Forecast, by Country and Sub-region, 2020–2031
Table 62: China Agricultural Films Volume (Kilo Tons) Forecast, by Product, 2020–2031
Table 63: China Agricultural Films Value (US$ Bn) Forecast, by Product, 2020–2031
Table 64: China Agricultural Films Volume (Kilo Tons) Forecast, by Application, 2020–2031
Table 65: China Agricultural Films Value (US$ Bn) Forecast, by Application, 2020–2031
Table 66: Japan Agricultural Films Volume (Kilo Tons) Forecast, by Product, 2020–2031
Table 67: Japan Agricultural Films Value (US$ Bn) Forecast, by Product, 2020–2031
Table 68: Japan Agricultural Films Volume (Kilo Tons) Forecast, by Application, 2020–2031
Table 69: Japan Agricultural Films Value (US$ Bn) Forecast, by Application, 2020–2031
Table 70: India Agricultural Films Volume (Kilo Tons) Forecast, by Product, 2020–2031
Table 71: India Agricultural Films Value (US$ Bn) Forecast, by Product, 2020–2031
Table 72: India Agricultural Films Volume (Kilo Tons) Forecast, by Application, 2020–2031
Table 73: India Agricultural Films Value (US$ Bn) Forecast, by Application, 2020–2031
Table 74: India Agricultural Films Volume (Kilo Tons) Forecast, by Application, 2020–2031
Table 75: India Agricultural Films Value (US$ Bn) Forecast, by Application 2020–2031
Table 76: ASEAN Agricultural Films Volume (Kilo Tons) Forecast, by Product, 2020–2031
Table 77: ASEAN Agricultural Films Value (US$ Bn) Forecast, by Product, 2020–2031
Table 78: ASEAN Agricultural Films Volume (Kilo Tons) Forecast, by Application, 2020–2031
Table 79: ASEAN Agricultural Films Value (US$ Bn) Forecast, by Application, 2020–2031
Table 80: Rest of Asia Pacific Agricultural Films Volume (Kilo Tons) Forecast, by Product, 2020–2031
Table 81: Rest of Asia Pacific Agricultural Films Value (US$ Bn) Forecast, by Product, 2020–2031
Table 82: Rest of Asia Pacific Agricultural Films Volume (Kilo Tons) Forecast, by Application, 2020–2031
Table 83: Rest of Asia Pacific Agricultural Films Value (US$ Bn) Forecast, by Application, 2020–2031
Table 84: Latin America Agricultural Films Volume (Kilo Tons) Forecast, by Product, 2020–2031
Table 85: Latin America Agricultural Films Value (US$ Bn) Forecast, by Product, 2020–2031
Table 86: Latin America Agricultural Films Volume (Kilo Tons) Forecast, by Application, 2020–2031
Table 87: Latin America Agricultural Films Value (US$ Bn) Forecast, by Application, 2020–2031
Table 88: Latin America Agricultural Films Volume (Kilo Tons) Forecast, by Country and Sub-region, 2020–2031
Table 89: Latin America Agricultural Films Value (US$ Bn) Forecast, by Country and Sub-region, 2020–2031
Table 90: Brazil Agricultural Films Volume (Kilo Tons) Forecast, by Product, 2020–2031
Table 91: Brazil Agricultural Films Value (US$ Bn) Forecast, by Product, 2020–2031
Table 92: Brazil Agricultural Films Volume (Kilo Tons) Forecast, by Application, 2020–2031
Table 93: Brazil Agricultural Films Value (US$ Bn) Forecast, by Application, 2020–2031
Table 94: Mexico Agricultural Films Volume (Kilo Tons) Forecast, by Product, 2020–2031
Table 95: Mexico Agricultural Films Value (US$ Bn) Forecast, by Product, 2020–2031
Table 96: Mexico Agricultural Films Volume (Kilo Tons) Forecast, by Application, 2020–2031
Table 97: Mexico Agricultural Films Value (US$ Bn) Forecast, by Application, 2020–2031
Table 98: Rest of Latin America Agricultural Films Volume (Kilo Tons) Forecast, by Product, 2020–2031
Table 99: Rest of Latin America Agricultural Films Value (US$ Bn) Forecast, by Product, 2020–2031
Table 100: Rest of Latin America Agricultural Films Volume (Kilo Tons) Forecast, by Application, 2020–2031
Table 101: Rest of Latin America Agricultural Films Value (US$ Bn) Forecast, by Application, 2020–2031
Table 102: Middle East & Africa Agricultural Films Volume (Kilo Tons) Forecast, by Product, 2020–2031
Table 103: Middle East & Africa Agricultural Films Value (US$ Bn) Forecast, by Product, 2020–2031
Table 104: Middle East & Africa Agricultural Films Volume (Kilo Tons) Forecast, by Application, 2020–2031
Table 105: Middle East & Africa Agricultural Films Value (US$ Bn) Forecast, by Application, 2020–2031
Table 106: Middle East & Africa Agricultural Films Volume (Kilo Tons) Forecast, by Country and Sub-region, 2020–2031
Table 107: Middle East & Africa Agricultural Films Value (US$ Bn) Forecast, by Country and Sub-region, 2020–2031
Table 108: GCC Agricultural Films Volume (Kilo Tons) Forecast, by Product, 2020–2031
Table 109: GCC Agricultural Films Value (US$ Bn) Forecast, by Product, 2020–2031
Table 110: GCC Agricultural Films Volume (Kilo Tons) Forecast, by Application, 2020–2031
Table 111: GCC Agricultural Films Value (US$ Bn) Forecast, by Application, 2020–2031
Table 112: South Africa Agricultural Films Volume (Kilo Tons) Forecast, by Product, 2020–2031
Table 113: South Africa Agricultural Films Value (US$ Bn) Forecast, by Product, 2020–2031
Table 114: South Africa Agricultural Films Volume (Kilo Tons) Forecast, by Application, 2020–2031
Table 115: South Africa Agricultural Films Value (US$ Bn) Forecast, by Application, 2020–2031
Table 116: Rest of Middle East & Africa Agricultural Films Volume (Kilo Tons) Forecast, by Product, 2020–2031
Table 117: Rest of Middle East & Africa Agricultural Films Value (US$ Bn) Forecast, by Product, 2020–2031
Table 118: Rest of Middle East & Africa Agricultural Films Volume (Kilo Tons) Forecast, by Application, 2020–2031
Table 119: Rest of Middle East & Africa Agricultural Films Value (US$ Bn) Forecast, by Application, 2020–2031
List of Figures
Figure 1: Global Agricultural Films Volume Share Analysis, by Product, 2022, 2025, and 2031
Figure 2: Global Agricultural Films Attractiveness, by Product
Figure 3: Global Agricultural Films Volume Share Analysis, by Application, 2022, 2025, and 2031
Figure 4: Global Agricultural Films Attractiveness, by Application
Figure 5: Global Agricultural Films Volume Share Analysis, by Region, 2022, 2025, and 2031
Figure 6: Global Agricultural Films Attractiveness, by Region
Figure 7: North America Agricultural Films Volume Share Analysis, by Product, 2022, 2025, and 2031
Figure 8: North America Agricultural Films Attractiveness, by Product
Figure 9: North America Agricultural Films Attractiveness, by Product
Figure 10: North America Agricultural Films Volume Share Analysis, by Application, 2022, 2025, and 2031
Figure 11: North America Agricultural Films Attractiveness, by Application
Figure 12: North America Agricultural Films Attractiveness, by Country
Figure 13: Europe Agricultural Films Volume Share Analysis, by Product, 2022, 2025, and 2031
Figure 14: Europe Agricultural Films Attractiveness, by Product
Figure 15: Europe Agricultural Films Volume Share Analysis, by Application, 2022, 2025, and 2031
Figure 16: Europe Agricultural Films Attractiveness, by Application
Figure 17: Europe Agricultural Films Volume Share Analysis, by Country and Sub-region, 2022, 2025, and 2031
Figure 18: Europe Agricultural Films Attractiveness, by Country and Sub-region
Figure 19: Asia Pacific Agricultural Films Volume Share Analysis, by Product, 2022, 2025, and 2031
Figure 20: Asia Pacific Agricultural Films Attractiveness, by Product
Figure 21: Asia Pacific Agricultural Films Volume Share Analysis, by Application, 2022, 2025, and 2031
Figure 22: Asia Pacific Agricultural Films Attractiveness, by Application
Figure 23: Asia Pacific Agricultural Films Volume Share Analysis, by Country and Sub-region, 2022, 2025, and 2031
Figure 24: Asia Pacific Agricultural Films Attractiveness, by Country and Sub-region
Figure 25: Latin America Agricultural Films Volume Share Analysis, by Product, 2022, 2025, and 2031
Figure 26: Latin America Agricultural Films Attractiveness, by Product
Figure 27: Latin America Agricultural Films Volume Share Analysis, by Application, 2022, 2025, and 2031
Figure 28: Latin America Agricultural Films Attractiveness, by Application
Figure 29: Latin America Agricultural Films Volume Share Analysis, by Country and Sub-region, 2022, 2025, and 2031
Figure 30: Latin America Agricultural Films Attractiveness, by Country and Sub-region
Figure 31: Middle East & Africa Agricultural Films Volume Share Analysis, by Product, 2022, 2025, and 2031
Figure 32: Middle East & Africa Agricultural Films Attractiveness, by Product
Figure 33: Middle East & Africa Agricultural Films Volume Share Analysis, by Application, 2022, 2025, and 2031
Figure 34: Middle East & Africa Agricultural Films Attractiveness, by Application
Figure 35: Middle East & Africa Agricultural Films Volume Share Analysis, by Country and Sub-region, 2022, 2025, and 2031
Figure 36: Middle East & Africa Agricultural Films Attractiveness, by Country and Sub-region
Copyright © Transparency Market Research, Inc. All Rights reserved
Trust Online

Agricultural Films Market