
Reports
Reports
The global market for touch screen displays has gained a significant momentum over the past few years, thanks to the technological advancements and the subsequent shift of consumers towards the newest technology. The leading manufacturers of touch screen displays across the world are increasingly adopting the latest technologies in order to enhance the customers’ experience.
Over the forthcoming years, the popularity of touch screen displays is likely to witness an upswing, thanks to the cost benefits and the ease of operation they offer. Owing to this, the worldwide touch screen display market is expected to be propelled substantially in the near future. However, the increasing prices of raw materials utilized for the production of touch screen displays are projected to hamper the market’s growth in the years to come.
The opportunity in the global market for touch screen displays, which was worth US$ 57.1 Bn in 2018, is projected to expand at a CAGR of 8.90% between 2019 and 2027 and attain a value of US$ 121.1 Bn by the end of 2027. In terms of shipment volume, the market is likely to progress at a CAGR of 10.70% during the same time period.
Gas pumps, retail kiosks, public transport kiosks, automated teller machines (ATMs), car wash centers, sports arenas, trade shows and exhibitions, parking terminals, and medical equipment are the main application areas of touch screen displays. Among these, the retail kiosks segment reports a higher demand for these displays than other application segments due to a large number of retail outlets all over the world.
As the number of retail outlets continues to increase, the demand for kiosks is also increasing significantly. Retailers are increasingly adopting advanced technologies in a bid to enhance customers’ engagement. As a result, retail kiosks are likely to remain the dominant application segment of touch screen displays over the next few years. The ATMs segment is also projected to register a strong presence in the years to come, thanks to the rising deployment of ATMs in emerging economies in Africa, South America, and Asia Pacific.
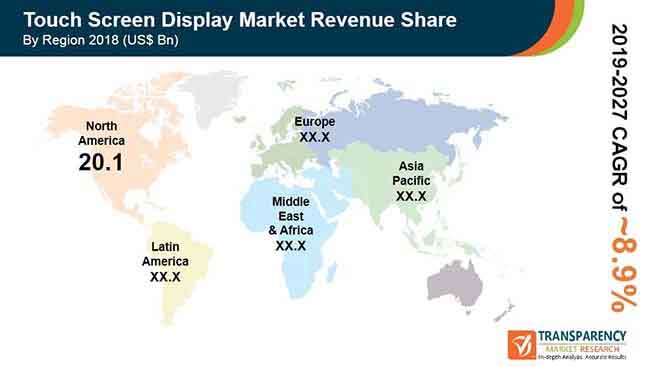
Geographically, the worldwide market for touch screen displays is spread across North America, South America, Europe, the Middle East and Africa, and Asia Pacific. With a share of 35.0%, North America led the global market in 2015 on the backdrop of technological developments and the high price of electronic equipment. As the region enjoys the presence of a large pool of established players, Researchers anticipate it to remain leading over the forthcoming years.
Other regions, such as South America, Asia Pacific, Europe, and the Middle East and Africa are also projected to witness increased demand for touch screen displays in the years to come, thanks to the rise in the deployment of touch screen retail kiosks and ATMs.
some of the leading players operating in the global touch screen display market.
Touchscreen displays are highly interactive optical touch technologies. The technology is extensive used in smart displays such as TV screens, kiosks, smartphones, and smart signage. A key proposition for the growing popularity for touchscreen displays is the high interaction a user has with the system in viewing or obtaining the information or giving certain inputs. The growing use of optical touchscreen in the hospitality industry and for brand advertisement is one of the key trend propelling the sales in the touchscreen display market. Changing requirements of end-use industries have spurred the pace of technological advancements, notably in capacitive touch and sensor technologies. These advancements have focused on the precision of the input and scalability. The latter factor enables display manufacturers to large-sized manufacture touchscreen displays cost-effectively. Another area that is attracting attention of developers is circuit techniques, which has been a key aspect in developing high-resolution touchscreen displays. In particular, analog front-end (AFE) circuits are one of the contemporary technologies being explored by several electronic manufacturers in key regions such as in Asia Pacific. Researchers are also leaning on developing noise-immune circuits for thin displays, where pseudo-differential amplifiers have attracted attention.
The COVID-19 pandemic has dramatically changed the consumer demands in several industries. The dynamic is also changing with respect to the investors’ focus on meeting the emerging demands. The growing shift toward the wide-scale adoption of digital i/o technologies in various consumer markets, such as in healthcare, has spurred interest of display manufacturers on developing interactive and user-friendly displays with high resolution. Demand for smartphones with high-end displays is also opening new avenues in the touchscree display market. Further, in the coming months, businesses in almost all industries will look to leverage display technologies for communicating with prospective consumers as an effort in brand promotion. Further, the emphasis of personalized brand communication is also a key market trend.
Touch Screen Display Market is projected to reach US $121.1 Bn by 2027
Touch Screen Display Market is expected to grow at a CAGR of 21% during 2019 - 2027
Touch Screen Display Market is studied from 2019 - 2027
Key vendors in the Touch Screen Display Market are Displax, Fujitsu Ltd., 3M Co., Samsung, LG Electronics, American Industrial Systems Inc. (AIS), and Panasonic Corp.
North America region Takes Lead in the Touch Screen Display Market
1. Preface
1.1. Market Definition and Scope
1.2. Market Segmentation
1.3. Key Research Objectives
1.4. Research Highlights
2. Assumptions and Research Methodology
3. Executive Summary: Global Touch Screen Display Market
4. Market Overview
4.1. Introduction
4.1.1. Definition
4.1.2. Industry Evolution / Developments
4.2. Market Dynamics
4.2.1. Drivers
4.2.2. Restraints
4.2.3. Opportunity
4.3. Key Trends
4.4. Global Touch Screen Display Market Analysis and Forecasts, 2019-2027
4.4.1. Market Revenue Projections (US$ Mn)
4.5. Porter’s Five Force Analysis
4.6. Value Chain Analysis
4.7. Market Outlook
5. Global Touch Screen Display Market Analysis and Forecast, By Application
5.1. Definition
5.2. Key Findings / Developments
5.3. Key Trends
5.4. Market Size Forecast by Application, 2019-2027 (US$ Mn)
5.4.1. Gas Pumps
5.4.2. Automated Teller Machines (ATM)
5.4.3. Retail Kiosks
5.4.4. Trade shows and Exhibitions
5.4.5. Car Wash Centers
5.4.6. Parking Terminals
5.4.7. Sports Arenas
5.4.8. Public Transport Kiosks
5.4.9. Medical Equipment
5.4.10. Others
5.5. Application Comparison Matrix
5.6. Market Attractiveness By Application
6. Global Touch Screen Display Market Analysis and Forecast, By Region
6.1. Key Findings / Developments
6.2. Key Trends
6.3. Market Size Forecast by Region, 2019-2027 (US$ Mn)
6.3.1. North America
6.3.2. Europe
6.3.3. Asia Pacific
6.3.4. Middle East and Africa
6.3.5. South America
6.4. Market Attractiveness By Region
7. North America Touch Screen Display Market Analysis and Forecast
7.1. Key Findings
7.2. Key Trends
7.3. Market Size Forecast by Application, 2019-2027 (US$ Mn)
7.3.1. Gas Pumps
7.3.2. Automated Teller Machines (ATM)
7.3.3. Retail Kiosks
7.3.4. Trade shows and Exhibitions
7.3.5. Car Wash Centers
7.3.6. Parking Terminals
7.3.7. Sports Arenas
7.3.8. Public Transport Kiosks
7.3.9. Medical Equipment
7.3.10. Others
7.4. Market Size Forecast by Country, 2019-2027 (US$ Mn)
7.4.1. The U.S.
7.4.2. Canada
7.4.3. Rest of North America
7.5. Market Attractiveness Analysis
7.5.1. By Application
7.5.2. By Country
8. Europe Touch Screen Display Market Analysis and Forecast
8.1. Key Findings
8.2. Key Trends
8.3. Market Size Forecast by Application, 2019-2027 (US$ Mn)
8.3.1. Gas Pumps
8.3.2. Automated Teller Machines (ATM)
8.3.3. Retail Kiosks
8.3.4. Trade shows and Exhibitions
8.3.5. Car Wash Centers
8.3.6. Parking Terminals
8.3.7. Sports Arenas
8.3.8. Public Transport Kiosks
8.3.9. Medical Equipment
8.3.10. Others
8.4. Market Size Forecast by Country, 2019-2027 (US$ Mn)
8.4.1. The U.K.
8.4.2. Germany
8.4.3. France
8.4.4. Italy
8.4.5. Rest of Europe
8.5. Market Attractiveness Analysis
8.5.1. By Application
8.5.2. By Country
9. Asia Pacific Touch Screen Display Market Analysis and Forecast
9.1. Key Findings
9.2. Key Trends
9.3. Market Size Forecast by Application, 2019-2027 (US$ Mn)
9.3.1. Gas Pumps
9.3.2. Automated Teller Machines (ATM)
9.3.3. Retail Kiosks
9.3.4. Trade shows and Exhibitions
9.3.5. Car Wash Centers
9.3.6. Parking Terminals
9.3.7. Sports Arenas
9.3.8. Public Transport Kiosks
9.3.9. Medical Equipment
9.3.10. Others
9.4. Market Size Forecast Market Size Forecast by Country, 2019-2027 (US$ Mn)
9.4.1. China
9.4.2. Japan
9.4.3. India
9.4.4. Rest of Asia Pacific
9.5. Market Attractiveness Analysis
9.5.1. By Application
9.5.2. By Country
10. Middle East and Africa (MEA) Touch Screen Display Market Analysis and Forecast
10.1. Key Findings
10.2. Key Trends
10.3. Market Size Forecast by Application, 2019-2027 (US$ Mn)
10.3.1. Gas Pumps
10.3.2. Automated Teller Machines (ATM)
10.3.3. Retail Kiosks
10.3.4. Trade shows and Exhibitions
10.3.5. Car Wash Centers
10.3.6. Parking Terminals
10.3.7. Sports Arenas
10.3.8. Public Transport Kiosks
10.3.9. Medical Equipment
10.3.10. Others
10.4. Market Size Forecast by Country, 2019-2027 (US$ Mn)
10.4.1. UAE
10.4.2. South Africa
10.4.3. Rest of MEA
10.5. Market Attractiveness Analysis
10.5.1. By Application
10.5.2. By Country
11. South America Touch Screen Display Market Analysis and Forecast
11.1. Key Findings
11.2. Key Trends
11.3. Market Size Forecast by Application, 2019-2027 (US$ Mn)
11.3.1. Gas Pumps
11.3.2. Automated Teller Machines (ATM)
11.3.3. Retail Kiosks
11.3.4. Trade shows and Exhibitions
11.3.5. Car Wash Centers
11.3.6. Parking Terminals
11.3.7. Sports Arenas
11.3.8. Public Transport Kiosks
11.3.9. Medical Equipment
11.3.10. Others
11.4. Market Size Forecast by Country, 2019-2027 (US$ Mn)
11.4.1. Brazil
11.4.2. Argentina
11.4.3. Rest of South America
11.5. Market Attractiveness Analysis
11.5.1. By Application
11.5.2. By Country
12. Competition Landscape
12.1. Market Player – Competition Matrix (by Tier and Size of companies)
12.2. Market Share Analysis by Company (2018)
12.3. Company Profiles (Details – Overview, Financials, SWOT Analysis, Strategy)
12.3.1. Fujitsu Ltd.
12.3.1.1. Company Details (HQ, Foundation Year, Revenue, Employee Strength)
12.3.1.2. Company Description
12.3.1.3. SWOT Analysis
12.3.1.4. Strategic Overview
12.3.2. The 3M Company
12.3.2.1. Company Details (HQ, Foundation Year, Revenue, Employee Strength)
12.3.2.2. Company Description
12.3.2.3. SWOT Analysis
12.3.2.4. Strategic Overview
12.3.3. UICO
12.3.3.1. Company Details (HQ, Foundation Year, Revenue, Employee Strength)
12.3.3.2. Company Description
12.3.3.3. SWOT Analysis
12.3.3.4. Strategic Overview
12.3.4. Samsung
12.3.4.1. Company Details (HQ, Foundation Year, Revenue, Employee Strength)
12.3.4.2. Company Description
12.3.4.3. SWOT Analysis
12.3.4.4. Strategic Overview
12.3.5. LG Electronics
12.3.5.1. Company Details (HQ, Foundation Year, Revenue, Employee Strength)
12.3.5.2. Company Description
12.3.5.3. SWOT Analysis
12.3.5.4. Strategic Overview
12.3.6. Displax
12.3.6.1. Company Details (HQ, Foundation Year, Revenue, Employee Strength)
12.3.6.2. Company Description
12.3.6.3. SWOT Analysis
12.3.6.4. Strategic Overview
12.3.7. American Industrial Systems Inc. (AIS)
12.3.7.1. Company Details (HQ, Foundation Year, Revenue, Employee Strength)
12.3.7.2. Company Description
12.3.7.3. SWOT Analysis
12.3.7.4. Strategic Overview
12.3.8. iNEXIO CO., LTD.
12.3.8.1. Company Details (HQ, Foundation Year, Revenue, Employee Strength)
12.3.8.2. Company Description
12.3.8.3. SWOT Analysis
12.3.8.4. Strategic Overview
12.3.9. Panasonic Corporation
12.3.9.1. Company Details (HQ, Foundation Year, Revenue, Employee Strength)
12.3.9.2. Company Description
12.3.9.3. SWOT Analysis
12.3.9.4. Strategic Overview
12.3.10. HORIZON DISPLAY INC.
12.3.10.1. Company Details (HQ, Foundation Year, Revenue, Employee Strength)
12.3.10.2. Company Description
12.3.10.3. SWOT Analysis
12.3.10.4. Strategic Overview
13. Key Takeaways
List of Tables
Table 01: Global Touch Screen Display Market Size (US$ Mn) and Volume (Units) Forecast, By Application, 2018-2027
Table 02: Global Touch Screen Display Market Size (US$ Mn) and Volume (Units) Forecast, By Region, 2018-2027
Table 03: North America Touch Screen Display Market Size (US$ Mn) and Volume (Units) Forecast, By Application, 2018-2027
Table 04: North America Touch Screen Display Market Size (US$ Mn) and Volume (Units) Forecast, By Country, 2018-2027
Table 05: Europe Touch Screen Display Market Size (US$ Mn) and Volume (Units) Forecast, By Application, 2018-2027
Table 06: Europe Touch Screen Display Market Size (US$ Mn) and Volume (Units) Forecast, By Country, 2018-2027
Table 07: Asia Pacific Touch Screen Display Market Size (US$ Mn) and Volume (Units) Forecast, By Application, 2018-2027
Table 08: Asia Pacific Touch Screen Display Market Size (US$ Mn) and Volume (Units) Forecast, By Country, 2018-2027
Table 09: MEA Touch Screen Display Market Size (US$ Mn) and Volume (Units) Forecast, By Application, 2018-2027
Table 10: MEA Touch Screen Display Market Size (US$ Mn) and Volume (Units) Forecast, By Country, 2018-2027
Table 11: South America Touch Screen Display Market Size (US$ Mn) and Volume (Units) Forecast, By Application, 2018-2027
Table 12: South America Touch Screen Display Market Size (US$ Mn) and Volume (Units) Forecast, By Country, 2018-2027
List of Figures
Figure 01: Global Touch Screen Display Market Size (US$ Mn) Forecast, 2018-2027
Figure 02: Global Touch Screen Display Market Volume (Mn Units) Forecast, 2018-2027
Figure 03: Global Touch Screen Display Market Value Share Analysis By Application, 2018 and 2027
Figure 04: Global Touch Screen Display Market Size (US$ Mn) Forecast and Y-o-Y, By Application (Gas Pumps), 2018-2027
Figure 05: Global Touch Screen Display Market Size (US$ Mn) Forecast and Y-o-Y, By Application (ATMs), 2018-2027
Figure 06: Global Touch Screen Display Market Size (US$ Mn) Forecast and Y-o-Y, By Application (Retail Kiosks), 2018-2027
Figure 07: Global Touch Screen Display Market Size (US$ Mn) Forecast and Y-o-Y, By Application (Trade shows and Exhibitions), 2018-2027
Figure 08: Global Touch Screen Display Market Size (US$ Mn) Forecast and Y-o-Y, By Application (Car Wash Centers), 2018-2027
Figure 09: Global Touch Screen Display Market Size (US$ Mn) Forecast and Y-o-Y, By Application (Parking Terminals), 2018-2027
Figure 10: Global Touch Screen Display Market Size (US$ Mn) Forecast and Y-o-Y, By Application (Sports Arenas), 2018-2027
Figure 11: Global Touch Screen Display Market Size (US$ Mn) Forecast and Y-o-Y, By Application (Public Transport Kiosks), 2018-2027
Figure 12: Global Touch Screen Display Market Size (US$ Mn) Forecast and Y-o-Y, By Application (Medical Equipment), 2018-2027
Figure 13: Global Touch Screen Display Market Size (US$ Mn) Forecast and Y-o-Y, By Application (Others), 2018-2027
Figure 14: Global Touch Screen Display Market Attractiveness Analysis By Product Type
Figure 15: Global Touch Screen Display Market Value Share Analysis By Region, 2016 and 2024
Figure 16: Global Touch Screen Display Market Attractiveness Analysis, By Region
Figure 17: North America Touch Screen Display Market Size (US$ Mn) Forecast, 2018-2027
Figure 18: North America Touch Screen Display Market Volume (Mn Units) Forecast, 2018-2027
Figure 19: North America Touch Screen Display Market Value Share Analysis By Application, 2018 and 2027
Figure 20: North America Touch Screen Display Market Value Share Analysis By Country, 2018 and 2027
Figure 21: North America Touch Screen Display Market Attractiveness Analysis, By Application
Figure 22: North America Touch Screen Display Market Attractiveness Analysis, By Country
Figure 23: Europe Touch Screen Display Market Size (US$ Mn) Forecast, 2018-2027
Figure 24: Europe Touch Screen Display Market Volume (Mn Units) Forecast, 2018-2027
Figure 25: Europe Touch Screen Display Market Value Share Analysis By Application, 2018 and 2027
Figure 26: Europe Touch Screen Display Market Value Share Analysis By Country, 2018 and 2027
Figure 27: Europe Touch Screen Display Market Attractiveness Analysis, By Application
Figure 28: Europe Touch Screen Display Market Attractiveness Analysis, By Country
Figure 29: Asia Pacific Touch Screen Display Market Size (US$ Mn) Forecast, 2018-2027
Figure 30: Asia Pacific Touch Screen Display Market Volume (Mn Units) Forecast, 2018-2027
Figure 31: Asia Pacific Touch Screen Display Market Value Share Analysis By Application, 2018 and 2027
Figure 32: Asia Pacific Touch Screen Display Market Value Share Analysis By Country, 2018 and 2027
Figure 33: Asia Pacific Touch Screen Display Market Attractiveness Analysis, By Application
Figure 34: Asia Pacific Touch Screen Display Market Attractiveness Analysis, By Country
Figure 35: MEA Touch Screen Display Market Size (US$ Mn) Forecast, 2018-2027
Figure 36: MEA Touch Screen Display Market Volume (Mn Units) Forecast, 2018-2027
Figure 37: MEA Touch Screen Display Market Value Share Analysis By Application, 2018 and 2027
Figure 38: MEA Touch Screen Display Market Value Share Analysis By Country, 2018 and 2027
Figure 39: MEA Touch Screen Display Market Attractiveness Analysis, By Application
Figure 40: MEA Touch Screen Display Market Attractiveness Analysis, By Country
Figure 41: South America Touch Screen Display Market Size (US$ Mn) Forecast, 2018-2027
Figure 42: South America Touch Screen Display Market Volume (Mn Units) Forecast, 2018-2027
Figure 43: South America Touch Screen Display Market Value Share Analysis By Application, 2016 and 2024
Figure 44: South America Touch Screen Display Market Value Share Analysis By Country, 2018 and 2027
Figure 45: South America Touch Screen Display Market Attractiveness Analysis, By Application
Figure 46: South America Touch Screen Display Market Attractiveness Analysis, By Country
h
Copyright © Transparency Market Research, Inc. All Rights reserved
Trust Online

Touch Screen Display Market