
Reports
Reports
Global Technology Spending on Revenue Cycle Management: Snapshot
The global technology spending on revenue cycle management is primarily being driven by the wide array of advantages that their implementation can offer, such as increase in revenue generation, better efficiency in healthcare practices, easier compliance with industry norms and regulations, and greater accuracy and easier access to healthcare IT systems. However, its market is currently being restricted by a host of issues, including the inability to handle uninsured patients, the losses and increased pressure incurred due to changes in regulations, the low mobility of a system in response to shifting market dynamics, and the overall concerns regarding the integrity and security of data.
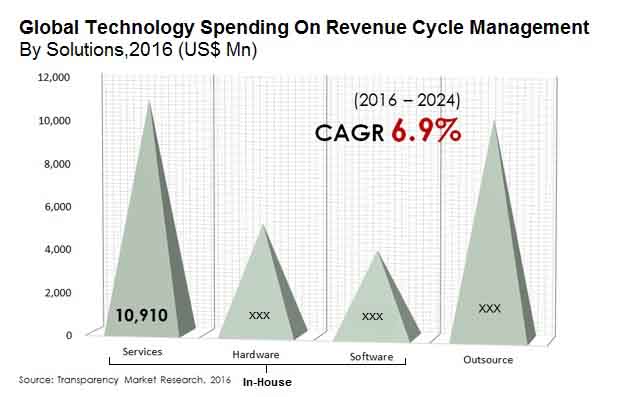
The current trends in the global market for technology spending on revenue cycle management include a growing use of credit card programs that can aid and cover a greater percentage of a national population and allow healthcare organizations to access their medical data faster. The global market for technology spending on revenue cycle management is expected to reach an evaluation of US$51.56 bn by the end of 2024. It was calculated at US$28.50 bn at the end of 2015 and is expected to expand at a healthy CAGR of 6.9% within a forecast period from 2016 to 2024.
Companies Going for Cloud-based Revenue Cycle Management
Revenue cycle management can be dissected into integrated and stand-alone, on the basis of platforms. An integrated platform for revenue cycle management is a combined system for a healthcare organization’s financial performance management, a patient’s electronic health records (EHR), and business intelligence tools, all collected under a single revenue cycle solution. A stand-alone platform in revenue cycle management, on the other hand, can work independently of other solutions or software. It works individually without requiring patient health records or medical records integration. Based on deployment, revenue cycle management is segmented into cloud-based and on-premise. Cloud-based deployment is trending and has greater growth opportunities in the forecast years due to its accessibility and lower costs.
APAC Grows Stronger in Demand for Revenue Cycle Management
North America played the leading role among all key regions in technology spending on revenue cycle management in 2015. However, over the coming years, technology spending on revenue cycle management in Asia Pacific will exhibit the leading CAGR of 8.5%, between 2016 and 2024. Asia Pacific is therefore expected to hold an important position in the sustainable growth of the global technology spending on revenue cycle management industry over the above forecast period.
The Asia Pacific region is still relatively behind in terms of adoption and development of new technologies. Although the expenditures on technology in modern revenue cycle management is currently low in the region, the market is expected to grow substantially, owing to factors such as the positive modulations in global regulatory reforms, the evolving economic scenario and its consequent increase in purchasing power of consumers and enterprises, growing awareness of the advantages of modern revenue cycle management processes and the presence of a large and growing number of patients suffering from various chronic disorders. Japan currently represents a highly lucrative market in terms of spending, compared to the rest of the APAC nations.
Cerner Corporation, McKesson Corporation, DST Systems, Inc., Allscripts, 3M, and Perot Systems have been some of the key players that have led the global market in technology spending on revenue cycle management. A large number of the more prominent entities from this market are known to be located within the U.S.
Simpler Access of Healthcare IT System to Propel Technology Spending on Revenue Cycle Management Market Forward
The global technology spending on revenue cycle management market is predicted to be influenced by the numerous benefits offered by their implementation. It is capable of providing benefits like increased revenue generation, improved effectiveness in healthcare practices, greater accuracy, simpler access to healthcare IT systems, and easier adherence to industry regulations and standards. Nevertheless, global technology spending on revenue cycle management market is currently constrained by a number of issues. Such limitations comprise the incapability to manage uninsured pool of patients, increased pressure and the losses incurred as a result of regulatory changes, the reduced mobility of a structure in answer to changing market dynamics. All these elements cause overall concerns about the security and integrity of data.
Recent trends in the global technology spending on revenue cycle management market comprise a rising use of credit card programmes that can help and cover a larger proportion of a country's population. It can enable health organizations to access their medical information more quickly.
Demand for Centralized System for Managing all Patient Data to Boost Market
The requirement for a centralized method of managing all administrative and clinical functions across episodes of patient care has resulted in a global push for the technology spending on revenue cycle management market. This enables healthcare organizations to make better use of revenue generated by patient services, resulting in increased technology spend on revenue cycle management. Such improvements are found in the convergence of data from systems of medical billing, electronic health records (EHRs), and other diverse health information technology systems. This convergence is likely to fuel growth of the market. Furthermore, the growing need for convenient regulatory compliance is further likely to work in favor of the market in near future.
The industry is being supported by the implementation of technologies by healthcare companies to monitor sales targets. In addition, these solutions are likely to play an important part in the results of patient recovery. One way to do this, particularly in developing countries, is to increase payments of patients or to encourage providers to review claims of insurance in order to streamline reimbursement.
1. Preface
1.1. Market Definition and Scope
1.2. Market Segmentation
1.3. Key Research Objectives
1.4. Research Highlights
2. Assumptions and Research Methodology
3. Executive Summary : Global Technology Spending on Revenue Cycle Management
4. Market Overview
4.1. Introduction
4.2. Overview
4.3. Key Market Indicators
4.4. Key Industry Developments
4.5. Market Opportunity Map
4.6. Market Dynamics
4.6.1. Drivers
4.6.2. Restraints
4.6.3. Opportunity
4.7. Global Technology Spending on Revenue Cycle Management Analysis and Forecasts, 2016–2024
4.7.1. Market Revenue Projections (US$ Mn)
4.8. Porter’s Five Force Analysis
4.9. Revenue Cycle Management Process Workflow
4.10. Market Outlook
5. Global Technology Spending on Revenue Cycle Management Analysis and Forecasts, By Platform
5.1. Introduction & Definition
5.2. Key Findings / Developments
5.3. Technology value Forecast By Platform, 2016–2024
5.3.1. Integrated
5.3.2. Stand-alone
5.4. Market Attractiveness By Platform
6. Global Technology Spending on Revenue Cycle Management Analysis and Forecasts, By End User
6.1. Introduction & Definition
6.2. Key Findings / Developments
6.3. Technology value Forecast By End User, 2016–2024
6.3.1. Provider
6.3.1.1. Hospitals
6.3.1.2. Ambulatory Surgical Centers and Clinics
6.3.1.3. Others
6.3.2. Payer
6.3.2.1. Insurance Companies
6.3.2.2. Government
6.3.2.3. Others
6.4. Market Attractiveness By End User
7. Global Technology Spending on Revenue Cycle Management Analysis and Forecasts, By Solution
7.1. Introduction & Definition
7.2. Key Findings / Developments
7.3. Technology value Forecast By Solution, 2016–2024
7.3.1. In-house
7.3.1.1. Hardware
7.3.1.2. Software
7.3.1.3. Services
7.3.2. Out-source
7.4. Market Attractiveness By Solution
8. Global Technology Spending on Revenue Cycle Management Analysis and Forecasts, By Deployment
8.1. Introduction & Definition
8.2. Key Findings / Developments
8.3. Technology value Forecast By Deployment, 2016–2024
8.3.1. Cloud-based
8.3.2. On-premise
8.4. Market Attractiveness By Deployment
9. Global Technology Spending on Revenue Cycle Management Analysis and Forecasts, By Region
9.1. Key Findings
9.2. Technology value Forecast By Region
9.2.1. North America
9.2.2. Europe
9.2.3. Asia Pacific
9.2.4. Latin America
9.2.5. Middle East and Africa
9.3. Market Attractiveness By Country/Region
10. North America Technology Spending on Revenue Cycle Management Analysis and Forecast
10.1. Introduction
10.1.1. Key Findings
10.2. Technology value Forecast By Platform, 2016–2024
10.2.1. Integrated
10.2.2. Stand-alone
10.3. Technology value Forecast By End User, 2016–2024
10.3.1. Provider
10.3.1.1. Hospitals
10.3.1.2. Ambulatory Surgical Centers and Clinics
10.3.1.3. Others
10.3.2. Payers
10.3.2.1. Insurance Companies
10.3.2.2. Government
10.3.2.3. Others
10.4. Technology value Forecast By Solution, 2016–2024
10.4.1. In-house
10.4.1.1. Hardware
10.4.1.2. Software
10.4.1.3. Services
10.4.2. Out-source
10.5. Technology value Forecast By Deployment, 2016–2024
10.5.1. Cloud-based
10.5.2. On-premise
10.6. Technology value Forecast By Country, 2016–2024
10.6.1. US
10.6.2. Canada
10.7. Market Attractiveness Analysis
10.7.1. By Platform
10.7.2. By End User
10.7.3. By Solution
10.7.4. By Deployment
10.7.5. By Country
11. Europe Technology Spending on Revenue Cycle Management Analysis and Forecast
11.1. Introduction
11.1.1. Key Findings
11.2. Technology value Forecast By Platform, 2016–2024
11.2.1. Integrated
11.2.2. Stand-alone
11.3. Technology value Forecast By End User, 2016–2024
11.3.1. Provider
11.3.1.1. Hospitals
11.3.1.2. Ambulatory Surgical Centers and Clinics
11.3.1.3. Others
11.3.2. Payers
11.3.2.1. Insurance Companies
11.3.2.2. Government
11.3.2.3. Others
11.4. Technology value Forecast By Solution, 2016–2024
11.4.1. In-house
11.4.1.1. Hardware
11.4.1.2. Software
11.4.1.3. Services
11.4.2. Out-source
11.5. Technology value Forecast By Deployment, 2016–2024
11.5.1. Cloud-based
11.5.2. On-premise
11.6. Technology value Forecast By Country, 2016–2024
11.6.1. Germany
11.6.2. UK
11.6.3. France
11.6.4. Spain
11.6.5. Italy
11.6.6. Rest of Europe
11.7. Market Attractiveness Analysis
11.7.1. By Platform
11.7.2. By End User
11.7.3. By Solution
11.7.4. By Deployment
11.7.5. By Country
12. Asia Pacific Technology Spending on Revenue Cycle Management Analysis and Forecast
12.1. Introduction
12.1.1. Key Findings
12.1.2. Policies and Regulations
12.1.3. Price Trend Analysis
12.1.4. Key Trends
12.2. Technology value Forecast By Platform, 2016–2024
12.2.1. Integrated
12.2.2. Stand-alone
12.3. Technology value Forecast By End User, 2016–2024
12.3.1. Provider
12.3.1.1. Hospitals
12.3.1.2. Ambulatory Surgical Centers and Clinics
12.3.1.3. Others
12.3.2. Payers
12.3.2.1. Insurance Companies
12.3.2.2. Government
12.3.2.3. Others
12.4. Technology value Forecast By Solution, 2016–2024
12.4.1. In-house
12.4.1.1. Hardware
12.4.1.2. Software
12.4.1.3. Services
12.4.2. Out-source
12.5. Technology value Forecast By Deployment, 2016–2024
12.5.1. Cloud-based
12.5.2. On-premise
12.6. Technology value Forecast By Country, 2016–2024
12.6.1. China
12.6.2. Japan
12.6.3. India
12.6.4. Australia
12.6.5. New Zealand
12.6.6. Rest of APAC
12.7. Market Attractiveness Analysis
12.7.1. By Platform
12.7.2. By End User
12.7.3. By Solution
12.7.4. By Deployment
12.7.5. By Country
13. Latin America Technology Spending on Revenue Cycle Management Analysis and Forecast
13.1. Introduction
13.1.1. Key Findings
13.2. Technology value Forecast By Platform, 2016–2024
13.2.1. Integrated
13.2.2. Stand-alone
13.3. Technology value Forecast By End User, 2016–2024
13.3.1. Provider
13.3.1.1. Hospitals
13.3.1.2. Ambulatory Surgical Centers and Clinics
13.3.1.3. Others
13.3.2. Payers
13.3.2.1. Insurance Companies
13.3.2.2. Government
13.3.2.3. Others
13.4.Technology value Forecast By Solution, 2016–2024
13.4.1. In-house
13.4.1.1. Hardware
13.4.1.2. Software
13.4.1.3. Services
13.4.2. Out-source
13.5. Technology value Forecast By Deployment, 2016–2024
13.5.1. Cloud-based
13.5.2. On-premise
13.6. Technology value Forecast By Country, 2016–2024
13.6.1. Brazil
13.6.2. Mexico
13.6.3. Rest of Latin America
13.7. Market Attractiveness Analysis
13.7.1. By Platform
13.7.2. By End User
13.7.3. By Solution
13.7.4. By Deployment
13.7.5. By Country
14. Middle East & Africa Technology Spending on Revenue Cycle Management Analysis and Forecast
14.1. Introduction
14.1.1. Key Findings
14.2. Technology value Forecast By Platform, 2016–2024
14.2.1. Integrated
14.2.2. Stand-alone
14.3. Technology value Forecast By End User, 2016–2024
14.3.1. Provider
14.3.1.1. Hospitals
14.3.1.2. Ambulatory Surgical Centers and Clinics
14.3.1.3. Others
14.3.2. Payers
14.3.2.1. Insurance Companies
14.3.2.2. Government
14.3.2.3. Others
14.4. Technology value Forecast By Solution, 2016–2024
14.4.1. In-house
14.4.1.1. Hardware
14.4.1.2. Software
14.4.1.3. Services
14.4.2. Out-source
14.5. Technology value Forecast By Deployment, 2016–2024
14.5.1. Cloud-based
14.5.2. On-premise
14.6. Technology value Forecast By Country, 2016–2024
14.6.1. Saudi Arabia
14.6.2. UAE
14.6.3. South Africa (RSA)
14.6.4. Rest of MEA
14.7. Market Attractiveness Analysis
14.7.1. By Platform
14.7.2. By End User
14.7.3. By Solution
14.7.4. By Deployment
14.7.5. By Country
15. Competition Landscape
15.1. Major Licenses and Contracts
15.2. Market Player – Competition Matrix (By Tier and Size of companies)
15.3. Company Profiles (Details – Overview, Financials, Recent Developments, Strategy)
15.3.1. McKesson Corporation
15.3.1.1. Company Overview
15.3.1.2. Financials
15.3.1.3. SWOT Analysis
15.3.1.4. Strategic Overview
15.3.2. Cerner Corporation
15.3.2.1. Company Overview
15.3.2.2. Financials
15.3.2.3. SWOT Analysis
15.3.2.4. Strategic Overview
15.3.3. 3M Solution
15.3.3.1. Company Overview
15.3.3.2. Financials
15.3.3.3. SWOT Analysis
15.3.3.4. Strategic Overview
15.3.4. Allscripts
15.3.4.1. Company Overview
15.3.4.2. Financials
15.3.4.3. SWOT Analysis
15.3.4.4. Strategic Overview
15.3.5. Next Gen
15.3.5.1. Company Overview
15.3.5.2. Financials
15.3.5.3. SWOT Analysis
15.3.5.4. Strategic Overview
15.3.6. MedAssets
15.3.6.1. Company Overview
15.3.6.2. Financials
15.3.6.3. SWOT Analysis
15.3.6.4. Strategic Overview
15.3.7. Optum Corporation
15.3.7.1. Company Overview
15.3.7.2. Financials
15.3.7.3. SWOT Analysis
15.3.7.4. Strategic Overview
15.3.8. GE Healthcare
15.3.8.1. Company Overview
15.3.8.2. Financials
15.3.8.3. SWOT Analysis
15.3.8.4. Strategic Overview
15.3.9. Perot Systems (a NTT DATA company)
15.3.9.1. Company Overview
15.3.9.2. Financials
15.3.9.3. SWOT Analysis
15.3.9.4. Strategic Overview
15.3.10. CPSI
15.3.10.1. Company Overview
15.3.10.2. Financials
15.3.10.3. SWOT Analysis
List of Tables
Table 01 Global Revenue Cycle Management Market Size (US$ Mn) Forecast, By Platform, 2016–2024
Table 02 Global Technology Spending on Revenue Cycle Management (US$ Mn) Forecast, By Solution, 2016–2024
Table 03 Global Technology Spending on Revenue Cycle Management (US$ Mn) Forecast, By Solution (In-House), 2016–2024
Table 04 Global Technology Spending on Revenue Cycle Management (US$ Mn) Forecast, By Deployment, 2016–2024
Table 05 Global Technology Spending on Revenue Cycle Management (US$ Mn) Forecast, By End User, 2016–2024
Table 06 Global Technology Spending on Revenue Cycle Management (US$ Mn) Forecast, By End User (Provider), 2016–2024
Table 07 Global Technology Spending on Revenue Cycle Management (US$ Mn) Forecast, By End User (Payer), 2016–2024
Table 08 Global Technology Spending on Revenue Cycle Management (US$ Mn) Forecast, By Region, 2016-2024
Table 09 North America Technology Spending on Revenue Cycle Management (US$ Mn) Forecast by Platform, 2016-2024
Table 10 North America Technology Spending on Revenue Cycle Management (US$ Mn) Forecast by Solution, 2016-2024
Table 11 North America Technology Spending on Revenue Cycle Management (US$ Mn) Forecast by Solution (In-House), 2016-2024
Table 12 North America Technology Spending on Revenue Cycle Management (US$ Mn) Forecast By Deployment, 2016-2024
Table 13 North America Technology Spending on Revenue Cycle Management (US$ Mn) Forecast by End User, 2016–2024
Table 14 North America Technology Spending on Revenue Cycle Management (US$ Mn) Forecast by End User (Provider), 2016–2024
Table 15 North America Technology Spending on Revenue Cycle Management (US$ Mn) Forecast by End User (Payer), 2016–2024
Table 16 North America Technology Spending on Revenue Cycle Management (US$ Mn) Forecast by Country, 2016-2024
Table 17 Europe Technology Spending on Revenue Cycle Management (US$ Mn) Forecast By Platform, 2016-2024
Table 18 Europe Technology Spending on Revenue Cycle Management (US$ Mn) Forecast By Solution, 2016-2024
Table 19 Europe Technology Spending on Revenue Cycle Management (US$ Mn) Forecast by Solution (In-House), 2016-2024
Table 20 Europe Technology Spending on Revenue Cycle Management (US$ Mn) Forecast By Deployment, 2016-2024
Table 21 Europe Technology Spending on Revenue Cycle Management (US$ Mn) Forecast by End User, 2016–2024
Table 22 Europe Technology Spending on Revenue Cycle Management (US$ Mn) Forecast by End User (Provider), 2016–2024
Table 23 Europe Technology Spending on Revenue Cycle Management (US$ Mn) Forecast by End User (Payer), 2016–2024
Table 24 Europe Technology Spending on Revenue Cycle Management (US$ Mn) Forecast by Country, 2016-2024
Table 25 Asia Pacific Technology Spending on Revenue Cycle Management (US$ Mn) Forecast By Platform, 2016-2024
Table 26 Asia Pacific Technology Spending on Revenue Cycle Management (US$ Mn) Forecast By Solution, 2016-2024
Table 27 Asia Pacific Technology Spending on Revenue Cycle Management (US$ Mn) Forecast by Solution (In-House), 2016-2024
Table 28 Asia Pacific Technology Spending on Revenue Cycle Management (US$ Mn) Forecast By Deployment, 2016-2024
Table 29 Asia Pacific Technology Spending on Revenue Cycle Management (US$ Mn) Forecast by End User, 2016–2024
Table 30 Asia Pacific Technology Spending on Revenue Cycle Management (US$ Mn) Forecast by End User (Provider), 2016–2024
Table 31 Asia Pacific Technology Spending on Revenue Cycle Management (US$ Mn) Forecast by End User (Payer), 2016–2024
Table 32 Asia Pacific Technology Spending on Revenue Cycle Management (US$ Mn) Forecast by Country, 2016-2024
Table 33 Latin America Technology Spending on Revenue Cycle Management (US$ Mn) Forecast By Platform, 2016-2024
Table 34 Latin America Technology Spending on Revenue Cycle Management (US$ Mn) Forecast By Solution, 2016-2024
Table 35 Latin America Technology Spending on Revenue Cycle Management (US$ Mn) Forecast by Solution (In-House), 2016-2024
Table 36 Latin America Technology Spending on Revenue Cycle Management (US$ Mn) Forecast By Deployment, 2016-2024
Table 37 Latin America Technology Spending on Revenue Cycle Management (US$ Mn) Forecast by End User, 2016–2024
Table 38 Latin America Technology Spending on Revenue Cycle Management (US$ Mn) Forecast by End User (Provider), 2016–2024
Table 39 Latin America Technology Spending on Revenue Cycle Management (US$ Mn) Forecast by End User (Payer), 2016–2024
Table 40 Latin America Technology Spending on Revenue Cycle Management (US$ Mn) Forecast by Country, 2016-2024
Table 41 Middle East & Africa Technology Spending on Revenue Cycle Management (US$ Mn) Forecast By Platform, 2016-2024
Table 42 Middle East & Africa Technology Spending on Revenue Cycle Management (US$ Mn) Forecast By Solution, 2016-2024
Table 43 Middle East & Africa Technology Spending on Revenue Cycle Management (US$ Mn) Forecast by Solution (In-House), 2016-2024
Table 44 Middle East & Africa Technology Spending on Revenue Cycle Management (US$ Mn) Forecast By Deployment, 2016-2024
Table 45 Middle East & Africa Technology Spending on Revenue Cycle Management (US$ Mn) Forecast by End User, 2016–2024
Table 46 Middle East & Africa Technology Spending on Revenue Cycle Management (US$ Mn) Forecast by End User (Provider), 2016–2024
Table 47 Middle East & Africa Technology Spending on Revenue Cycle Management (US$ Mn) Forecast by End User (Payer), 2016–2024
Table 48 Middle East & Africa Technology Spending on Revenue Cycle Management (US$ Mn) Forecast by Country, 2016-2024
List of Figures
Figure 01 Global Technology Spending on Revenue Cycle Management (US$ Mn) Forecast, 2016–2024
Figure 02 Global Technology Spending on Revenue Cycle Management Value Share Analysis: By Platform, 2016 and 2024
Figure 03 Global Technology Spending on Revenue Cycle Management Value (US$ Mn) and Y-o-Y Growth (%): By Integrated Platform, 2016–2024
Figure 04 Global Technology Spending on Revenue Cycle Management Value (US$ Mn) and Y-o-Y Growth (%): By Stand-alone Platform, 2016–2024
Figure 05 Global Technology Spending on Revenue Cycle Management Attractiveness Analysis: By Platform
Figure 06 Global Technology Spending on Revenue Cycle Management Share Analysis: By Solution, 2016 and 2024
Figure 07 Global Technology Spending on Revenue Cycle Management (US$ Mn) and Y-o-Y Growth (%): By In-House Solution, 2016–2024
Figure 08 Global Technology Spending on Revenue Cycle Management (US$ Mn) and Y-o-Y Growth (%): By Out-Source Solution, 2016–2024
Figure 09 Global Technology Spending on Revenue Cycle Management Attractiveness Analysis: By Solution
Figure 10 Global Technology Spending on Revenue Cycle Management Value (US$ Mn) and Y-o-Y Growth (%): By Hardware, 2016–2024
Figure 11 Global Technology Spending on Revenue Cycle Management Value (US$ Mn) and Y-o-Y Growth (%): By Software, 2016–2024
Figure 12 Global Technology Spending on Revenue Cycle Management Value (US$ Mn) and Y-o-Y Growth (%): By Services, 2016–2024
Figure 13 Global Technology Spending on Revenue Cycle Management Attractiveness Analysis: By In-House Solution
Figure 14 Global Technology Spending on Revenue Cycle Management Value Share Analysis: By Deployment, 2016 and 2024
Figure 15 Global Technology Spending on Revenue Cycle Management Value (US$ Mn) and Y-o-Y Growth (%): By Cloud-based Deployment, 2016–2024
Figure 16 Global Technology Spending on Revenue Cycle Management Value (US$ Mn) and Y-o-Y Growth (%): By On-Premise Deployment, 2016–2024
Figure 17 Global Technology Spending on Revenue Cycle Management Attractiveness Analysis: By Deployment
Figure 18 Global Technology Spending on Revenue Cycle Management Value Share Analysis: By End User, 2016 and 2024
Figure 19 Global Technology Spending on Revenue Cycle Management Value (US$ Mn) and Y-o-Y Growth (%): By Provider, 2016–2024
Figure 20 Global Technology Spending on Revenue Cycle Management Value (US$ Mn) and Y-o-Y Growth (%): By Payer, 2016–2024
Figure 21 Global Technology Spending on Revenue Cycle Management Attractiveness Analysis: By End User
Figure 22 Global Technology Spending on Revenue Cycle Management Value (US$ Mn) and Y-o-Y Growth (%): By Hospitals, 2016–2024
Figure 23 Global Technology Spending on Revenue Cycle Management Value (US$ Mn) and Y-o-Y Growth (%): By ASC’s and Clinics, 2016–2024
Figure 24 Global Technology Spending on Revenue Cycle Management Market Value (US$ Mn) and Y-o-Y Growth (%): By Other Providers, 2016–2024
Figure 25 Global Technology Spending on Revenue Cycle Management Attractiveness Analysis: By End User (Provider)
Figure 26 Global Technology Spending on Revenue Cycle Management Value (US$ Mn) and Y-o-Y Growth (%): By Insurance Companies, 2016–2024
Figure 27 Global Technology Spending on Revenue Cycle Management Value (US$ Mn) and Y-o-Y Growth (%): By Government, 2016–2024
Figure 28 Global Technology Spending on Revenue Cycle Management Value (US$ Mn) and Y-o-Y Growth (%): By Other Payers, 2016–2024
Figure 29 Global Technology Spending on Revenue Cycle Management Attractiveness Analysis: By End User (Payer)
Figure 30 Global Technology Spending on Revenue Cycle Management Value Share Analysis: By Region, 2016 and 2024
Figure 31 Global Technology Spending on Revenue Cycle Management Technology Attractiveness Analysis: By Region
Figure 32 North America Technology Spending on Revenue Cycle Management (US$ Mn) and Y-o-Y Growth Forecast, 2016-2024
Figure 33 North America Technology Spending on Revenue Cycle Management Attractiveness: By Country
Figure 34 North America Technology Spending on Revenue Cycle Management Value Share Analysis: By Platform, 2016 and 2024
Figure 35 North America Technology Spending on Revenue Cycle Management Value Share Analysis: By Solution, 2016 and 2024
Figure 36 North America Technology Spending on Revenue Cycle Management Value Share Analysis: By Deployment, 2016 & 2024
Figure 37 North America Technology Spending on Revenue Cycle Management Value Share Analysis: By End User, 2016 and 2024
Figure 38 North America Technology Spending on Revenue Cycle Management Value Share Analysis: By Country, 2016 and 2024
Figure 39 U.S. Technology Spending on Revenue Cycle Management (US$ Mn) and Y-o-Y Growth Forecast, 2016-2024
Figure 40 U.S. Technology Spending on Revenue Cycle Management Absolute $ Opportunity (US$ Mn), 2016-2024
Figure 41 Canada Technology Spending on Revenue Cycle Management (US$ Mn) and Y-o-Y Growth Forecast, 2016-2024
Figure 42 Canada Technology Spending on Revenue Cycle Management Absolute $ Opportunity (US$ Mn), 2016-2024
Figure 43 North America Technology Spending on Revenue Cycle Management Attractiveness Analysis: By Platform, 2016-2024
Figure 44 North America Technology Spending on Revenue Cycle Management Attractiveness Analysis: By Solution, 2016–2024
Figure 45 North America Technology Spending on Revenue Cycle Management Attractiveness Analysis: By Deployment, 2016–2024
Figure 46 North America Technology Spending on Revenue Cycle Management Attractiveness Analysis: By End-User, 2016–2024
Figure 47 Europe Technology Spending on Revenue Cycle Management (US$ Mn) and Y-o-Y Growth Forecast, 2016-2024
Figure 48 Europe Technology Spending on Revenue Cycle Management Attractiveness: By Country
Figure 49 Europe Technology Spending on Revenue Cycle Management Value Share Analysis: By Platform, 2016 and 2024
Figure 50 Europe Technology Spending on Revenue Cycle Management Value Share Analysis: By Solution, 2016 and 2024
Figure 51 Europe Technology Spending on Revenue Cycle Management Value Share Analysis: By Deployment, 2016 & 2024
Figure 52 Europe Technology Spending on Revenue Cycle Management Value Share Analysis: By End User, 2016 and 2024
Figure 53 Europe Technology Spending on Revenue Cycle Management Value Share Analysis: By Country, 2016 and 2024
Figure 54 Germany Technology Spending on Revenue Cycle Management (US$ Mn) and Y-o-Y Growth Forecast, 2016-2024
Figure 55 Germany Technology Spending on Revenue Cycle Management Absolute $ Opportunity (US$ Mn), 2016-2024
Figure 56 U.K. Technology Spending on Revenue Cycle Management (US$ Mn) and Y-o-Y Growth Forecast, 2016-2024
Figure 57 U.K. Technology Spending on Revenue Cycle Management Absolute $ Opportunity (US$ Mn), 2016-2024
Figure 58 France Technology Spending on Revenue Cycle Management (US$ Mn) and Y-o-Y Growth Forecast, 2016-2024
Figure 59 France Technology Spending on Revenue Cycle Management Absolute $ Opportunity (US$ Mn), 2016-2024
Figure 60 Italy Technology Spending on Revenue Cycle Management (US$ Mn) and Y-o-Y Growth Forecast, 2016-2024
Figure 61 Italy Technology Spending on Revenue Cycle Management Absolute $ Opportunity (US$ Mn), 2016-2024
Figure 62 Spain Technology Spending on Revenue Cycle Management (US$ Mn) and Y-o-Y Growth Forecast, 2016-2024
Figure 63 Spain Technology Spending on Revenue Cycle Management Absolute $ Opportunity (US$ Mn), 2016-2024
Figure 64 Rest of Europe Technology Spending on Revenue Cycle Management (US$ Mn) and Y-o-Y Growth Forecast, 2016-2024
Figure 65 Rest of Europe Technology Spending on Revenue Cycle Management Absolute $ Opportunity (US$ Mn), 2016-2024
Figure 66 Europe Technology Spending on Revenue Cycle Management Attractiveness Analysis: By Platform, 2016-2024
Figure 67 Europe Technology Spending on Revenue Cycle Management Attractiveness Analysis: By Solution, 2016–2024
Figure 68 Europe Technology Spending on Revenue Cycle Management Attractiveness Analysis: By Deployment, 2016–2024
Figure 69 Europe Technology Spending on Revenue Cycle Management Attractiveness Analysis: By End User, 2016–2024
Figure 70 Asia Pacific Technology Spending on Revenue Cycle Management (US$ Mn) and Y-o-Y Growth Forecast, 2016-2024
Figure 71 Asia Pacific Technology Spending on Revenue Cycle Management Attractiveness: By Country
Figure 72 Asia Pacific Technology Spending on Revenue Cycle Management Value Share Analysis: By Platform, 2016 and 2024
Figure 73 Asia Pacific Technology Spending on Revenue Cycle Management Value Share Analysis: By Solution, 2016 and 2024
Figure 74 Asia Pacific Technology Spending on Revenue Cycle Management Value Share Analysis: By Deployment, 2016 & 2024
Figure 75 Asia Pacific Technology Spending on Revenue Cycle Management Value Share Analysis: By End User, 2016 and 2024
Figure 76 Asia Pacific Technology Spending on Revenue Cycle Management Value Share Analysis: By Country, 2016 and 2024
Figure 77 China Technology Spending on Revenue Cycle Management (US$ Mn) and Y-o-Y Growth Forecast, 2016-2024
Figure 78 China Technology Spending on Revenue Cycle Management Absolute $ Opportunity (US$ Mn), 2016-2024
Figure 79 Japan Technology Spending on Revenue Cycle Management (US$ Mn) and Y-o-Y Growth Forecast, 2016-2024
Figure 80 Japan Technology Spending on Revenue Cycle Management Absolute $ Opportunity (US$ Mn), 2016-2024
Figure 81 India Technology Spending on Revenue Cycle Management (US$ Mn) and Y-o-Y Growth Forecast, 2016-2024
Figure 82 India Technology Spending on Revenue Cycle Management Absolute $ Opportunity (US$ Mn), 2016-2024
Figure 83 Australia Technology Spending on Revenue Cycle Management (US$ Mn) and Y-o-Y Growth Forecast, 2016-2024
Figure 84 Australia Technology Spending on Revenue Cycle Management Absolute $ Opportunity (US$ Mn), 2016-2024
Figure 85 New Zealand Technology Spending on Revenue Cycle Management (US$ Mn) and Y-o-Y Growth Forecast, 2016-2024
Figure 86 New Zealand Technology Spending on Revenue Cycle Management Absolute $ Opportunity (US$ Mn), 2016-2024
Figure 87 Rest of Asia Pacific Technology Spending on Revenue Cycle Management (US$ Mn) and Y-o-Y Growth Forecast, 2016-2024
Figure 88 Rest of Asia Pacific Technology Spending on Revenue Cycle Management Absolute $ Opportunity (US$ Mn), 2016-2024
Figure 89 Asia Pacific Technology Spending on Revenue Cycle Management Attractiveness Analysis: By Platform, 2016-2024
Figure 90 Asia Pacific Technology Spending on Revenue Cycle Management Attractiveness Analysis: By Solution, 2016–2024
Figure 91 Asia Pacific Technology Spending on Revenue Cycle Management Attractiveness Analysis: By Deployment, 2016–2024
Figure 92 Asia Pacific Technology Spending on Revenue Cycle Management Attractiveness Analysis: By End-User, 2016–2024
Figure 93 Latin America Technology Spending on Revenue Cycle Management (US$ Mn) and Y-o-Y Growth Forecast, 2016-2024
Figure 94 Latin America Technology Spending on Revenue Cycle Management Attractiveness: By Country
Figure 95 Latin America Technology Spending on Revenue Cycle Management Value Share Analysis: By Platform, 2016 and 2024
Figure 96 Latin America Technology Spending on Revenue Cycle Management Value Share Analysis: By Solution, 2016 and 2024
Figure 97 Latin America Technology Spending on Revenue Cycle Management Value Share Analysis: By Deployment, 2016 & 2024
Figure 98 Latin America Technology Spending on Revenue Cycle Management Value Share Analysis: By End User, 2016 and 2024
Figure 99 Latin America Technology Spending on Revenue Cycle Management Value Share Analysis: By Country, 2016 and 2024
Figure 100 Brazil Technology Spending on Revenue Cycle Management (US$ Mn) and Y-o-Y Growth Forecast, 2016-2024
Figure 101 Brazil Technology Spending on Revenue Cycle Management Absolute $ Opportunity (US$ Mn), 2016-2024
Figure 102 Mexico Technology Spending on Revenue Cycle Management (US$ Mn) and Y-o-Y Growth Forecast, 2016-2024
Figure 103 Mexico Technology Spending on Revenue Cycle Management Absolute $ Opportunity (US$ Mn), 2016-2024
Figure 104 Rest of Latin America Technology Spending on Revenue Cycle Management (US$ Mn) and Y-o-Y Growth Forecast, 2016-2024
Figure 105 Rest of Latin America Technology Spending on Revenue Cycle Management Absolute $ Opportunity (US$ Mn), 2016-2024
Figure 106 Latin America Technology Spending on Revenue Cycle Management Attractiveness Analysis: By Platform, 2016-2024
Figure 107 Latin America Technology Spending on Revenue Cycle Management Attractiveness Analysis: By Solution, 2016–2024
Figure 108 Latin America Technology Spending on Revenue Cycle Management Attractiveness Analysis: By Deployment, 2016-2024
Figure 109 Latin America Technology Spending on Revenue Cycle Management Attractiveness Analysis: By End User, 2016–2024
Figure 110 Middle East & Africa Technology Spending on Revenue Cycle Management (US$ Mn) and Y-o-Y Growth Forecast, 2016-2024
Figure 111 Middle East and Africa Technology Spending on Revenue Cycle Management Attractiveness: By Country
Figure 112 Middle East & Africa Technology Spending on Revenue Cycle Management Value Share Analysis: By Platform, 2016 and 2024
Figure 113 Middle East & Africa Technology Spending on Revenue Cycle Management Value Share Analysis: By Solution, 2016 and 2024
Figure 114 Middle East & Africa Technology Spending on Revenue Cycle Management Value Share Analysis: By Deployment, 2016 & 2024
Figure 115 Middle East & Africa Technology Spending on Revenue Cycle Management Value Share Analysis: By End User, 2016 and 2024
Figure 116 Middle East & Africa Technology Spending on Revenue Cycle Management Value Share Analysis: By Country, 2016 and 2024
Figure 117 Saudi Arabia Technology Spending on Revenue Cycle Management (US$ Mn) and Y-o-Y Growth Forecast, 2016-2024
Figure 118 Saudi Arabia Technology Spending on Revenue Cycle Management Absolute $ Opportunity (US$ Mn), 2016-2024
Figure 119 UAE Technology Spending on Revenue Cycle Management (US$ Mn) and Y-o-Y Growth Forecast, 2016-2024
Figure 120 UAE Technology Spending on Revenue Cycle Management Absolute $ Opportunity (US$ Mn), 2016-2024
Figure 121 South Africa Technology Spending on Revenue Cycle Management (US$ Mn) and Y-o-Y Growth Forecast, 2016-2024
Figure 122 South Africa Technology Spending on Revenue Cycle Management Absolute $ Opportunity (US$ Mn), 2016-2024
Figure 123 Rest of Middle East & Africa Technology Spending on Revenue Cycle Management (US$ Mn) and Y-o-Y Growth Forecast, 2016-2024
Figure 124 Rest of Middle East & Africa Technology Spending on Revenue Cycle Management Absolute $ Opportunity (US$ Mn), 2016-2024
Figure 125 Middle East & Africa Technology Spending on Revenue Cycle Management Attractiveness Analysis: By Platform, 2016-2024
Figure 126 Middle East & Africa Technology Spending on Revenue Cycle Management Attractiveness Analysis: By Solution, 2016–2024
Figure 127 Middle East & Africa Technology Spending on Revenue Cycle Management Attractiveness Analysis: By Deployment, 2016-2024
Figure 128 Middle East & Africa Technology Spending on Revenue Cycle Management Attractiveness Analysis: By End User, 2016–2024
Copyright © Transparency Market Research, Inc. All Rights reserved
Trust Online

Technology Spending on Revenue Cycle Management Market