
Reports
Reports
The growing number of supermarkets, cafes, and hotels across the world is the key reason for the currently increasing demand for refrigerated display cases and chilled rooms. More than half of the commercial sales of refrigerated display cases have been made to the food service and food retail industries over the past few years. As their numbers grow, so will the demand for refrigerated display cases and chilled rooms to store food and beverages. Prominent retail chain operators are also showing a further increase in the demand for refrigerated display cases and chilled rooms by penetrating the markets in the emerging economies. They are steadily shifting focus from the highly competitive and matured markets of North America and Europe towards Asia Pacific and Latin America.
The use of refrigerated display cases and chilled rooms has also increased post the growing awareness of retail chain operators and individual store owners of the dangers of storing certain foods without refrigeration. This is further boosted by the increasing stringency of food safety and quality regulations.
Manufacturers of refrigerated display cases and chilled rooms, however, must develop solutions for the challenges such as the high energy consumption rates of most refrigerated display cases and the high purchasing cost of cold rooms.
Owing to the above factors, the global market for refrigerated display cases is projected at a CAGR of 11.2% from 2014 to 2020. By the end of 2016, this market’s revenue is expected to reach US$12.47 bn and US$19.69 bn by 2020. The CAGR for the global chilled rooms market is expected to be 9.9% from 2014 to 2020. By the end of 2016, this market’s revenue is expected to reach US$15.90 bn and US$23.51 bn by 2020.
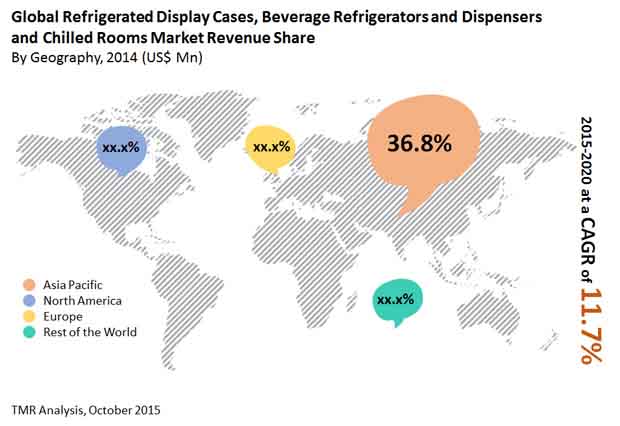
The demand for refrigerated display cases and chilled rooms is expected to be led by Asia Pacific till 2020. By 2020, this region is expected to generate a revenue of US$8.54 bn in refrigerated display cases and US$10.57 bn in chilled rooms. China and India, along with a few other Asia Pacific nations, have shown an excellent economic growth rate that is conducive to the growth of many markets and industries, including those relevant to food service and hotels. Not only is the region demanding for a larger number of refrigerated display cases and chilled rooms, but is also willing to invest in the latest equipment for the same. This is encouraging globally prominent manufacturers to focus on Asia Pacific for the coming years.
North America has been in second place as far as the demand for refrigerated display cases and chilled rooms goes, in the recent past. This is likely to continue being the case till 2020, with Asia Pacific still leading in demand. Both North America and Europe are currently very saturated in terms of player presence and the demand is not enough to suffice the high level of competition here. As a result, a lot of stronger players are looking to other regions for better business.
Refrigerated display cases are commonly found in two types: plug-in and remotely controlled. Plug-in RDCs are expected to continue leading the overall revenue generation till 2020, owing to the very high demand for them and their relative ease of use and better energy efficiency. Plug-in RDCs also require lesser maintenance in comparison to remote RDCs, adding to their preference.
Chilled rooms are commonly present as walk-in cooler rooms, walk-in freezer rooms, and walk-in hybrid rooms. Walk-in cooler rooms are expected to retain dominance in sales till 2020, owing to the wider range of food that can be stored in them.
The key manufacturers of refrigerated display cases and chilled rooms from a global perspective include Lennox International, Dover Corporation, Standex International, Frigo Glass, Illinois Tool Works Inc., Hoshizaki International, Hussmann Corporation, Manitowoc Company, Inc., United Technologies Corporation, Epta Group, Blue Star Limited, Sanden Corporation, and Metalfrio Solutions S.A.
Refrigerated Display Cases, Beverage Refrigerators and Dispensers, and Chilled Rooms Market to Rise Remarkably owing to Increasing Innovations in Food and Beverage Sector
Introduction and implementation of new innovations in the food administrations industry are expanding basically consistently. Areas like stores, bistros, drive-thru eateries, and comparable spots are filling in check quickly exceptionally high rate at a worldwide scale. A lion's share of the new interest for refrigerated showcase cases and chilled rooms has exuded from the food administrations industry, and it can in this way be said that the flourishing development pace of the food administrations industry will drive the interest for refrigerated display cases, beverage refrigerators and dispensers, and chilled room equipment in the coming years.
The interest for refrigerated showcase cases and frozen rooms is primarily high in arising economies, a factor ascribed to expanding dispensable earnings and developing mindfulness. The two components are quickly advancing the deals of numerous roads in the food and drinks industry. The expanding pace of attention to food stockpiling cleanliness is particularly driving a flood in interest for refrigerated showcase cases and chilled rooms in these districts. There is a high probability of a significant unrest in this market in regards to the utilization of greener RDCs and frozen rooms. Eco-accommodating cooling hardware can subsequently give major parts in the market a few chances throughout the next few years.
The developing number of grocery stores, bistros, and lodgings across the world is the critical justification the as of now expanding interest for refrigerated presentation cases and chilled rooms. The greater part of the business deals of refrigerated showcase cases have been made to the food administration and food retail enterprises in the course of recent years. As their numbers increase so will the interest for refrigerated presentation cases and chilled storage rooms to store food and refreshments. Unmistakable corporate store administrators are likewise showing a further expansion in the interest for refrigerated showcase cases and chilled rooms by infiltrating the business sectors in the arising economies.
Chapter 1 Preface
1.1 Report Description and Scope
1.1.1 Market Segmentation
1.2 Research Methodology
1.2.1 Secondary Research
1.2.2 Primary Research
Chapter 2 Executive Summary
2.1 Global Refrigerated Display Cases and Chilled Rooms Market Snapshot, 2013 & 2020
2.2 Global Refrigerated Display Cases and Cold Rooms Market Revenue and Volume, 2012 – 2020 (US$ Mn and Thousand Units)
Chapter 3 Refrigerated Display Cases and Chilled Rooms Market Analysis
3.1 Market Definition
3.2 Market Trends and Future Outlook
3.2.1 LED Lighting Systems (Digital Illumination) for Display Cases
3.2.2 Closed Display Cases Save Energy
3.2.3 Green Display Cases
3.2.4 Integration of Smart Technologies
3.2.5 Remanufactured RDCs
3.3 Legal and Regulatory Standards
3.3.1 Montreal Protocol
3.3.2 Kyoto Protocol
3.3.3 LEED Certification
3.3.4 SEER Rating
3.4 Market Dynamics
3.4.1 Drivers
3.4.1.1 Proliferation of Supermarkets, Hotels and Cafes
3.4.1.2 Increasing Food Safety and Quality Regulations
3.4.1.3 Changing Food Consumption Trends
3.4.1.4 Technological Developments
3.4.1.5 Impact Analysis of Drivers
3.4.2 Restraints
3.4.2.1 Environment Regulations and Energy Efficiency
3.4.2.2 High Initial Purchase Price (Cold Rooms)
3.4.2.3 Growing Online Retail Market
3.4.2.4 Impact Analysis of Restraints
3.4.3 Opportunities
3.4.3.1 Environment Friendly RDCs and Chilled Rooms
3.4.3.2 Commercial Infrastructure Developments in Emerging Economies
3.5 Value Chain Analysis: Refrigerated Display Cases and Chilled Rooms Market
3.6 Porter’s Five Forces Analysis: Refrigerated Display Cases and Chilled Rooms Market
3.6.1 Bargaining Power of Suppliers
3.6.2 Bargaining Power of Buyers
3.6.3 Threat of New Entrants
3.6.4 Threat of Substitutes
3.6.5 Degree of Competition
3.7 Market Attractiveness Analysis: Global RDCs and Chilled Rooms Market - By Product Type, Design, and Geography
3.8 Competitive Landscape
3.8.1 Summary
3.8.2 Market Share of Major Players
3.8.3 Marketing and Branding Strategies Adopted by Major Players
Chapter 4 Global Refrigerated Display Cases and Chilled Rooms Market Overview, by Product
4.1 Comparative Analysis: Refrigerated Display Cases Market, by Product, 2013 & 2020 (Revenue %)
4.1.1 Plug-in Refrigerated Display Cases Market Revenue and Volume, 2012 – 2020 (US$ Mn and Thousand Units)
4.1.2 Remote Refrigerated Display Cases Market Revenue and Volume, 2012 – 2020 (US$ Mn and Thousand Units)
4.2 Comparative Analysis: Global Chilled/Cold Rooms Market, by Product, 2013 & 2020 (Revenue %)
4.2.1 Walk-in Cooler Rooms Market Revenue and Volume, 2012 – 2020 (US$ Mn and Thousand Units)
4.2.2 Walk-in Freezers Rooms Market Revenue and Volume, 2012 – 2020 (US$ Mn and Thousand Units)
4.2.3 Walk-in Hybrid Rooms Market Revenue and Volume, 2012 – 2020 (US$ Mn and Thousand Units)
Chapter 5 Refrigerated Display Cases Market, by Product Design
5.1 Comparative Analysis: Refrigerated Display Cases Market, by Product Design, 2013 & 2020 (Revenue %)
5.2 Vertical (Front Open) Refrigerated Display Cases Market Revenue and Volume, 2012 – 2020 (US$ Mn and Thousand Units)
5.3 Horizontal (Top Open) Refrigerated Display Cases Market Revenue and Volume, 2012 – 2020 (US$ Mn and Thousand Units)
5.4 Others (Hybrid/Semi-Vertical) Refrigerated Display Cases Market Revenue and Volume, 2012 – 2020 (US$ Mn and Unit Thousand)
Chapter 6 Beverage Dispenser Market Analysis
6.1 Comparative Analysis: Beverage Dispensers Market Revenue, 2013 & 2020 (Value %)
6.2 Comparative Analysis: Beverage Dispensers Market Volume, 2013 & 2020 (Value %)
Chapter 7 Refrigerated Beverage Coolers Market Analysis
7.1 Comparative Analysis: Refrigerated Beverage Coolers Market Revenue, 2013 & 2020 (Value %)
7.2 Comparative Analysis: Refrigerated Beverage Coolers Market Volume, 2013 & 2020 (Value %)
Chapter 8 Global Refrigerated Display Cases and Chilled Rooms Market, by Geography
8.1 Comparative Analysis: Global Refrigerated Display Cases and Chilled Rooms Market, by Geography, 2013 & 2020 (Revenue %)
8.2 North America Refrigerated Display Cases and Chilled Rooms Market Revenue and Volume, 2012 – 2020 (US$ Mn and Thousand Units)
8.2.1 North America Refrigerated Display Cases and Chilled Rooms Market Revenue, by Product, 2012 – 2020 (US$ Mn)
8.2.1.1 North America Refrigerated Display Cases Market Revenue, by Product Design, 2012 – 2020 (US$ Mn)
8.2.2 North America Refrigerated Display Cases and Chilled Rooms Market Volume, by Product, 2012 – 2020 (Thousand Units)
8.2.2.1 North America Refrigerated Display Cases Market Volume, by Product Design, 2012 – 2020 (Thousand Units)
8.2.3 North America Beverage Dispenser Market Revenue and Volume, 2012 – 2020 (US$ Mn and Thousand Units)
8.2.4 North America Refrigerated Beverage Coolers Market Revenue and Volume, 2012 – 2020 (US$ Mn and Thousand Units)
8.3 Europe Refrigerated Display Cases and Chilled Rooms Market Revenue and Volume, 2012 – 2020 (US$ Mn and Thousand Units)
8.3.1 Europe Refrigerated Display Cases and Chilled Rooms Market Revenue, by Product, 2012 – 2020 (US$ Mn)
8.3.1.1 Europe Refrigerated Display Cases Market Revenue, by Product Design, 2012 – 2020 (US$ Mn)
8.3.2 Europe Refrigerated Display Cases and Chilled Rooms Market Volume, by Product, 2012 – 2020 (Thousand Units)
8.3.2.1 Europe Refrigerated Display Cases Market Volume, by Product Design, 2012 – 2020 (Thousand Units)
8.3.3 Europe Beverage Dispenser Market Revenue and Volume, 2012 – 2020 (US$ Mn and Thousand Units)
8.3.4 Europe Refrigerated Beverage Coolers Market Revenue and Volume, 2012 – 2020 (US$ Mn and Thousand Units)
8.4 Asia Pacific Refrigerated Display Cases and Chilled Rooms Market Revenue and Volume, 2012 – 2020 (US$ Mn and Thousand Units)
8.4.1 Asia Pacific Refrigerated Display Cases and Chilled Rooms Market Revenue, by Product, 2012 – 2020 (US$ Mn)
8.4.1.1 Asia Pacific Refrigerated Display Cases Market Revenue, by Product Design, 2012 – 2020 (US$ Mn)
8.4.2 Asia Pacific Refrigerated Display Cases and Chilled Rooms Market Volume, by Product, 2012 – 2020 (Thousand Units)
8.4.2.1 Asia Pacific Refrigerated Display Cases Market Volume, by Product Design, 2012 – 2020 (Thousand Units)
8.4.3 Asia Pacific Beverage Dispenser Market Revenue and Volume, 2012 – 2020 (US$ Mn and Thousand Units)
8.4.4 Asia Pacific Refrigerated Beverage Coolers Market Revenue and Volume, 2012 – 2020 (US$ Mn and Thousand Units)
8.5 Rest of the World Refrigerated Display Cases and Chilled Rooms Market Revenue and Volume, 2012 – 2020 (US$ Mn and Thousand Units)
8.5.1 Rest of the World Refrigerated Display Cases and Chilled Rooms Market Revenue, by Product, 2012 – 2020 (US$ Mn)
8.5.1.1 Rest of the World Refrigerated Display Cases Market Revenue, by Product Design, 2012 – 2020 (US$ Mn)
8.5.2 Rest of the World Refrigerated Display Cases and Chilled Rooms Market Volume, by Product, 2012 – 2020 (Thousand Units)
8.5.2.1 Rest of the World Refrigerated Display Cases Market Volume, by Product Design, 2012 – 2020 (Thousand Units)
8.5.3 Rest of the World Beverage Dispenser Market Revenue and Volume, 2012 – 2020 (US$ Mn and Thousand Units)
8.5.4 Rest of the World Refrigerated Beverage Coolers Market Revenue and Volume, 2012 – 2020 (US$ Mn and Thousand Units)
Chapter 9 Company Profiles
9.1 Metalfrio Solutions S.A.
9.1.1 Company Overview
9.1.2 Financial Overview
9.1.3 Business Strategies
9.1.4 Recent Developments
9.2 Beverage-Air Corporation
9.2.1 Company Overview
9.2.2 Financial Overview
9.2.3 Business Strategies
9.2.4 Recent Developments
9.3 Daikin Industries, Ltd.
9.3.1 Company Overview
9.3.2 Financial Overview
9.3.3 Business Strategies
9.3.4 Recent Developments
9.4 United Technologies Corporation – Climate, Controls & Security Unit (Carrier)
9.4.1 Company Overview
9.4.2 Financial Overview
9.4.3 Business Strategies
9.4.4 Recent Developments
9.5 Dover Corporation
9.5.1 Company Overview
9.5.2 Financial Overview
9.5.3 Business Strategies
9.5.4 Recent Developments
9.6 Illinois Tool Works, Inc.
9.6.1 Company Overview
9.6.2 Financial Overview
9.6.3 Business Strategies
9.6.4 Recent Developments
9.7 Hussmann International, Inc.
9.7.1 Company Overview
9.7.2 Financial Overview
9.7.3 Business Strategies:
9.7.4 Recent development
9.8 Lennox International, Inc.
9.8.1 Company Overview
9.8.2 Financial Overview
9.8.3 Business Strategies
9.8.4 Recent Developments
9.9 AHT Cooling Systems GmbH
9.9.1 Company Overview
9.9.2 Financial Overview
9.9.3 Business Strategies
9.9.4 Recent Developments
9.10 Blue Star Ltd.
9.10.1 Company Overview
9.10.2 Financial Overview
9.10.3 Business Strategies
9.10.4 Recent Developments
9.11 Epta S.p.A.
9.11.1 Company Overview
9.11.2 Financial Overview
9.11.3 Business Strategies
9.11.4 Recent Developments
9.12 ISA Italy S.r.l.
9.12.1 Company Overview
9.12.2 Financial Overview
9.12.3 Business Strategies
9.12.4 Recent Developments
9.13 Sanden Corporation
9.13.1 Company Overview
9.13.2 Financial Overview
9.13.3 Business Strategies
9.13.4 Recent Developments
9.14 ColdKit
9.14.1 Company Overview
9.14.2 Financial Overview
9.14.3 Business Strategies
9.14.4 Recent Developments
9.15 Zero Zone, Inc.
9.15.1 Company Overview
9.15.2 Financial Overview
9.15.3 Business Strategies
9.15.4 Recent Developments
9.16 Vestforst A/S
9.16.1 Company Overview
9.16.2 Financial Overview
9.16.3 Business Strategies
9.16.4 Recent Developments
9.17 SRC Refrigeration
9.17.1 Company Overview
9.17.2 Financial Overview
9.17.3 Business Strategies
9.17.4 Recent Developments
9.18 U.S. Cooler Company
9.18.1 Company Overview
9.18.2 Financial Overview
9.18.3 Business Strategies
9.18.4 Recent Developments
9.19 Amerikooler Inc
9.19.1 Company Overview
9.19.2 Financial Overview
9.19.3 Business Strategies
9.19.4 Recent Developments
List of Tables
TABLE 1 Global Refrigerated Display Cabinets (RDCs) and Chilled Rooms Market Segmentation
TABLE 2 Global Refrigerated Display Cases and Chilled Rooms Market Snapshot, 2013 & 2020
TABLE 3 Global Retail Sales Growth, by Volume, 2009 – 2015 (% pa)
TABLE 4 New Hotels Launched in 2012
TABLE 5 Impact Analysis of Drivers
TABLE 6 Impact Analysis of Restraints
TABLE 7 Latin America GDP (based on PPP) Growth, 2008 – 2012 (%)
TABLE 8 North America Refrigerated Display Cases and Chilled Rooms Market Revenue, by Product, 2012 – 2020 (US$ Mn)
TABLE 9 North America Refrigerated Display Cases Market Revenue, by Product Design, 2012 – 2020 (US$ Mn)
TABLE 10 North America Refrigerated Display Cases and Chilled Rooms Market Volume, by Product, 2012 – 2020 (Thousand Units)
TABLE 11 North America Refrigerated Display Cases Market Volume, by Product Design, 2012 – 2020 (Thousand Units)
TABLE 12 Europe Refrigerated Display Cases and Chilled Rooms Market Revenue, by Product, 2012 – 2020 (US$ Mn)
TABLE 13 Europe Refrigerated Display Cases Market Revenue, by Product Design, 2012 – 2020 (US$ Mn)
TABLE 14 Europe Refrigerated Display Cases and Chilled Rooms Market Volume, by Product Type, 2012 – 2020 (Thousand Units)
TABLE 15 Europe Refrigerated Display Cases Market Volume, by Product Design, 2012 – 2020 (Thousand Units)
TABLE 16 Asia Pacific Refrigerated Display Cases and Chilled Rooms Market Revenue, by Product, 2012 – 2020 (US$ Mn)
TABLE 17 Asia Pacific Refrigerated Display Cases Market Revenue, by Product Design, 2012 – 2020 (US$ Mn)
TABLE 18 Asia Pacific Refrigerated Display Cases and Chilled Rooms Market Volume, by Product, 2012 – 2020 (Thousand Units)
TABLE 19 Asia Pacific Refrigerated Display Cases Market Volume, by Product Design, 2012 – 2020 (Thousand Units)
TABLE 20 Rest of the World Refrigerated Display Cases and Chilled Rooms Market Revenue, by Product, 2012 – 2020 (US$ Mn)
TABLE 21 Rest of the World Refrigerated Display Cases Market Revenue, by Product Design, 2012 – 2020 (US$ Mn)
TABLE 22 Rest of the World Refrigerated Display Cases and Chilled Rooms Market Volume, by Product, 2012 – 2020 (Thousand Units)
TABLE 23 Rest of the World Refrigerated Display Cases Market Volume, by Product Design, 2012 – 2020 (Thousand Units)
List of Figures
FIG. 1 Global Refrigerated Display Cases Market Revenue and Volume, 2012 – 2020 (US$ Mn and Thousand Units)
FIG. 2 Global Chilled/Cold Rooms Market Revenue and Volume, 2012 – 2020 (US$ Mn and Thousand Units)
FIG. 3 Montreal Protocol and EPA Schedule: HCFC Refrigerant Phase-Out Timeline
FIG. 4 Global Retail Sales, 2009 – 2015 (US$ Trillion)
FIG. 5 Global Frozen Food Consumption, 2005 – 2020 (US$ Billion)
FIG. 6 Retail Commercial Refrigeration Equipment Market, 2012 – 2019 (US$ Mn)
FIG. 7 Value Chain Analysis: Refrigerated Display Cases and Chilled Rooms Market
FIG. 8 Porter’s Five Forces Analysis: Refrigerated Display Cases and Chilled Rooms Market
FIG. 9 Market Attractiveness Analysis: Global RDCs and Chilled Rooms Market - By Product Type, Design, and Geography
FIG. 10 Market Share of Major Players, 2013 (%)
FIG. 11 Comparative Analysis: Refrigerated Display Cases Market, by Product, 2013 & 2020 (Revenue %)
FIG. 12 Plug-in Refrigerated Display Cases Market Revenue and Volume, 2012 – 2020 (US$ Mn and Thousand Units)
FIG. 13 Remote Refrigerated Display Cases Market Revenue and Volume, 2012 – 2020 (US$ Mn and Thousand Units)
FIG. 14 Comparative Analysis: Global Chilled/Cold Rooms Market, by Product, 2013 & 2020 (Revenue %)
FIG. 15 Walk-in Cooler Rooms Market Revenue and Volume, 2012 – 2020 (US$ Mn and Thousand Units)
FIG. 16 Walk-in Freezers Rooms Market Revenue and Volume, 2012 – 2020 (US$ Mn and Thousand Units)
FIG. 17 Walk-in Hybrid Rooms Market Revenue and Volume, 2012 – 2020 (US$ Mn and Thousand Units)
FIG. 18 Comparative Analysis: Refrigerated Display Cases Market, by Product Design, 2013 & 2020 (Revenue %)
FIG. 19 Vertical (Front Open) Refrigerated Display Cases Market Revenue and Volume, 2012 – 2020 (US$ Mn and Thousand Units)
FIG. 20 Horizontal (Top Open) Refrigerated Display Cases Market Revenue and Volume, 2012 – 2020 (US$ Mn and Thousand Units)
FIG. 21 Others (Hybrid/Semi-Vertical) Refrigerated Display Cases Market Revenue, 2012 – 2020 (US$ Mn and Thousand Units)
FIG. 22 Comparative Analysis: Beverage Dispensers Market Revenue, 2013 & 2020 (Value %)
FIG. 23 Comparative Analysis: Beverage Dispensers Market Volume, 2013 & 2020 (Value %)
FIG. 24 Comparative Analysis: Refrigerated Beverage Coolers Market Revenue, 2013 & 2020 (Value %)
FIG. 25 Comparative Analysis: Refrigerated Beverage Coolers Market Volume, 2013 & 2020 (Value %)
FIG. 26 Comparative Analysis: Global Refrigerated Display Cases Market, by Geography, 2013 & 2020 (Revenue %)
FIG. 27 Comparative Analysis: Global Chilled Rooms Market, by Geography, 2013 & 2020 (Revenue %)
FIG. 28 North America Refrigerated Display Cases and Chilled Rooms Market Revenue and Volume, 2012 – 2020 (US$ Mn and Thousand Units)
FIG. 29 North America Beverage Dispenser Market Revenue and Volume, 2012 – 2020 (US$ Mn and Thousand Units)
FIG. 30 North America Refrigerated Beverage Coolers Market Revenue and Volume, 2012 – 2020 (US$ Mn and Thousand Units)
FIG. 31 Europe Refrigerated Display Cases and Chilled Rooms Market Revenue and Volume, 2012 – 2020 (US$ Mn and Thousand Units)
FIG. 32 Europe Beverage Dispenser Market Revenue and Volume, 2012 – 2020 (US$ Mn and Thousand Units)
FIG. 33 Europe Refrigerated Beverage Coolers Market Revenue and Volume, 2012 – 2020 (US$ Mn and Thousand Units)
FIG. 34 Asia Pacific Refrigerated Display Cases and Chilled Rooms Market Revenue and Volume, 2012 – 2020 (US$ Mn and Thousand Units)
FIG. 35 Asia Pacific Beverage Dispenser Market Revenue and Volume, 2012 – 2020 (US$ Mn and Thousand Units)
FIG. 36 Asia Pacific Refrigerated Beverage Coolers Market Revenue and Volume, 2012 – 2020 (US$ Mn and Thousand Units)
FIG. 37 Rest of the World Refrigerated Display Cases and Chilled Rooms Market Revenue and Volume, 2012 – 2020 (US$ Mn and Thousand Units)
FIG. 38 Rest of the World Beverage Dispenser Market Revenue and Volume, 2012 – 2020 (US$ Mn and Thousand Units)
FIG. 39 Rest of the World Refrigerated Beverage Coolers Market Revenue and Volume, 2012 – 2020 (US$ Mn and Thousand Units)
FIG. 40 Metalfrio Solutions S.A. annual revenues 2011 – 2013 (US$ Mn)
FIG. 41 Daikin Industries Ltd.: Annual Revenue, 2011 - 2013 (US$ Mn)
FIG. 42 United Technologies Corporation: Annual Revenue, 2011 - 2013 (US$ Mn)
FIG. 43 Dover Corporation: Annual Revenue 2011 - 2013 (US$ Mn)
FIG. 44 Illinois Tool Works, Inc.: Annual Revenue, 2011 - 2013 (US$ Mn)
FIG. 45 Hussmann Corporation: Annual Revenue, 2012 & 2011 (US$ Mn)
FIG. 46 Lennox International, Inc. annual revenues 2010 – 2012 (US$ Bn)
FIG. 47 Blue Star Ltd. annual revenues, 2011 – 2013 (US$ Mn)
FIG. 48 Sanden Corporation annual revenues, 2011 – 2013 (US$ Mn)
Copyright © Transparency Market Research, Inc. All Rights reserved
Trust Online

Refrigerated Display Cases, Beverage Refrigerators and Dispensers, and Chilled Rooms Market