
Reports
Reports
The global smart bullet market is heavily influenced by the increase in the defense budget across the world. The swiftly advancing economies, such as China, India, France, the U.S., and U.K. are increasingly integrating smart bullets in their military organizations, which is reflecting positively on this market. With technological advancements, these bullets are likely to witness a substantial rise in their demand in several countries, such as the U.S., China, and India over the next few years.
The global market is likely to proliferate significantly in the near future. Expanding at a CAGR of 15.20% between 2017 and 2025, the opportunity in this market is estimated to increase from US$270.4 mn in 2016 to a value of US$955.4 mn by the end of 2025.
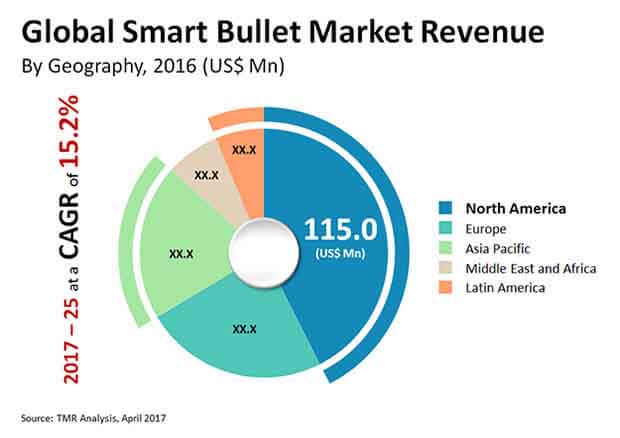
On the basis of the geography, the worldwide market for smart bullets has been categorized into North America, Latin America, the Middle East and Africa, Asia Pacific, and Europe. North America, closely followed by Europe, led the global market in 2016 with a share of more than 42%. This regional market is projected to retain its dominance in the near future, thanks to the increase in the defense budget and the rising demand for weapons. Technological advancements are also expected to stimulate the uptake of these bullets in this region over the forthcoming years. Europe is another important market for smart bullets. It is driven by the augmenting demand for smart weapons in the U.K, Germany, France, and Russia. The U.K. has emerged as the leading domestic market for smart bullets in Europe.
Among other regional markets, Asia Pacific, is likely to report a higher growth rate between 2017 and 2025. Several economies in this region, such as India, Australia, Japan, South Korea, and China are anticipated to present promising opportunities for the growth of this market in the years to come, thanks to the ongoing research activities for the development of highly advanced smart weapons. Apart from this, the rising demand for weapons and frequent terror attacks are also anticipated to drive the Asia Pacific market for smart bullets in the next few years. China has surfaced as the key domestic market for smart bullets in Asia Pacific and is projected to remain so in the near future.
Smart bullets find significant usage in airborne, land, and naval weapons. The land segment emerged as the leading end user for smart bullets in 2016 with a share of 43.6%. Researchers anticipate the scenario to remain so over the forthcoming years, thanks to the increasing investments in the military and defense sector for the development of smart weapons in developing economies. Over the next few years, the presence of war-like situations in various countries, such as Turkey, Ukraine, Lebanon, China, India, France, Afghanistan, and Pakistan, is likely to increase the overall demand for smart bullets, reflecting positively on this market.
The airborne segment is also projected to report a significant rise in the demand for smart bullets in the near future, owing to the high investments in remote sensing and sensors for defense from the Brazilian army.
Lockheed Martin Corp., The Raytheon Co., Thales Group, BAE Systems Plc, General Dynamics Corp., Northrop Grumman Corp., Harris Corp., Boeing Co., Taser International Inc., and Textron Defense Systems are some of the key players in the global smart bullets market.
Massive increase in defense budgets of military organizations of several governments worldwide is fuelling the smart bullets market. As the name suggests, smart bullets are integrated with avant-garde technology that enables targeting with higher precision. In addition, smart bullets are automated that reduces human intervention, thereby enables to target with high precision. Such advantages fuels the smart bullets market.
North America is the fore among other key regions in the smart bullets market. The region being home to some established players, along with wide prevalence of technology are favorable to the growth of smart bullets market in the region. Europe is another key region in the smart bullets market. Developed countries of the region such as Germany, France, and the U.K. are upgrading their defense capabilities for national security. This includes smart weapons such as smart bullets.
The land end-use segment displays maximum demand for smart bullets, and is predicted to account for leading share in the smart bullets market in the forthcoming years. Substantial rise in defense budgets of emerging economies to acquire technology-driven ammunition is benefitting the smart bullets market. At present, due to border and political disturbances, several countries such as China, India, Turkey, and Lebanon are upgrading their military capabilities, including acquiring smart bullets.
On the other hand, the airborne end-use segment is also likely to account for significant share in the smart bullets market in the forthcoming years. High investments for sensors and remote sensing from the Brazilian air forces is a case in point.
The smart bullets market marks intense competition with the presence of some large that have global presence. Integration of avant-garde technology and minimizing human intervention in new smart bullets are some focus of large players in the smart bullets market. Lockheed Martin Corp., BAE Systems plc, Northrop Grumman Corp., Taser International Inc., Thales Group, and Harris Group are to name some leading players in the smart bullets market.
Chapter 1 Preface
1.1 Report Description
1.2 Market Segmentation
1.3 Research Highlights
Chapter 2 Assumptions and Research Methodology
2.1 Assumptions and Acronyms Used
2.2 Research Methodology
Chapter 3 Executive Summary
3.1 Market Snapshot
Chapter 4 Smart Bullets Market: Overview
4.1 Introduction
4.2 Key Trend Analysis
4.3 Drivers and Restraints Snapshot Analysis
4.4 Drivers
4.4.1 Increasing defense budget
4.4.2 Increase in the demand of weapons
4.4.3 Technological innovation
4.4.4 Frequent terror attacks
4.5 Market Restraints
4.5.1 High Manufacturing Cost
4.6 Market Opportunities
4.6.1 Opportunity Analysis
4.6.2 Increase in the demand of smart bullets in navy
4.6.3 Increase in the demand of smart bullets in air force
4.7 Porter’s Analysis
4.8 Smart Bullets: Market Attractiveness Analysis
4.9 Market Share by Key Players (%),2016
4.9.1 Competitive Strategies Adopted by Leading Players, By Regions
Chapter 5 Global Smart Bullets Market: By Type
5.1 Introduction
5.2 Global Smart Bullets Market Value Share Analysis, By Type (%)
5.3 Global Smart Bullets Market Value Share Analysis, By Product Type (USD Million)
5.4 Global Smart Bullets Market Value Share Analysis, By Guided Smart Bullets (USD Million)
5.5 Global Smart Bullets Market Value Share Analysis, By Self-guided Smart Bullets (USD Million)
Chapter 6 Global Smart Bullets Market: By End User
6.1 Introduction
6.2 Global Smart Bullets Market Value Share Analysis, By End User(%)
6.3 Global Smart Bullets Market Value Share Analysis, By End User(USD Million)
6.4 Global Smart Bullets Market Value Share Analysis, By Airborne (USD Million)
6.5 Global Smart Bullets Market Value Share Analysis, By Land(USD Million)
6.6 Global Smart Bullets Market Value Share Analysis, By Naval (USD Million)
Chapter 7 Global Smart Bullets Market: By Geography
7.1 Global Smart Bullets Market Value Share Analysis, By Geographical Scenario(USD Million)
7.2 Global Smart Bullets Market Value Share Analysis, By Region (%)
7.3 Global Smart Bullets Market Value Share Analysis, By Region (USD Million)
Chapter 8 North America Smart Bullets Market Analysis
8.1. North America Smart Bullets Market Value Share Analysis, by Product (%)
8.2 North America Smart Bullets Market Revenue and Forecast, by Product (USD Million)
8.3. North America Smart Bullets Market Value Share Analysis, by End User(%)
8.4. North America Smart Bullets Market Revenue and Forecast, by End User(USD Million)
8.5. North America Smart Bullets Market Value Share Analysis, by Country Type(%)
8.6. North America Smart Bullets Market Revenue and Forecast, by Country Type(USD Million)
8.6.1. U.S. Smart Bullets Market Analysis(USD Million)
8.6.2. Canada Smart Bullets Market Analysis(USD Million)
8.6.3. Mexico Smart Bullets Market Analysis(USD Million)
Chapter 9 Europe Smart Bullets Market Analysis
9.1. Europe Smart Bullets Market Value Share Analysis, by Product (%)
9.2. Europe Smart Bullets Market Revenue and Forecast, by Product (USD Million)
9.3. Europe Smart Bullets Market Value Share Analysis, by End User(%)
9.4. Europe Smart Bullets Market Revenue and Forecast, by End User(USD Million)
9.5. Europe Smart Bullets Market Value Share Analysis, by Country Type(%)
9.6. Europe Smart Bullets Market Revenue and Forecast, by Country Type(USD Million)
9.6.1 U.K. Smart Bullets Market Analysis(USD Million)
9.6.2. Russia Smart Bullets Market Analysis(USD Million)
9.6.3. France Smart Bullets Market Analysis(USD Million)
9.6.4. Germany Smart Bullets Market Analysis(USD Million)
9.6.5. Rest of Europe Smart Bullets Market Analysis(USD Million)
Chapter 10 Asia Pacific Smart Bullets Market Analysis
10.1. Asia Pacific Smart Bullets Market Value Share Analysis, by Product (%)
10.2. Asia Pacific Smart Bullets Market Revenue and Forecast, by Product (USD Million)
10.3. Asia Pacific Smart Bullets Market Value Share Analysis, by End User(%)
10.4. Asia Pacific Smart Bullets Market Revenue and Forecast, by End User(USD Million)
10.5. Asia Pacific Smart Bullets Market Value Share Analysis, by Country Type(%)
10.6. Asia Pacific Smart Bullets Market Revenue and Forecast, by Country Type (USD Million)
10.6.1. China Smart Bullets Market Analysis(USD Million)
10.6.2. India Smart Bullets Market Analysis(USD Million)
10.6.3. Japan Smart Bullets Market Analysis(USD Million)
10.6.4. Rest of Asia Pacific Smart Bullets Market Analysis(USD Million)
Chapter 11 Middle East and Africa Smart Bullets Market Analysis
11.1. Middle East and Africa Smart Bullets Market Value Share Analysis, by Product (%)
11.2. Middle East and Africa Smart Bullets Market Revenue and Forecast, by Product (USD Million)
11.3. Middle East and Africa Smart Bullets Market Value Share Analysis, by End User(%)
11.4. Middle East and Africa Smart Bullets Market Revenue and Forecast, by End User(USD Million)
11.5. Middle East and Africa Smart Bullets Market Value Share Analysis, by Country Type(%)
11.6. Middle East and Africa Smart Bullets Market Revenue and Forecast, by Country Type(USD Million)
11.6.1. Saudi Arabia Smart Bullets Market Analysis(USD Million)
11.6.2. Rest of Middle East and Africa Smart Bullets Market Analysis(USD Million)
Chapter 12 Latin America Smart Bullets Market Analysis
12.1. Latin America Smart Bullets Market Value Share Analysis, by Product (%)
12.2. Latin America Smart Bullets Market Revenue and Forecast, by Product (USD Million)
12.3. Latin America Smart Bullets Market Value Share Analysis, by End User(%)
12.4. Latin America Smart Bullets Market Revenue and Forecast, by End User(USD Million)
12.5. Latin America Smart Bullets Market Value Share Analysis, by Country Type(%)
12.6. Latin America Smart Bullets Market Revenue and Forecast, by Country Type(USD Million)
12.6.1. Brazil Smart Bullets Market Analysis(USD Million)
12.6.2. Rest of Latin America Smart Bullets Market Analysis(USD Million)
Chapter 13 Smart Bullets Market: Company Profile
13.1 Lockheed Martin Corporation
13.1.1. Company Details
13.1.2. Market Presence
13.1.3. Strategic Overview
13.1.4. Financial
13.1.5. SWOT Analysis
13.2 Northrop Grumman Corporation
13.2.1. Company Details
13.2.2. Market Presence
13.2.3. Strategic Overview
13.2.4. Financial
13.2.5. SWOT Analysis
13.3 BAE Systems PLC.
13.3.1. Company Details
13.3.2. Market Presence
13.3.3. Strategic Overview
13.3.4. Financial
13.3.5. SWOT Analysis
13.4 The Raytheon Company
13.4.1. Company Details
13.4.2. Market Presence
13.4.3. Strategic Overview
13.4.4. Financial
13.4.5. SWOT Analysis
13.5 General Dynamics Corporation
13.5.1. Company Details
13.5.2. Market Presence
13.5.3. Strategic Overview
13.5.4. Financial
13.5.5. SWOT Analysis
13.6 Thales Group
13.6.1. Company Details
13.6.2. Market Presence
13.6.3. Strategic Overview
13.6.4. Financial
13.6.5. SWOT Analysis
13.7 Harris Corporation
13.7.1. Company Details
13.7.2. Market Presence
13.7.3. Strategic Overview
13.7.4. Financial
13.7.5. SWOT Analysis
13.8 Boeing Corporation
13.8.1. Company Details
13.8.2. Market Presence
13.8.3. Strategic Overview
13.8.4. Financial
13.8.5. SWOT Analysis
13.9 Taser International, Inc.
13.9.1. Company Details
13.9.2. Market Presence
13.9.3. Strategic Overview
13.9.4. Financial
13.9.5. SWOT Analysis
13.10 Dassault Aviation
13.10.1. Company Details
13.10.2. Market Presence
13.10.3. Strategic Overview
13.10.4. Financial
13.10.5. SWOT Analysis
List Of Tables
Table 1 Global Smart Bullets Market Revenue (Us$ Bn) And Forecast, By Product Type, 2016–2025
Table 2 Global Smart Bullets Market Revenue (Us$ Bn) And Forecast, By End User, 2016–2025
Table 3 Global Smart Bullets Market Revenue (Us$ Bn) And Forecast, By Region, 2016–2025
Table 4 North America Smart Bullets Market Revenue (Us$ Bn) And Forecast, By Product Type, 2016–2025
Table 5 North America Smart Bullets Market Revenue (Us$ Bn) And Forecast, By End User, 2016–2025
Table 6 North America Smart Bullets Market Revenue (Us$ Bn) And Forecast, By Country, 2016–2025
Table 7 Europe Smart Bullets Market Revenue (Us$ Bn) And Forecast, By Product Type, 2016–2025
Table 8 Europe Smart Bullets Market Revenue (Us$ Bn) And Forecast, By End User, 2016–2025
Table 9 Europe Smart Bullets Market Revenue (Us$ Bn) And Forecast, By Country, 2016–2025
Table 10 Asia Pacific Smart Bullets Market Revenue (Us$ Bn) And Forecast, By Product Type, 2016–2025
Table 11 Asia Pacific Smart Bullets Market Revenue (Us$ Bn) And Forecast, By End User, 2016–2025
Table 12 Asia Pacific Smart Bullets Market Revenue (Us$ Bn) And Forecast, By Country, 2016–2025
Table 13 Middle East And Africa Smart Bullets Market Revenue (Us$ Bn) And Forecast, By Product Type, 2016–2025
Table 14 Middle East And Africa Smart Bullets Market Revenue (Us$ Bn) And Forecast, By End User, 2016–2025
Table 15 Middle East And Africa Smart Bullets Market Revenue (Us$ Bn) And Forecast, By Country, 2016–2025
Table 16 Latin America Smart Bullets Market Revenue (Us$ Bn) And Forecast, By Product Type, 2016–2025
Table 17 Latin America Smart Bullets Market Revenue (Us$ Bn) And Forecast, By End User, 2016–2025
Table 18 Latin America Smart Bullets Market Revenue (Us$ Bn) And Forecast, By Country, 2016–2025
List of Figures
Fig. 1 Global Smart Bullets Market, Snapshot
Fig. 2 Executive Summary
Fig. 3 Smart Bullets: Company Market Share Analysis
Fig. 4 Global Smart Bullets Market Value Share Analysis By Product Type, 2016 And 2025 (%)
Fig. 5 Global Guided Smart Bullet Market Revenue (Us$ Bn), 2016 – 2025
Fig. 6 Global Self-guided Smart Bullet Market Revenue (Us$ Bn), 2016 – 2025
Fig. 7 Global Smart Bullets Market Value Share Analysis By End User, 2016 And 2025
Fig. 8 Global Airborne Market Revenue (Us$ Bn), 2016 – 2025
Fig. 9 Global Land Market Revenue (Us$ Bn), 2016 – 2025
Fig. 10 Global Naval Market Revenue (Us$ Bn), 2016 – 2025
Fig. 11 Geographical Scenario
Fig. 12 Global Smart Bullets Market Value Share Analysis, By Region, 2016 And 2025
Fig. 13 North America Smart Bullets Market Value Share Analysis By Product Type, 2016 And 2025
Fig. 14 North America Smart Bullets Market Value Share Analysis By End User, 2016 And 2025
Fig. 15 North America Smart Bullets Market Value Share Analysis By Country, 2016 And 2025
Fig. 16 U.S. Smart Bullets Market Revenue (Us$ Bn), 2016 – 2025
Fig. 17 Canada Smart Bullets Market Revenue (Us$ Bn), 2016 – 2025
Fig. 18 Mexico Smart Bullets Market Revenue (Us$ Bn), 2016 – 2025
Fig. 19 Europe Smart Bullets Market Value Share Analysis By Product Type, 2016 And 2025
Fig. 20 Europe Smart Bullets Market Value Share Analysis By End User, 2016 And 2025
Fig. 21 Europe Smart Bullets Market Value Share Analysis By Country, 2016 And 2025
Fig. 22 U.K. Smart Bullets Market Revenue (Us$ Bn), 2016 – 2025
Fig. 23 Russiasmart Bullets Market Revenue (Us$ Bn), 2016 – 2025
Fig. 24 France Smart Bullets Market Revenue (Us$ Bn), 2016 – 2025
Fig. 25 Germanysmart Bullets Market Revenue (Us$ Bn), 2016 – 2025
Fig. 26 Rest Of Europe Smart Bullets Market Revenue (Us$ Bn), 2016 – 2025
Fig. 27 Asia Pacific Smart Bullets Market Value Share Analysis By Product Type, 2016 And 2025
Fig. 28 Asia Pacific Smart Bullets Market Value Share Analysis By End User, 2016 And 2025
Fig. 29 Asia Pacific Smart Bullets Market Value Share Analysis By Country, 2016 And 2025
Fig. 30 China Smart Bullets Market Revenue (Us$ Bn), 2016 – 2025
Fig. 31 India Smart Bullets Market Revenue (Us$ Bn), 2016 – 2025
Fig. 32 Japansmart Bullets Market Revenue (Us$ Bn), 2016 – 2025
Fig. 33 Rest Of Asia Pacific Smart Bullets Market Revenue (Us$ Bn), 2016 – 2025
Fig. 34 Middle East And Africa Smart Bullets Market Value Share Analysis By Product Type, 2016 And 2025
Fig. 35 Middle East And Africa Smart Bullets Market Value Share Analysis By End-Use Type, 2016 And 2025
Fig. 36 Middle East And Africa Smart Bullets Market Value Share Analysis By Country, 2016 And 2025
Fig. 37 United Arab Emiratessmart Bullets Market Revenue (Us$ Bn), 2016 – 2025
Fig. 38 Rest Of Middle East And Africasmart Bullets Market Revenue (Us$ Bn), 2016 – 2025
Fig. 39 Latin Americasmart Bullets Market Value Share Analysis By Product Type, 2016 And 2025
Fig. 40 Latin Americasmart Bullets Smart Bullets Market Value Share Analysis By End-Use Type, 2016 And 2025
Fig. 41 Latin America Market Value Share Analysis By Country, 2016 And 2025
Fig. 42 Brazil Smart Bullets Market Revenue (Us$ Bn), 2016 – 2025
Fig. 43 Rest Of Latin Americasmart Bullets Market Revenue (Us$ Bn), 2016 – 2025
Copyright © Transparency Market Research, Inc. All Rights reserved
Trust Online

Smart Bullets Market