
Reports
Reports
The rising occurrence of political unrest and armed violence has compelled governments to look for methods of countering boisterous crowd but without causing injuries. Because non-lethal biochemical weapons optimize the risk of unintended or incidental casualties, there use in dispersing crowd in policing situations has increased. The global non-lethal biochemical weapons market will therefore witness lucrative opportunities in regions exhibiting a high defense expenditure. For instance, the demand for non-lethal biochemical weapons is high in India, South Korea, China, and Turkey is considerably high as these countries showcase a high budget allocation to the defense sector. Besides the market is also expected to gain from the increasing research and development in this sector.
On the downside, stringent regulations, opposition from human rights association, and the declining budget allocation for the defense sector in developed economies will pose threat to the market. Nevertheless, Transparency Market Research (TMR) forecasts the global non-lethal biochemical weapons market to exhibit a CAGR of 8% between 2016 and 2024. At this pace, the market is projected to reach US$2.32 bn by the end of 2024, from a valuation of US$1.17 bn in 2015.
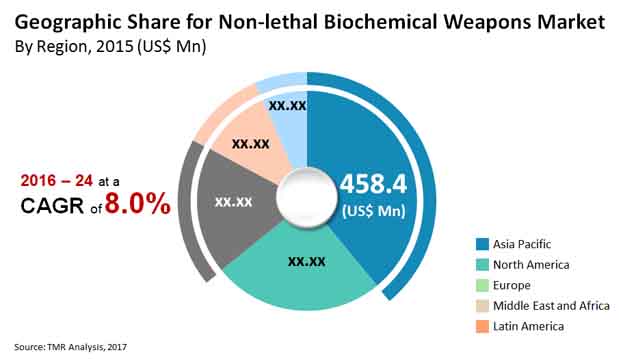
Asia Pacific, Europe, North America, Latin America, and the Middle-east and Africa constitute the key regional segments in the global non-lethal biochemical weapons market. Among these regions, the demand witnessed in the Middle East and Africa is the highest. The region held a dominant share of 35% in the overall market in 2015, trailed by North America. This trend is forecast to remain constant through the course of the forecast period, during which Asia Pacific will also emerge as a lucrative market.
The rising allocation to the defense budget and the use of innovative weaponry to counter policing situations are expected to bolster opportunities the non-lethal biochemical weapons manufacturers in Asia Pacific. The demand from the military forces segment is forecast to be the highest in the region. Besides this, the demand for directed energy variant of non-lethal biochemical weapons will be considerably high in North America.
Based on end-use, the global non-lethal biochemical weapons market can be bifurcated into law-enforcement agencies and military forces. Among these, the demand witnessed in the latter segment is the highest. As per TMR, the military forces segment accounted for over 82% of the overall market in 2015 and is expected to remain dominant through the course of the forecast period. The rising use of non-lethal biochemical weapons by military forces is ascribable to the increasing need for crowd control across emerging nations. In addition, these weapons offer advanced methods of countering challenges to internal security. This is a crucial factor driving the demand for non-lethal biochemical weapons in countries such as India, Brazil, Ukraine, and Israel.
Some of the key players operating in the global non-lethal biochemical weapons market are Lamperd Less Lethal (Canada), BAE Systems, Inc. (United Kingdom), QinetiqGroup, Inc. (United Kingdom), General Dynamics Corporation (United States), TASER International,Inc. (Arizona), Moog, Inc. (New York), Raytheon Company (United States), Chemring Group PLC. (United Kingdom), Textron Systems, Corp. (United States), and LRAD Corporation (United States).
Non-lethal Biochemical Weapons Market to Gain from Increasing Investments to Strengthen Military Sector
The rising investment on the defense sector of various developed and emerging nations stands as a key factor aiding in expansion of the global non-lethal biochemical weapons market. The rising event of political agitation and outfitted viciousness has constrained governments to search for techniques for countering rambunctious group however without causing wounds. Since non-deadly biochemical weapons advance the danger of unintended or coincidental losses, there use in scattering swarm in policing circumstances has expanded.
In terms of end use segmentation, the market is dominated by military forces rather than its counterpart law-enforcement. This is owing to the rising use of non-lethal biochemical weapons by military forces, further attributed to the growing need for crowd control in the developing and under developed nations such as Israel, Ukraine, Brazil, India, and others. Some of the players functioning in the global non-lethal biochemical weapons market include LRAD Corporation, Lamperd Less Lethal , Textron Systems, Corp., Chemring Group PLC., Raytheon Company, Moog, Inc., TASER International Inc., General Dynamics Corporation, QinetiqGroup, Inc., BAE Systems, Inc., and others.
In between national rivalries, and during characteristic or artificial calamities military utilize non-deadly biochemical weapons. These conditions build the odds of limitless development of non-deadly biochemical weapon market. Developing weaknesses across countries have expanded the guard financial plan across country, which will demonstrate useful for the market
Developing human help administrations for law authorization is relied upon to support the interest for non-deadly biochemical weapons market. Changing political situations in couple of locales additionally qualities to ascent of the market. Political strife in nations, for example, Israel, Egypt, India, France, Syria, China, and the U.S. have been answerable for the popularity for the non-deadly biochemical weapons market.
Regionally, the market for non-lethal biochemical weapons is dominated by North America on account of the presence of major players. Additionally, this region will also gain notable revenue in the coming years and continue dominance on account of the increasing demand for directed energy variant. On the other side, Asia Pacific will gain a significant revenue in the coming years on account of the increasing investments in military and defense sector.
Section 1 Preface
1.1 Report Scope
1.2 Market Segmentation
1.3 Research Highlights
Section 2 Research Methodology
2.1 Secondary Research
2.2 Primary Research
2.3 Models
Section 3 Executive Summary
3.1 Global Non-Lethal Biochemical Weapons Market Snapshot
3.2 Global Non-Lethal Biochemical Weapons Market Share, By Region 2015 & 2024
Section 4 Non-Lethal Biochemical Weapons Market: Overview
4.1 Introduction
4.2 Recent Trend Analysis
Section 5 Non-Lethal Biochemical Weapons Market: Dynamics
5.1 Market Drivers
5.1.1 Technologically progressive solutions
5.1.2 Increasing demand for crowd control
5.1.3 Research and development initiatives
5.2 Market Restraints
5.2.1 Stringent environmental and governmental rules
5.2.2 Declining defense budget of developed countries
5.3 Market Opportunities
5.3.1 Changing regional and political dynamics of world economy
5.3.2 Rising incidences of armed violence and terrorism
5.4 Global Non-Lethal Biochemical Weapons Market Outlook, 2015
5.4.1 Market Value Share By Operation Type (2015)
5.4.2 Market Value Share By Product Type (2015)
5.4.3 Market Value Share By End Use (2015)
5.4.4 Market Value Share By Region (2015)
5.5 Company Market Share Analysis (%), 2015
Section 6 Global Non-Lethal Biochemical Weapons Market: By Operation Type
6.1 Introduction
6.2 Global Non-Lethal Biochemical Weapons Market Value Share Analysis, By Operation Type
6.3 Global Non-Lethal Biochemical Weapons Market Forecast By Operation Type
6.4 Global Non-Lethal Biochemical Weapons Market Analysis By Operation Type
Section 7 Global Non-Lethal Biochemical Weapons Market: By Product Type
7.1 Introduction
7.2 Global Non-Lethal Biochemical Weapons Market Value Share Analysis, By Product Type
7.3 Global Non-Lethal Biochemical Weapons Market Forecast By Product Type
Section 8 Global Non-Lethal Biochemical Weapons Market: By Product Type
8.1 Introduction
8.2 Global Non-Lethal Biochemical Weapons Market Value Share Analysis,By Product Type
8.3 Global Non-Lethal Biochemical Weapons Market Forecast By Product Type
Section 9 North America Non-Lethal Biochemical Weapons Market Analysis
9.1 Introduction
9.2 North America Non-Lethal Biochemical Weapons Market Value Share Analysis, By Operation Type
9.3 North America Non-Lethal Biochemical Weapons Market Forecast, By Operation Type
9.4 North America Non-Lethal Biochemical Weapons Market Value Share Analysis, By Product Type
9.5 North America Non-Lethal Biochemical Weapons Market Forecast, By Product Type
9.6 North America Non-Lethal Biochemical Weapons Market Value Share Analysis, By End Use
9.7 North America Non-Lethal Biochemical Weapons Market Forecast, By End Use
9.8 North America Non-Lethal Biochemical Weapons Market Value Share Analysis, By Country
9.9 North America Non-Lethal Biochemical Weapons Market Forecast, By Country
9.10 North America Non-Lethal Biochemical Weapons Market Analysis, By Country
9.10.1 U.S. Non-Lethal Biochemical Weapons Market, 2016 – 2024, USD Mn
9.10.2 Canada Non-Lethal Biochemical Weapons Market, 2016 – 2024, USD Mn
9.10.3 Mexico Non-Lethal Biochemical Weapons Market, 2016 – 2024, USD Mn
Section 10 Europe Non-Lethal Biochemical Weapons Market
10.1 Introduction
10.2 Europe Non-Lethal Biochemical Weapons Market Value Share Analysis, By Operation Type
10.3 Europe Non-Lethal Biochemical Weapons Market Forecast, By Operation Type
10.4 Europe Non-Lethal Biochemical Weapons Market Value Share Analysis, By Product Type
10.5 Europe Non-Lethal Biochemical Weapons Market Forecast By Product Type
10.6 Europe Non-Lethal Biochemical Weapons Market Value Share Analysis, By End Use
10.7 Europe Non-Lethal Biochemical Weapons Market Forecast, By End Use
10.8 Europe Non-Lethal Biochemical Weapons Market Value Share Analysis,By Country
10.9 Europe Non-Lethal Biochemical Weapons Market Forecast By Country
10.10 Europe Non-Lethal Biochemical Weapons Market Analysis By Country
10.10.1 U.K. Non-Lethal Biochemical Weapons Market, 2016 – 2024, USD Mn
10.10.2 Germany Non-Lethal Biochemical Weapons Market, 2016 – 2024, USD Mn
10.10.3 France Non-Lethal Biochemical Weapons Market, 2016 – 2024, USD Mn
10.10.4 Italy Non-Lethal Biochemical Weapons Market, 2016 – 2024, USD Mn
Section 11 Asia Pacific Non-Lethal Biochemical Weapons Market
11.1 Introduction
11.2 Asia Pacific Non-Lethal Biochemical Weapons Market Value Share Analysis, By Operation Type
11.3 Asia Pacific Non-Lethal Biochemical Weapons Market Forecast By Operation Type
11.4 Asia Pacific Non-Lethal Biochemical Weapons Market Value Share Analysis, By Product Type
11.5 Asia Pacific Non-Lethal Biochemical Weapons Market Forecast By Product Type
11.6 Asia Pacific Non-Lethal Biochemical Weapons Market Value Share Analysis, By End Use
11.7 Asia Pacific Non-Lethal Biochemical Weapons Market Forecast, By End Use
11.8 Asia Pacific Non-Lethal Biochemical Weapons Market Value Share Analysis, By Country
11.9 Asia Pacific Non-Lethal Biochemical Weapons Market Forecast By Country
11.10 Asia Pacific Non-Lethal Biochemical Weapons Market Analysis By Country
11.10.1 China Non-Lethal Biochemical Weapons Market, 2016 – 2024, USD Mn
11.11.2 Japan Non-Lethal Biochemical Weapons Market, 2016 – 2024, USD Mn
11.11.3 India Non-Lethal Biochemical Weapons Market, 2016 – 2024, USD Mn
11.11.4 South Korea Non-Lethal Biochemical Weapons Market, 2016 – 2024, USD Mn
11.11.5 Rest of Asia Pacific Non-Lethal Biochemical Weapons Market, 2016 – 2024, USD Mn
Section 12 Middle East and Africa Market
12.1 Introduction
12.2 Middle East and Africa Non-Lethal Biochemical Weapons Market Value Share Analysis, By Operation Type
12.3 Middle East and Africa Non-Lethal Biochemical Weapons Market Forecast By Operation Type
12.4 Middle East and Africa Non-Lethal Biochemical Weapons Market Value Share Analysis, By Product Type
12.5 Middle East and Africa Non-Lethal Biochemical Weapons Market Forecast By Product Type
12.6 Middle East and Africa Non-Lethal Biochemical Weapons Market Value Share Analysis, By End Use
12.7 Middle East and Africa Non-Lethal Biochemical Weapons Market Forecast, By End Use
12.8 Middle East and Africa Non-Lethal Biochemical Weapons Market Value Share Analysis,By Country
12.9 Middle East and Africa Non-Lethal Biochemical Weapons Market Forecast By Country
12.10 Middle East and Africa Non-Lethal Biochemical Weapons Market Analysis By Country
12.10.1 UAE Non-Lethal Biochemical Weapons Market, 2016 – 2024, USD Mn
12.10.2 Saudi Arabia Non-Lethal Biochemical Weapons Market, 2016 – 2024, USD Mn
12.10.3 South Africa Non-Lethal Biochemical Weapons Market, 2016 – 2024, USD Mn
12.10.4 Rest of MEA Non-Lethal Biochemical Weapons Market, 2016 – 2024, USD Mn
Section 13 Latin America Market
13.1 Introduction
13.2 Latin America Non-Lethal Biochemical Weapons Market Value Share Analysis,By Operation Type
13.3 Latin America Non-Lethal Biochemical Weapons Market Forecast By Operation Type
13.4 Latin America Non-Lethal Biochemical Weapons Market Value Share Analysis, By Product Type
13.5 Latin America Non-Lethal Biochemical Weapons Market Forecast By Product Type
13.6 Latin America Non-Lethal Biochemical Weapons Market Value Share Analysis, By End Use
13.7 Latin America Non-Lethal Biochemical Weapons Market Forecast, By End Use
13.8 Latin America Pacific Non-Lethal Biochemical Weapons Market Value Share Analysis,By Country
13.9 Latin America Pacific Non-Lethal Biochemical Weapons Market Forecast By Country
13.10 Latin America Pacific Non-Lethal Biochemical Weapons Market Analysis By Country
13.10.1 Brazil Non-Lethal Biochemical Weapons Market, 2016 – 2024, USD Mn
13.10.2 Argentina Non-Lethal Biochemical Weapons Market, 2016 – 2024, USD Mn
13.10.3 Rest of Latin America Non-Lethal Biochemical Weapons Market, 2016 – 2024, USD Mn
Section 14 Non-Lethal Biochemical Weapons Market: Company Profile
14.1 BAE Systems, Inc.
14.1.1. Company Details
14.1.2. Market Presence
14.1.3. Recent Developments
14.1.4. Financial
14.1.5. Strategic Overview
14.2 Lamperd Less Lethal, Inc.
14.2.1. Company Details
14.2.2. Market Presence
14.2.3. Recent Developments
14.2.4. Financial
14.2.5. Strategic Overview
14.3 TASER International, Inc.
14.3.1.Company Detail
14.3.2. Market Presence
14.3.3. Recent Developments
14.3.4. Financial
14.3.5. Strategic Overview
14.4 Raytheon Company.
14.4.1. Company Details
14.4.2. Market Presence
14.4.3. Recent Developments
14.4.4. Financial
14.4.5. Strategic Overview
14.5 Textron Systems, Corp.
14.5.1. Company Details
14.5.2. Market Presence
14.5.3. Recent Developments
14.5.4. Financial
14.5.5. Strategic Overview
14.6 General Dynamics Corporation
14.6.1. Company Details
14.6.2. Market Presence
14.6.3. Recent Developments
14.6.4. Financial
14.6.5.Strategic Overview
14.7 Chemring Group PLC.
14.13.1. Company Details
14.13.2. Market Presence
14.13.3. Recent Developments
14.13.4. Financial
14.13.5. Strategic Overview
14.8 Moog, Inc.
14.8.1. Company Details
14.8.2. Market Presence
14.8.3. Recent Developments
14.8.4. Financial
14.8.5. Strategic Overview
14.9 Qinetiq Group, Inc.
14.9.1. Company Details
14.9.2. Market Presence
14.9.3. Recent Developments
14.9.4. Financial
14.9.5. Strategic Overview
14.10 LRAD Corporation
14.10.1. Company Details
14.10.2. Market Presence
14.10.3. Recent Developments
14.10.4. Financial
14.10.5. Strategic Overview
List of Tables
TABLE 1 Global Market Size (USD Mn) Forecast, By Operation Type, 2016 – 2024
TABLE 2 Global Market Size (USD Mn Forecast, By Product Type, 2016 – 2024
TABLE 3 Globa Market Size (USD Mn) Forecast, By End Use, 2016-2024
TABLE 4 North America Non-Lethal Biochemical Weapons Market, Revenue (US$ Mn and Forecast, By Operation Type, 2016–2024t
TABLE 5 North America Non-Lethal Biochemical Weapons Market, Revenue (US$ Mn and Forecast, By Product Type, 2015–2024
TABLE 6 North America Non-Lethal Biochemical Weapons Market, Revenue (US$ Mn and Forecast, By End Use, 2015–2024
TABLE 7 North America Non-Lethal Biochemical Weapons Market, Revenue (US$ Mn and Forecast, By Country, 2016–2024
TABLE 8 Europe Non-Lethal Biochemical Weapons Market Revenue (US$ Mn and Forecast, By Operation Type, 2016–2024
TABLE 9 Europe Non-Lethal Biochemical Weapons Market Revenue (US$ Mn and Forecast, By Product Type, 2016–2024
TABLE 10 Europe Non-Lethal Biochemical Weapons Market Revenue (US$ Mn and Forecast, By End Use, 2016–2024
TABLE 11 Europe Non-Lethal Biochemical Weapons Market Revenue (US$ Mn and Forecast, By Country, 2016–2024
TABLE 12 Asia Pacific Non-Lethal Biochemical Weapons Market Revenue (US$ Mn and Forecast, By Operation Type, 2016–2024
TABLE 13 Asia Pacific Non-Lethal Biochemical Weapons Market Revenue (US$ Mn and Forecast, By Product Type, 2016–2024
TABLE 14 Asia Pacific Non-Lethal Biochemical Weapons Market Revenue (US$ Mn and Forecast, By End Use, 2016–2024
TABLE 15 Asia Pacific Non-Lethal Biochemical Weapons Market Revenue (US$ Mn and Forecast, By Country, 2016–2024
TABLE 16 Middle East and Africa Non-Lethal Biochemical Weapons Market Revenue (USD Mn) and Forecast, By Operation Type, 2016–2024
TABLE 17 Middle East and Africa Non-Lethal Biochemical Weapons Market Revenue (USD Mn) and Forecast, By Product Type, 2016–2024
TABLE 18 Middle East and Africa Non-Lethal Biochemical Weapons Market Revenue (US$ Mn and Forecast, By End Use, 2016–2024
TABLE 19 Middle East and Africa Non-Lethal Biochemical Weapons Market Revenue (USD Mn) and Forecast, By Country Type, 2016–2024
TABLE 20 Latin America Non-Lethal Biochemical Weapons Market Revenue (USD Mn) and Forecast, By Operation Type, 2016–2024
TABLE 21 Latin America Non-Lethal Biochemical Weapons Market Revenue (USD Mn) and Forecast, By Product Type, 2016–2024
TABLE 22 Latin America Non-Lethal Biochemical Weapons Market Revenue (US$ Mn and Forecast, By End Use, 2016–2024
TABLE 23 Latin America Non-Lethal Biochemical Weapons Market Revenue (USD Mn) and Forecast, By Country, 2016–2024
List of Figures
FIG. 1 Report Scope
FIG. 2 Market Snapshot: Top 3 Trends
FIG. 3 Market Share, By Country, 2015 & 2024
FIG. 4 Key Trends
FIG. 5 Non-Lethal Biochemical Weapons: Market Value Share By Operation Type
FIG. 6 Non-Lethal Biochemical Weapons: Market Value Share By Product Type
FIG. 7 Non-Lethal Biochemical Weapons: Market Value Share By End Use
FIG. 8 Non-Lethal Biochemical Weapons: Market Value Share By Region
FIG. 9 Non-Lethal Biochemical Weapons: Global Market Value Share Analysis By Operation Type, 2016 and 2024
FIG. 10 Defensive Market, 2016 – 2024, USD Mn
FIG. 11 Offensive Market, 2016 – 2024, USD Mn
FIG. 12 Genetic Attack Market, 2016 – 2024, USD Mn
FIG. 13 Global Market Value Share Analysis By Product Type, 2016 and 2024
FIG. 14 Directed Energy Market, 2016 – 2024, USD Mn
FIG. 15 Direct Contact Market, 2016 – 2024
FIG. 16 Non-Lethal Biochemical Weapons: Global Market Value Share Analysis By Production Type, 2016 and 2014
FIG. 17 Military Forces Market, 2016 – 2024, USD Mn
FIG. 18 Law Enforcement Agencies Market, 2016 – 2024, USD Mn
FIG. 19 North America Non-Lethal Biochemical Weapons Market, Value Share Analysis, By Operation Type, 2016 and 2024
FIG. 20 North America Non-Lethal Biochemical Weapons Market, Value Share Analysis, By Product Type, 2016 and 2024
FIG. 21 North America Non-Lethal Biochemical Weapons Market, Value Share Analysis, By End Use, 2016 and 2024
FIG. 22 North America Non-Lethal Biochemical Weapons Market, Value Share Analysis, By Country, 2016 and 2024
FIG. 23 U.S. Non-Lethal Biochemical Weapons Market, 2016 – 2024, USD Mn
FIG. 24 Canada Non-Lethal Biochemical Weapons Market, 2016 – 2024, USD Mn
FIG. 25 Mexico Non-Lethal Biochemical Weapons Market, 2016 – 2024, USD Mn
FIG. 26 Canada Non-Lethal Biochemical Weapons Market, 2016 – 2024, USD Mn
FIG. 27 Europe Non-Lethal Biochemical Weapons Market Value Share Analysis, By Product Type, 2016 and 2024
FIG. 28 Europe Non-Lethal Biochemical Weapons Market, Value Share Analysis, By End Use, 2016 and 2024
FIG. 29 Europe Non-Lethal Biochemical Weapons Market, Value Share Analysis, By Country, 2016 and 2024
FIG. 30 U.K. Non-Lethal Biochemical Weapons Market, 2016 – 2024, USD Mn
FIG. 31 Germany Non-Lethal Biochemical Weapons Market, 2016 – 2024, USD Mn
FIG. 32 France Non-Lethal Biochemical Weapons Market, 2016 – 2024, USD Mn
FIG. 33 Italy Non-Lethal Biochemical Weapons Market, 2016 – 2024, USD Mn
FIG. 34 Rest of Europe Non-Lethal Biochemical Weapons Market, 2016 – 2024, USD Mn
FIG. 35 Asia Pacific Non-Lethal Biochemical Weapons Market, Value Share Analysis, By Operation Type, 2016 and 2024
FIG. 36 Asia Pacific Non-Lethal Biochemical Weapons Market, Value Share Analysis, By Product Type, 2016 and 2024
FIG. 37 Asia Pacific Non-Lethal Biochemical Weapons Market, Value Share Analysis, By End Use, 2016 and 2024
FIG. 38 Asia Pacific Non-Lethal Biochemical Weapons Market, Value Share Analysis, By Country, 2016 and 2024
FIG. 39 China Non-Lethal Biochemical Weapons Market, 2016 – 2024, USD Mn
FIG. 40 Japan Non-Lethal Biochemical Weapons Market, 2016 – 2024, USD Mn
FIG. 41 India Non-Lethal Biochemical Weapons Market, 2016 – 2024, USD Mn
FIG. 42 South Korea Non-Lethal Biochemical Weapons Market, 2016 – 2024, USD Mn
FIG. 43 Asia Pacific Non-Lethal Biochemical Weapons Market, 2016 – 2024, USD Mn
FIG. 44 Middle East and Africa Non-Lethal Biochemical Weapons Market, Value Share Analysis, By Operation Type, 2016 and 2024
FIG. 45 Middle East and Africa Non-Lethal Biochemical Weapons Market, Value Share Analysis, By Product Type, 2016 and 2024
FIG. 46 Middle East and Africa Non-Lethal Biochemical Weapons Market, Value Share Analysis, By End Use, 2016 and 2024
FIG. 47 Middle East and Africa Non-Lethal Biochemical Weapons Market, Value Share Analysis, By Country, 2016 and 2024
FIG. 48 UAE Non-Lethal Biochemical Weapons Market, 2016 – 2024, USD Mn
FIG. 49 Saudi Arabia Non-Lethal Biochemical Weapons Market, 2016 – 2024, USD Mn
FIG. 50 South Africa Non-Lethal Biochemical Weapons Market, 2016 – 2024, USD Mn
FIG. 51 Rest of MEA Non-Lethal Biochemical Weapons Market, 2016 – 2024, USD Mn
FIG. 52 Latin america Non-Lethal Biochemical Weapons Market, Value Share Analysis, By Operation Type, 2016 and 2024
FIG. 53 Latin America Non-Lethal Biochemical Weapons Market Value Share Analysis, By Product Type, 2016 and 2024
FIG. 54 Latin America Non-Lethal Biochemical Weapons Market Value Share Analysis, By End Use, 2016 and 2024
FIG. 55 Latin America Non-Lethal Biochemical Weapons Market Value Share Analysis, By Country, 2016 and 2024
FIG. 56 Brazil Non-Lethal Biochemical Weapons Market, 2016 – 2024, USD Mn
FIG. 57 Argentina Non-Lethal Biochemical Weapons Market, 2016 – 2024, USD Mn
FIG. 68 Rest of Latin America Non-Lethal Biochemical Weapons Market, 2016 – 2024, USD Mn
Copyright © Transparency Market Research, Inc. All Rights reserved
Trust Online

Non-lethal Biochemical Weapons Market