
Reports
Reports
Gamification in Rehabilitation through VR Promises Early Treatment in Stroke Patients
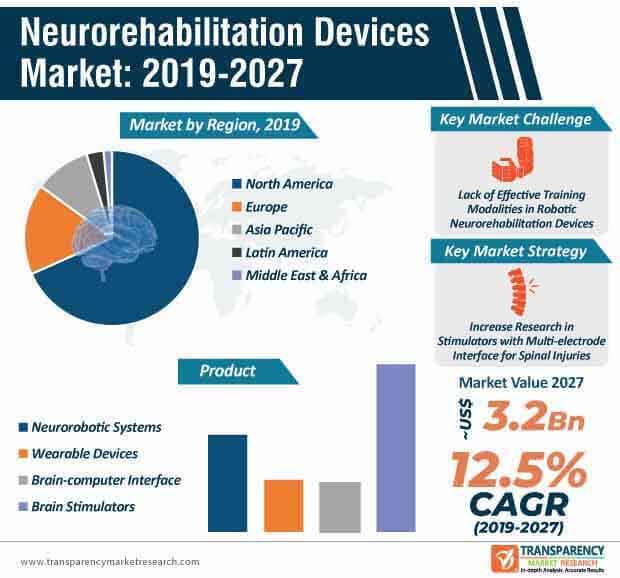
With growing prominence of the startup culture, neuroscientists are exploring opportunities in virtual reality (VR) to speed up recovery in stroke patients. For instance, MindMaze - a startup neurotechnology company won several accolades for gamification in rehabilitation catering to stroke survivors with the help of VR and neuroscience. This is evident since stroke application segment accounted for 47% of the neurorehabilitation devices market in 2018. Thus, companies in the neurorehabilitation devices market should collaborate with neuroscientists to deliver inspiring results in stroke rehabilitation.
Healthcare companies are harnessing the advantages of VR, since there is only a short window when the brain can bounce back in early stages of treatment. Hence, VR and neuroscience have helped to maximize the potential for full recovery. Companies are increasing efforts to increase the availability of VR devices in hospitals.
New Multi-electrode Stimulation Proves Efficacious in Treatment of Spinal Cord Injuries
New technologies in electrostimulation are engulfing the neurorehabilitation devices market. Researchers are increasing R&D to develop a new multi-electrode to stimulate the spinal cord in different points to improve patient quality of life. For instance, the international team of Sissa (International School for Advanced Studies), Italy, collaborated with the researchers at the University of California, Los Angeles and the University of Leeds to develop a new multi-electrode for spinal cord stimulation. Thus, companies in the market for neurorehabilitation devices should collaborate with researchers to advance in spinal cord stimulation.
The new electrode is capable of deploying diversified electric message to different fibers of the cord in a targeted and independent manner. This innovation has aided in fast recovery of voluntary limb movements. Hence, companies in the neurorehabilitation devices market are increasing their research efforts in the field of electrical stimulation to enhance recovery of motor functions.
The novel approach of electric stimulation of the spinal cord has been receiving attention in recent years. This is evident since the brain & spinal cord injury application segment is predicted for exponential growth in the market for neurorehabilitation devices. The global neurorehabilitation devices market is estimated to reach a revenue of US$ 3.2 Bn by the end of 2027.
Companies Combine Robotic Neurorehabilitation Devices with Non-invasive Brain Machine Interfaces
Robotic neurorehabilitation is acquiring prominence in the neurorehabilitation devices market. With the introduction of novel technologies, companies are able to enhance capabilities of robots to offer cost-effective solutions in clinical practice. However, lack of effective training modalities in these robotic devices poses as a restraint for healthcare companies in the neurorehabilitation devices market. Hence, companies are increasing their efficacy to design robotic devices with predefined training modalities depending on the appropriate control strategies.
Companies in the neurorehabilitation devices market are developing robots with passive and active training modalities where the robot is capable of imposing and modulating trajectories with respect to the patient’s intention to move. Companies in the neurorehabilitation devices market combining robot-aided neurorehabilitation with non-invasive brain machine interfaces. Robot-aided neurorehabilitation in combination with proper training regimen is also found to improve patient recovery. Companies are increasing the production of assistive controllers to aid movement in impaired limbs. Various strategies such as assist-as-needed are being widely employed to reduce patient reliance on robots to accomplish the rehabilitative task.
VR and FES Hold Promising Future in Wearable Devices
Since wearable technology is gaining prominence in every day-life applications, companies in the neurorehabilitation devices market are innovating in wristbands that have the potential to rehabilitate patients who have suffered from stroke. As such, wearable devices product segment of the neurorehabilitation devices market is projected for aggressive growth and the global neurorehabilitation devices market is projected to expand at a staggering CAGR of 12.5% during the forecast period.
Likewise, Facebook agreed to acquire brain-computing startup CTRL-labs that specializes in the neural interface technology and develops wristbands that delivers machine-interpretable commands. With the help of these novel wristbands, companies in the market for neurorehabilitation devices are tapping opportunities to improve recovery in patients suffering from multiple sclerosis, Parkinson’s disease, and other neurodegenerative diseases. Companies in the market for neurorehabilitation devices are also experimenting with VR systems and functional electrical stimulation (FES) to innovate in wearable technology.
Analysts’ Viewpoint
Gamifying rehabilitation for stroke survivors with the help of VR has set the benchmark for innovation in the neurorehabilitation devices market. Neurorobotic systems and non-invasive brain stimulation have helped to enhance the quality and intensity of neurorehabilitation. Non-invasive brain stimulation is being combined with advanced technologies, such as functional MRI and near infrared spectroscopy, to treat neurological disorders.
Electric stimulation is acquiring popularity to restore lost functionality due to spinal cord injuries. However, physiological stimulus is lost after injury, which poses as a hurdle for healthcare companies. Hence, companies should innovate in the new multi-electrode stimulation technology to make the injured spinal cord more responsive to weak incoming messages coming from the brain.
Neurorehabilitation Devices Market: Overview
Rise in Prevalence of Neurological Disorders and Surge in Awareness about Usage and Benefits of Robotic Neurorehabilitation: A Key Driver
Focus on Geographic Expansion
Long Implantation Procedure, High Cost, and Lack of Skilled Professionals to Hamper Market
Neurorehabilitation Devices Market: Competition Landscape
Neurorehabilitation Devices Market: Key Developments
Growing Prevalence of Neurological Disorders to Serve as a Vital Growth Booster for the Neurorehabilitation Devices Market
The incidence of neurological diseases is increasing at a rapid pace across the globe. The increase in neurological disorders such as Parkinson’s disease, stroke, and others will bring intensive growth opportunities for the neurorehabilitation devices market across the assessment period of 2019-2027.
Neurorehabilitation devices market is estimated to reach a revenue of US$ 3.2 Bn by the end of 2027
Neurorehabilitation devices market is projected to expand at a CAGR of 12.5% from 2019 to 2027
Neurorehabilitation devices market is driven by rise in prevalence of neurological disorders, aging population and technological advancements
Key players in the global neurorehabilitation devices market include Bionik Laboratories Corp., Ekso Bionics, ReWalk Robotics, Tyromotion GmbH, Boston Scientific Corporation, Medtronic plc
1. Preface
1.1. Market Definition and Scope
1.2. Market Segmentation
1.3. Key Research Objectives
1.4. Research Highlights
2. Assumptions and Research Methodology
3. Executive Summary: Global Neurorehabilitation Devices Market
4. Market Overview
4.1. Introduction
4.1.1. Type Definition
4.1.2. Industry Evolution / Developments
4.2. Overview
4.3. Market Dynamics
4.3.1. Drivers
4.3.2. Restraints
4.3.3. Opportunities
4.4. Global Neurorehabilitation Devices Market Analysis and Forecast, 2017–2027
4.4.1. Market Revenue Projections (US$ Mn)
4.5. Porter’s Five Force Analysis
5. Key Insights
5.1. Regulatory Scenario, by Region/Globally
5.2. Funding
5.3. Robotics Mergers & Acquisitions
5.4. Pricing Assessment
5.5. Technological Advancements
5.6. Recent Developments (Product approval, Installation, Launch, Partnership/Agreement)
6. Global Neurorehabilitation Devices Market Analysis and Forecast, by Application
6.1. Introduction & Definition
6.1.1. Key Findings / Developments
6.2. Global Neurorehabilitation Devices Market Value Forecast, by Application, 2017–2027
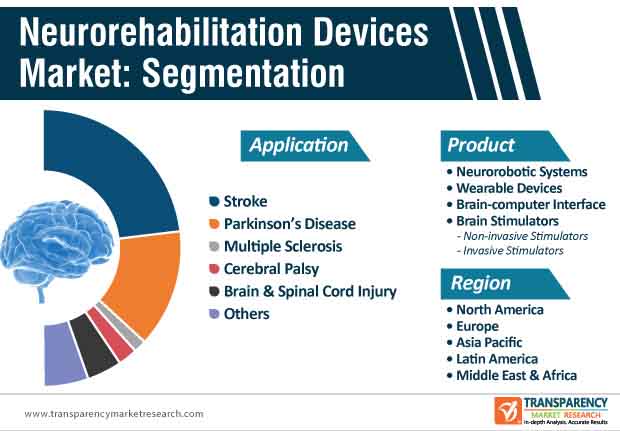
6.2.1. Stroke
6.2.2. Parkinson’s Disease
6.2.3. Multiple Sclerosis
6.2.4. Cerebral Palsy
6.2.5. Brain and Spinal Cord Injury
6.2.6. Others
6.3. Global Neurorehabilitation Devices Market Attractiveness, by Application
7. Global Neurorehabilitation Devices Market Analysis and Forecast, by Product
7.1. Introduction & Definition
7.1.1. Key Findings / Developments
7.2. Global Neurorehabilitation Devices Market Value Forecast, by Product, 2017–2027
7.2.1. Neurorobotic Systems
7.2.2. Wearable Devices
7.2.3. Brain-computer Interface
7.2.4. Brain Stimulators
7.2.4.1. Non-invasive Stimulators
7.2.4.2. Invasive Stimulators
7.3. Global Neurorehabilitation Devices Market Attractiveness, by Product
8. Global Neurorehabilitation Devices Market Analysis and Forecast, by Region
8.1. Key Findings
8.2. Global Neurorehabilitation Devices Market Value Forecast, by Region
8.2.1. North America
8.2.2. Europe
8.2.3. Asia Pacific
8.2.4. Latin America
8.2.5. Middle East & Africa
8.3. North America Neurorehabilitation Devices Market Attractiveness, by Region
9. North America Neurorehabilitation Devices Market Analysis and Forecast
9.1. Introduction
9.1.1. Key Findings
9.2. North America Neurorehabilitation Devices Market Value (US$ Mn) Forecast, by Application, 2017–2027
9.2.1. Stroke
9.2.2. Parkinson’s Disease
9.2.3. Multiple Sclerosis
9.2.4. Cerebral Palsy
9.2.5. Brain and Spinal Cord Injury
9.2.6. Others
9.3. North America Neurorehabilitation Devices Market Value (US$ Mn) Forecast, by Product, 2017–2027
9.3.1. Neurorobotic Systems
9.3.2. Wearable Devices
9.3.3. Brain-computer Interface
9.3.4. Brain Stimulators
9.3.4.1. Non-invasive Stimulators
9.3.4.2. Invasive Stimulators
9.4. North America Neurorehabilitation Devices Market Value (US$ Mn) Forecast, by Country, 2017–2027
9.4.1. U.S.
9.4.2. Canada
9.5. North America Neurorehabilitation Devices Market Attractiveness Analysis
9.5.1. By Application
9.5.2. By Product
9.5.3. By Country
10. Europe Neurorehabilitation Devices Market Analysis and Forecast
10.1. Introduction
10.1.1. Key Findings
10.2. Europe Neurorehabilitation Devices Market Value (US$ Mn) Forecast, by Application, 2017–2027
10.2.1. Stroke
10.2.2. Parkinson’s Disease
10.2.3. Multiple Sclerosis
10.2.4. Cerebral Palsy
10.2.5. Brain and Spinal Cord Injury
10.2.6. Others
10.3. Europe Neurorehabilitation Devices Market Value (US$ Mn) Forecast, by Product, 2017–2027
10.3.1. Neurorobotic Systems
10.3.2. Wearable Devices
10.3.3. Brain-computer Interface
10.3.4. Brain Stimulators
10.3.4.1. Non-invasive Stimulators
10.3.4.2. Invasive Stimulators
10.4. Europe Neurorehabilitation Devices Market Value (US$ Mn) Forecast, by Country/Sub-region, 2017–2027
10.4.1. Germany
10.4.2. U.K.
10.4.3. France
10.4.4. Spain
10.4.5. Italy
10.4.6. Rest of Europe
10.5. Europe Neurorehabilitation Devices Market Attractiveness Analysis
10.5.1. By Application
10.5.2. By Product
10.5.3. By Country/Sub-region
11. Asia Pacific Neurorehabilitation Devices Market Analysis and Forecast
11.1. Introduction
11.1.1. Key Findings
11.2. Asia Pacific Neurorehabilitation Devices Market Value (US$ Mn) Forecast, by Application, 2017–2027
11.2.1. Stroke
11.2.2. Parkinson’s Disease
11.2.3. Multiple Sclerosis
11.2.4. Cerebral Palsy
11.2.5. Brain and Spinal Cord Injury
11.2.6. Others
11.3. Asia Pacific Neurorehabilitation Devices Market Value (US$ Mn) Forecast, by Product, 2017–2027
11.3.1. Neurorobotic Systems
11.3.2. Wearable Devices
11.3.3. Brain-computer Interface
11.3.4. Brain Stimulators
11.3.4.1. Non-invasive Stimulators
11.3.4.2. Invasive Stimulators
11.4. Asia Pacific Neurorehabilitation Devices Market Value (US$ Mn) Forecast, by Country/Sub-region, 2017–2027
11.4.1. China
11.4.2. Japan
11.4.3. India
11.4.4. Australia & New Zealand
11.4.5. Rest of Asia Pacific
11.5. Asia Pacific Neurorehabilitation Devices Market Attractiveness Analysis
11.5.1. By Application
11.5.2. By Product
11.5.3. By Country/Sub-region
12. Latin America Neurorehabilitation Devices Market Analysis and Forecast
12.1. Introduction
12.1.1. Key Findings
12.2. Latin America Neurorehabilitation Devices Market Value (US$ Mn) Forecast, by Application, 2017–2027
12.2.1. Stroke
12.2.2. Parkinson’s Disease
12.2.3. Multiple Sclerosis
12.2.4. Cerebral Palsy
12.2.5. Brain and Spinal Cord Injury
12.2.6. Others
12.3. Latin America Neurorehabilitation Devices Market Value (US$ Mn) Forecast, by Product, 2017–2027
12.3.1. Neurorobotic Systems
12.3.2. Wearable Devices
12.3.3. Brain-computer Interface
12.3.4. Brain Stimulators
12.3.4.1. Non-invasive Stimulators
12.3.4.2. Invasive Stimulators
12.4. Latin America Neurorehabilitation Devices Market Value (US$ Mn) Forecast, by Country/Sub-region, 2017–2027
12.4.1. Brazil
12.4.2. Mexico
12.4.3. Rest of Latin America Latin America
12.5. Latin America Neurorehabilitation Devices Market Attractiveness Analysis
12.5.1. By Application
12.5.2. By Product
12.5.3. By Country/Sub-region
13. Middle East & Africa Neurorehabilitation Devices Market Analysis and Forecast
13.1. Introduction
13.1.1. Key Findings
13.2. Middle East & Africa Neurorehabilitation Devices Market Value (US$ Mn) Forecast, by Application, 2017–2027
13.2.1. Stroke
13.2.2. Parkinson’s Disease
13.2.3. Multiple Sclerosis
13.2.4. Cerebral Palsy
13.2.5. Brain and Spinal Cord Injury
13.2.6. Others
13.3. Middle East & Africa Neurorehabilitation Devices Market Value (US$ Mn) Forecast, by Product, 2017–2027
13.3.1. Neurorobotic Systems
13.3.2. Wearable Devices
13.3.3. Brain-computer Interface
13.3.4. Brain Stimulators
13.3.4.1. Non-invasive Stimulators
13.3.4.2. Invasive Stimulators
13.4. Middle East & Africa Neurorehabilitation Devices Market Value (US$ Mn) Forecast, by Country/Sub-region, 2017–2027
13.4.1. GCC Countries
13.4.2. South Africa
13.4.3. Rest of Middle East & Africa
13.5. Middle East & Africa Neurorehabilitation Devices Market Attractiveness Analysis
13.5.1. By Application
13.5.2. By Product
13.5.3. By Country/Sub-region
14. Competition Landscape
14.1. Market Player - Competition Matrix (by Tier and Size of companies)
14.2. Market Share / Position Analysis by Company (2016)
14.3. Competitive Business Strategies
14.4. Company Profiles
14.4.1. Bionik Laboratories Corp.
14.4.1.1. Company Overview (HQ, Business Segments, Employee Strength)
14.4.1.2. Growth Strategies
14.4.1.3. SWOT Analysis
14.4.2. Ekso Bionics
14.4.2.1. Company Overview (HQ, Business Segments, Employee Strength)
14.4.2.2. Growth Strategies
14.4.2.3. SWOT Analysis
14.4.3. Kinestica
14.4.3.1. Company Overview (HQ, Business Segments, Employee Strength)
14.4.3.2. Growth Strategies
14.4.3.3. SWOT Analysis
14.4.4. Neurostyle Pte Ltd
14.4.4.1. Company Overview (HQ, Business Segments, Employee Strength)
14.4.4.2. Growth Strategies
14.4.4.3. SWOT Analysis
14.4.5. Saebo, Inc.
14.4.5.1. Company Overview (HQ, Business Segments, Employee Strength)
14.4.5.2. Growth Strategies
14.4.5.3. SWOT Analysis
14.4.6. Reha Technology AG
14.4.6.1. Company Overview (HQ, Business Segments, Employee Strength)
14.4.6.2. Growth Strategies
14.4.6.3. SWOT Analysis
14.4.7. MindMaze Holding SA
14.4.7.1. Company Overview (HQ, Business Segments, Employee Strength)
14.4.7.2. Growth Strategies
14.4.7.3. SWOT Analysis
14.4.8. Neuro Device Group S.A.
14.4.8.1. Company Overview (HQ, Business Segments, Employee Strength)
14.4.8.2. Growth Strategies
14.4.8.3. SWOT Analysis
14.4.9. DIH Technologies Corporation (Hocoma)
14.4.9.1. Company Overview (HQ, Business Segments, Employee Strength)
14.4.9.2. Growth Strategies
14.4.9.3. SWOT Analysis
14.4.10. ReWalk Robotics
14.4.10.1. Company Overview (HQ, Business Segments, Employee Strength)
14.4.10.2. Growth Strategies
14.4.10.3. SWOT Analysis
14.4.11. Tyromotion GmbH
14.4.11.1. Company Overview (HQ, Business Segments, Employee Strength)
14.4.11.2. Growth Strategies
14.4.11.3. SWOT Analysis
14.4.12. Boston Scientific Corporation
14.4.12.1. Company Overview (HQ, Business Segments, Employee Strength)
14.4.12.2. Growth Strategies
14.4.12.3. SWOT Analysis
14.4.13. Medtronic plc
14.4.13.1. Company Overview (HQ, Business Segments, Employee Strength)
14.4.13.2. Growth Strategies
14.4.13.3. SWOT Analysis
List of Tables
Table 01: Number of DALYs for neurological disorders and as percentage of global DALYs projected for 2005, 2015, and 2030
Table 02: Neurological disorders as percentage of total DALYs by WHO region, 2005
Table 03: Global Neurorehabilitation Devices Market Value (US$ Mn) Forecast, by Product, 2017–2027
Table 04: Global Neurorehabilitation Devices Market Value (US$ Mn) Forecast, by Brain Stimulators, 2017–2027
Table 05: Global Neurorehabilitation Devices Market Value (US$ Mn) Forecast, by Application, 2017–2027
Table 06: Global Neurorehabilitation Devices Market Value (US$ Mn) Forecast, by Region, 2017–2027
Table 07: North America Neurorehabilitation Devices Market Value (US$ Mn) Forecast, by Country, 2017–2027
Table 08: North America Neurorehabilitation Devices Market Value (US$ Mn) Forecast, by Product, 2017–2027
Table 09: North America Neurorehabilitation Devices Market Value (US$ Mn) Forecast, by Brain Stimulators, 2017–2027
Table 10: North America Neurorehabilitation Devices Market Value (US$ Mn) Forecast, by Application, 2017?2027
Table 11: Europe Neurorehabilitation Devices Market Value (US$ Mn) Forecast, by Country/Sub-region, 2017–2027
Table 12: Europe Neurorehabilitation Devices Market Value (US$ Mn) Forecast, by Product, 2017–2027
Table 13: Europe Neurorehabilitation Devices Market Value (US$ Mn) Forecast, by Brain Stimulators, 2017–2027
Table 14: Europe Neurorehabilitation Devices Market Value (US$ Mn) Forecast, by Application, 2017?2027
Table 15: Asia Pacific Neurorehabilitation Devices Market Value (US$ Mn) Forecast, by Country/Sub-region, 2017–2027
Table 16: Asia Pacific Neurorehabilitation Devices Market Value (US$ Mn) Forecast, by Product, 2017–2027
Table 17: Asia Pacific Neurorehabilitation Devices Market Value (US$ Mn) Forecast, by Brain Stimulators, 2017–2027
Table 18: Asia Pacific Neurorehabilitation Devices Market Value (US$ Mn) Forecast, by Application, 2017?2027
Table 19: Latin America Neurorehabilitation Devices Market Value (US$ Mn) Forecast, by Country/Sub-region, 2017–2027
Table 20: Latin America Neurorehabilitation Devices Market Value (US$ Mn) Forecast, by Product, 2017–2027
Table 21: Latin America Neurorehabilitation Devices Market Value (US$ Mn) Forecast, by Brain Stimulators, 2017–2027
Table 22: Latin America Neurorehabilitation Devices Market Value (US$ Mn) Forecast, by Application, 2017?2027
Table 23: Middle East & Africa Neurorehabilitation Devices Market Value (US$ Mn) Forecast, by Country/Sub-region, 2017–2027
Table 24: Middle East & Africa Neurorehabilitation Devices Market Value (US$ Mn) Forecast, by Product, 2017–2027
Table 25: Middle East & Africa Neurorehabilitation Devices Market Value (US$ Mn) Forecast, by Brain Stimulators, 2017–2027
Table 26: Middle East & Africa Neurorehabilitation Devices Market Value (US$ Mn) Forecast, by Application, 2017?2027
List of Figures
Figure 01: Global Neurorehabilitation Devices Market Value (US$ Mn) Forecast, 2017–2027
Figure 02: Global Neurorehabilitation Devices Market Value Share (%), by Product, 2018
Figure 03: Global Neurorehabilitation Devices Market Value Share (%), by Brain Stimulators, 2018
Figure 04: Global Neurorehabilitation Devices Market Value Share (%), by Application, 2018
Figure 05: Global Neurorehabilitation Devices Market Value Share (%), by Region, 2018
Figure 6: Global Neurorehabilitation Devices Market Value Share (%), by Product, 2018 and 2027
Figure 7: Global Neurorehabilitation Devices Market Attractiveness, by Product, 2019–2027
Figure 8: Global Neurorehabilitation Devices Market Revenue (US$ Mn) and Y-o-Y Growth (%), by Neurorobotic Systems, 2017–2027
Figure 9: Global Neurorehabilitation Devices Market Revenue (US$ Mn) and Y-o-Y Growth (%), by Wearable Devices, 2017–2027
Figure 10: Global Neurorehabilitation Devices Market Revenue (US$ Mn) and Y-o-Y Growth (%), by Brain Stimulators, 2017–2027
Figure 11: Global Neurorehabilitation Devices Market Revenue (US$ Mn) and Y-o-Y Growth (%), by Brain-computer Interface, 2017–2027
Figure 12: Global Neurorehabilitation Devices Market Value Share (%), by Application, 2018 and 2027
Figure 13: Global Neurorehabilitation Devices Market Attractiveness, by Application, 2019–2027
Figure 14: Global Neurorehabilitation Devices Market Revenue (US$ Mn) and Y-o-Y Growth (%), by Stroke,
Figure 15: Global Neurorehabilitation Devices Market Revenue (US$ Mn) and Y-o-Y Growth (%), by Parkinson’s Disease, 2017–2027
Figure 16: Global Neurorehabilitation Devices Market Revenue (US$ Mn) and Y-o-Y Growth (%), by Multiple Sclerosis, 2017–2027
Figure 17: Global Neurorehabilitation Devices Market Revenue (US$ Mn) and Y-o-Y Growth (%), by Cerebral Palsy, 2017–2027
Figure 18: Global Neurorehabilitation Devices Market Revenue (US$ Mn) and Y-o-Y Growth (%), by Brain and Spinal Cord Injury, 2017–2027
Figure 19: Global Neurorehabilitation Devices Market Revenue (US$ Mn) and Y-o-Y Growth (%), by Others,
Figure 20: Global Neurorehabilitation Devices Market Value Share Analysis, by Region, 2018 and 2027
Figure 21: Global Neurorehabilitation Devices Market Attractiveness Analysis, by Region, 2019–2027
Figure 22: North America Neurorehabilitation Devices Market Value (US$ Mn) and Y-o-Y Growth (%) Forecast, 2017–2027
Figure 23: North America Neurorehabilitation Devices Market Value Share Analysis, by Country, 2018 and 2027
Figure 24: North America Neurorehabilitation Devices Market Attractiveness Analysis, by Country, 2019–2027
Figure 25: North America Neurorehabilitation Devices Market Value Share (%), by Product, 2018 and 2027
Figure 26: North America Neurorehabilitation Devices Market Attractiveness, by Product, 2019–2027
Figure 27: North America Neurorehabilitation Devices Market Value Share (%), by Application, 2018 and 2027
Figure 28: North America Neurorehabilitation Devices Market Attractiveness, by Application, 2019–2027
Figure 29: Europe Neurorehabilitation Devices Market Value (US$ Mn) and Y-o-Y Growth (%) Forecast, 2017–2027
Figure 30: Europe Neurorehabilitation Devices Market Value Share Analysis, by Country/Sub-region, 2018 and 2027
Figure 31: Europe Neurorehabilitation Devices Market Attractiveness Analysis, by Country/Sub-region, 2019–2027
Figure 32: Europe Neurorehabilitation Devices Market Value Share (%), by Product, 2018 and 2027
Figure 33: Europe Neurorehabilitation Devices Market Attractiveness, by Product, 2019–2027
Figure 34: Europe Neurorehabilitation Devices Market Value Share (%), by Application, 2018 and 2027
Figure 35: Europe Neurorehabilitation Devices Market Attractiveness, by Application, 2019–2027
Figure 36: Asia Pacific Neurorehabilitation Devices Market Value (US$ Mn) and Y-o-Y Growth (%) Forecast, 2017–2027
Figure 37: Asia Pacific Neurorehabilitation Devices Market Value Share Analysis, by Country/Sub-region, 2018 and 2027
Figure 38: Asia Pacific Neurorehabilitation Devices Market Attractiveness Analysis, by Country/Sub-region, 2019–2027
Figure 39: Asia Pacific Neurorehabilitation Devices Market Value Share (%), by Product, 2018 and 2027
Figure 40: Asia Pacific Neurorehabilitation Devices Market Attractiveness, by Product, 2019–2027
Figure 41: Asia Pacific Neurorehabilitation Devices Market Value Share (%), by Application, 2018 and 2027
Figure 42: Asia Pacific Neurorehabilitation Devices Market Attractiveness, by Application, 2019–2027
Figure 43: Latin America Neurorehabilitation Devices Market Value (US$ Mn) and Y-o-Y Growth (%) Forecast, 2017–2027
Figure 44: Latin America Neurorehabilitation Devices Market Value Share Analysis, by Country/Sub-region, 2018 and 2027
Figure 45: Latin America Neurorehabilitation Devices Market Attractiveness Analysis, by Country/Sub-region, 2019–2027
Figure 46: Latin America Neurorehabilitation Devices Market Value Share (%), by Product, 2018 and 2027
Figure 47: Latin America Neurorehabilitation Devices Market Attractiveness, by Product, 2019–2027
Figure 48: Latin America Neurorehabilitation Devices Market Value Share (%), by Application, 2018 and 2027
Figure 49: Latin America Neurorehabilitation Devices Market Attractiveness, by Application, 2019–2027
Figure 50: Middle East & Africa Neurorehabilitation Devices Market Value (US$ Mn) and Y-o-Y Growth (%) Forecast, 2017–2027
Figure 51: Middle East & Africa Neurorehabilitation Devices Market Value Share Analysis, by Country/Sub-region, 2018 and 2027
Figure 52: Middle East & Africa Neurorehabilitation Devices Market Attractiveness Analysis, by Country/Sub-region, 2019–2027
Figure 53: Middle East & Africa Neurorehabilitation Devices Market Value Share (%), by Product, 2018 and 2027
Figure 54: Middle East & Africa Neurorehabilitation Devices Market Attractiveness, by Product, 2019–2027
Figure 55: Middle East & Africa Neurorehabilitation Devices Market Value Share (%), by Application, 2018 and 2027
Figure 56: Middle East & Africa Neurorehabilitation Devices Market Attractiveness, by Application, 2019–2027
Figure 57: Bionik Laboratories Corp. R&D Expenses and General & Administrative Expenses (US$ Mn), 2018–2019
Figure 58: Bionik Laboratories Corp. Revenue (US$ Mn) and Y-o-Y Growth (%), 2017–2019
Figure 59: Bionik Laboratories Corp. Revenue (US$ Mn) and Y-o-Y Growth (%), 2013–2018
Figure 60: Bionik Laboratories Corp. R&D Expenses (US$ Mn), 2017 & 2018
Figure 61: Bionik Laboratories Corp. Breakdown of Net Sales (%), by Region, 2018
Figure 62: Bionik Laboratories Corp. Breakdown of Net Sales (%), by Business Segment, 2018
Figure 63: ReWalk Robotics Revenue (US$ Mn) and Y-o-Y Growth (%), 2014–2018
Figure 64: ReWalk Robotics R&D Expenses (US$ Mn), 2016–2018
Figure 65: ReWalk Robotics Gross Profit (US$ Mn), 2016–2018
Figure 66: ReWalk Robotics Breakdown of Net Sales (%), by Region, 2018
Figure 67: ReWalk Robotics Breakdown of Net Sales (%), by Business Segment, 2018
Figure 68 Boston Scientific Corporation Revenue (US$ Bn) & Y-o-Y Growth (%), 2015–2018
Figure 69: Boston Scientific Corporation Breakdown of Net Sales (%), by Business Segment, 2018
Figure 70: Boston Scientific Corporation R&D Intensity and Sales & Marketing Intensity – Company Level, (US$ Mn), 2017–2018
Figure 71: Medtronic plc Revenue (US$ Bn) and Y-o-Y Growth (%), 2013–2018
Figure 72: Medtronic plc R&D Intensity and Sales & Marketing Intensity – Company Level, 2017–2018
Figure 73: Medtronic plc Breakdown of Net Sales, by Business Segment, 2018
Figure 74: Medtronic plc Breakdown of Net Sales, by Region, 2018
Copyright © Transparency Market Research, Inc. All Rights reserved
Trust Online

Neurorehabilitation Devices Market