

Reports
Reports
The global chitosan market size was valued at USD 4.2 Billion in 2025 and is projected to reach USD 19.0 Billion by 2036, expanding at a CAGR of 14.7% from 2026 to 2036. The market is primarily driven by rising demand for sustainable and biodegradable materials.
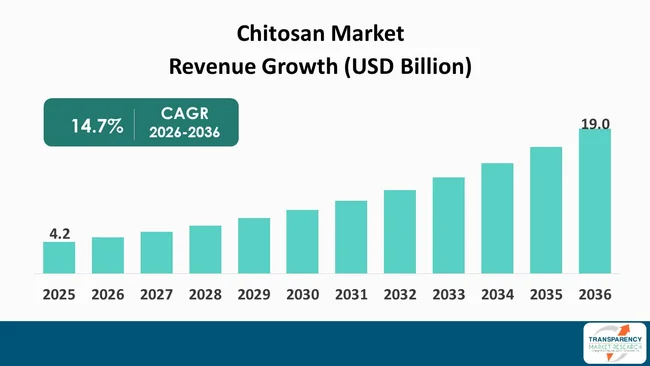
The chitosan market is experiencing strong growth due to rising demand for biodegradable, antimicrobial, biocompatible, and sustainable materials across water treatment, agriculture, food packaging, pharmaceuticals, cosmetics, and biomedical applications. Chitosan is derived mainly from waste shells of crustaceans such as shrimp and crab shells. Production typically involves cleaning and grinding crustacean shells, followed by demineralization and deproteinization to obtain chitin, which is subsequently deacetylated through alkaline treatment to produce chitosan. With the focus on the concept of circular economy, manufacturers are being encouraged to utilize seafood-processing waste as an economically valuable raw material.
Manufacturers are making efforts to increase their capacity, produce high purity products, develop formulations for specific applications and optimize the manufacturing process owing to rising demand from pharmaceutical, food, agricultural and industrial consumers. Manufacturers are exploring innovative processing methods, including enzymatic processing, to improve yield, consistency, and sustainability. Moreover, collaborations with R&D institutions and investment in technologies for valorization of seafood waste are helping in commercializing these products.
Chitosan is a biodegradable, biocompatible, and natural polysaccharide obtained from the deacetylation of chitin, which is mainly extracted from the exoskeleton of shrimp, crabs, and other crustaceans. Chitosan production typically involves collecting and cleaning shell waste, followed by demineralization and deproteinization to obtain chitin, which is subsequently treated with an alkaline solution to produce chitosan. Because of its antimicrobial, film-forming, adsorption, and moisture-retaining properties, chitosan is utilized in many industries. The applications include water and wastewater treatment, agriculture, food packaging and preservation, pharmaceuticals, cosmetics, biotechnology, and biomedical products. Chitosan can bind heavy metals and other pollutants, making it suitable for water-treatment applications. Its biodegradability also supports its use as a sustainable alternative to certain synthetic polymers.
| Attribute | Detail |
|---|---|
| Chitosan Market Drivers |
|
The growing trend towards sustainable and biodegradable materials is a key factor boosting the market for chitosan. Chitosan is produced from chitin extracted primarily from shrimp, crab, and other crustacean shells. This provides a renewable raw-material pathway based on seafood-processing byproducts. The fact that it is biodegradable and biocompatible makes it an alternative to the synthetic polymers made from petroleum in certain applications. Growing worries about plastic waste, environmental pollution, and non-biodegradability of traditional plastics push manufacturers to consider bio-based products for packaging, coating, films, and other uses.
Growing emphasis on circular-economy practices and industrial-waste utilization is also supporting demand for chitosan. Seafood processing businesses produce large amounts of shell waste, which is a problem from the waste management perspective. Converting shell waste into chitosan can create additional economic value while reducing waste-management challenges. Therefore, manufacturers are looking more into combined processing techniques allowing recovery of chitin and chitosan along with other valuable materials from seafood waste.
Major chitosan suppliers are simultaneously working to enhance extraction yields, quality control, purity, and functionalities to increase the number of applications. The improvements in manufacturing processes and development of application-oriented grades will help address the limitations of conventional chitosan manufacturing. With the rising demand for sustainability from manufacturers and consumers alike, chitosan’s attributes of renewability, biodegradability, and functionalities will allow the material to be used in many industries.
The escalating need for efficient water and wastewater treatment solutions with lower environmental impact. This compound possesses functional groups that allow it to react with suspended particles, heavy metals, dyes, oil, and other forms of pollutants. Therefore, chitosan can be applied in industrial and municipal water treatment plants as a coagulant, flocculant, adsorbent, and filtration aid among other applications. As a result of increased industrialization and urbanization are increasing wastewater generation and creating demand for effective contaminant-removal technologies.
Using chitosan can be a solution for industries that are looking for alternatives for conventional water treatment chemicals. The fact that it is degradable and it works at relatively low concentrations makes it suitable for reducing any negative effects associated with some treatment chemicals. The areas of application for chitosan include but are not limited to food processing, textiles, pharmaceuticals, mining, chemicals, and municipal wastewater treatment. Chitosan-based products can be modified into beads, membranes, hydrogels, and adsorbents among others.
Technology developers and chitosan suppliers are focusing on advanced formulations and treatment systems that improve adsorption capacity, regenerability, mechanical strength, and treatment efficiency. The study of chitosan composites with various materials, including activated carbon, nanoparticles, and other polymers, is further expanding the application scope of chitosan. With increasing environmental quality standards and greater investment in waste water management by industries, there will be increased demand for chitosan-based treatment systems.
| Attribute | Detail |
|---|---|
| Chitosan Market Opportunity |
|
The increasing usage of chitosan in drug delivery, wound healing, tissue engineering, and other biomedical applications represents a significant growth opportunity for market participants. Being biocompatible, biodegradable, mucoadhesive, and possessing the capability to produce films and gels, chitosan is ideal for controlled release and targeted drug-delivery systems. Market participants can address these opportunities through the development of pharmaceutical-grade chitosan with well-defined molecular weight and degree of deacetylation. In addition, more opportunities will be created through the manufacture of customized chitosan derivatives and composites that are stable and offer better performance. Strategic partnerships with pharmaceutical companies, biotechnology firms, and research institutions could accelerate product development, commercialization, and regulatory approval.
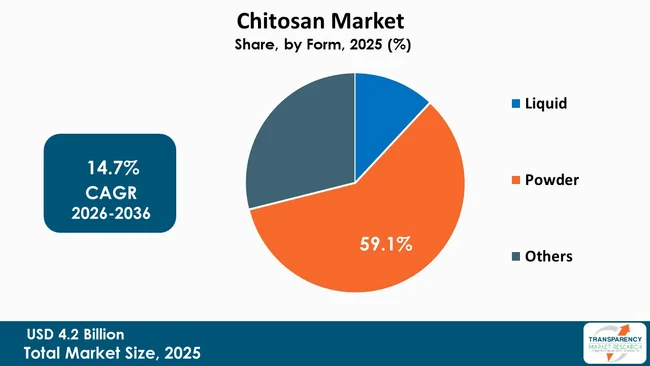
The powder segment dominated the global chitosan market in 2025, accounting for approximately 59.1% of total market revenue owing to its long shelf life, ease of storage and transportation, and convenient processing characteristics. It can be conveniently formulated as a solution, film, coating, bead, capsule, and composite depending on application requirements. The Powder form of chitosan is widely used across water treatment, agriculture, pharmaceuticals, food preservation, cosmetics, and other industrial applications, thus offering better commercial flexibility to manufacturers compared to liquid form or formulated chitosan.
Chitosan powder is the dry, processed form of chitosan obtained from chitin derived primarily from crustacean shells. Chitosan powder finds its application in a variety of applications such as water-treatment agents, agricultural products, pharmaceuticals, food coatings, cosmetics and biomedical applications.
| Attribute | Detail |
|---|---|
| Leading Region |
|
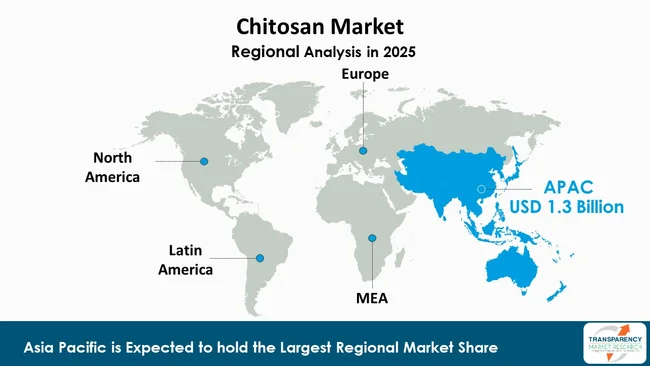
Asia Pacific dominated the global chitosan market in 2025, accounting for approximately 30.3% of total market value supported by a substantial seafood-processing industry, abundant crustacean-shell feedstock, and expanding applications across industrial and agricultural sectors. Countries like China, India, Vietnam, Thailand, and Indonesia are contributing significantly to raw-material availability and regional chitosan production.
Prominent companies operating in the chitosan market include Primex ehf, Heppe Medical Chitosan GmbH, KitoZyme S.A., Qingdao Yunzhou Biochemistry Co., Ltd., Golden-Shell Pharmaceutical Co., Ltd., and Advanced Biopolymers AS. Their portfolios include chitosan powder, pharmaceutical-grade chitosan, chitosan derivatives, chitosan oligosaccharides, fungal/vegetal chitosan, chitin-glucan products, and application-specific formulations for food and nutraceuticals, pharmaceuticals, biomedical products, cosmetics, agriculture, and water purification.
Other important market participants include Panvo Organics Pvt. Ltd., G.T.C. Bio Corporation, Dainichiseika Color & Chemicals Mfg. Co., Ltd., KIMICA Corporation, Tidal Vision Products, Inc., Chitinor AS, BIO21 Co., Ltd., Meron Biopolymers, and ChitoLytic.
Each of these players has been profiled in the Chitosan market research report based on parameters such as company overview, financial overview, business strategies, product portfolio, business segments, and recent developments.
| Attribute | Detail |
|---|---|
| Market Size Value in 2025 | USD 4.2 Billion |
| Market Forecast Value in 2036 | USD 19.0 Billion |
| Growth Rate (CAGR) | 14.7% |
| Forecast Period | 2026-2036 |
| Historical Data Available for | 2021-2025 |
| Quantitative Units | USD Billion for Value and Tons for Volume |
| Market Analysis | It includes cross-segment analysis at the global as well as regional level. The qualitative analysis includes drivers, restraints, Chitosan market opportunities, key trends, Porter’s Five Forces analysis, value chain analysis, and key trend analysis. |
| Competition Landscape |
|
| Format | Electronic (PDF) + Excel |
| Market Segmentation | Grade
|
| Regions Covered |
|
| Countries Covered |
|
| Companies Profiled |
|
| Customization Scope | Available upon request |
| Pricing | Available upon request |
The chitosan market was valued at USD 4.2 Billion in 2025.
The chitosan industry is expected to expand at a CAGR of 14.7% from 2026 to 2036.
Key drivers include growing demand for sustainable and biodegradable materials and the expansion of chitosan applications in water and wastewater treatment.
The powder segment accounted for the largest share of the market, representing 59.1% in 2025.
Asia Pacific was the most lucrative region in 2025.
Primex ehf, Heppe Medical Chitosan GmbH, KitoZyme S.A., Qingdao Yunzhou Biochemistry Co., Ltd., Golden-Shell Pharmaceutical Co., Ltd., and Advanced Biopolymers AS are among the prominent players operating in the global chitosan market.
Table 1: Global Chitosan Market Volume (Tons) Forecast, by Grade, 2026 to 2036
Table 2: Global Chitosan Market Value (USD Billion) Forecast, by Grade, 2026 to 2036
Table 3: Global Chitosan Market Volume (Tons) Forecast, by Form, 2026 to 2036
Table 4: Global Chitosan Market Value (USD Billion) Forecast, by Form, 2026 to 2036
Table 5: Global Chitosan Market Volume (Tons) Forecast, by Sources 2026 to 2036
Table 6: Global Chitosan Market Value (USD Billion) Forecast, by Sources 2026 to 2036
Table 7: Global Chitosan Market Volume (Tons) Forecast, by Application, 2026 to 2036
Table 8: Global Chitosan Market Value (USD Billion) Forecast, by Application, 2026 to 2036
Table 9: Global Chitosan Market Volume (Tons) Forecast, by End-use, 2026 to 2036
Table 10: Global Chitosan Market Value (USD Billion) Forecast, by End-use, 2026 to 2036
Table 11: Global Chitosan Market Volume (Tons) Forecast, by Region, 2026 to 2036
Table 12: Global Chitosan Market Value (USD Billion) Forecast, by Region, 2026 to 2036
Table 13: North America Chitosan Market Volume (Tons) Forecast, by Grade, 2026 to 2036
Table 14: North America Chitosan Market Value (USD Billion) Forecast, by Grade, 2026 to 2036
Table 15: North America Chitosan Market Volume (Tons) Forecast, by Form, 2026 to 2036
Table 16: North America Chitosan Market Value (USD Billion) Forecast, by Form, 2026 to 2036
Table 17: North America Chitosan Market Volume (Tons) Forecast, by Sources 2026 to 2036
Table 18: North America Chitosan Market Value (USD Billion) Forecast, by Sources 2026 to 2036
Table 19: North America Chitosan Market Volume (Tons) Forecast, by Application, 2026 to 2036
Table 20: North America Chitosan Market Value (USD Billion) Forecast, by Application, 2026 to 2036
Table 21: North America Chitosan Market Volume (Tons) Forecast, by End-use, 2026 to 2036
Table 22: North America Chitosan Market Value (USD Billion) Forecast, by End-use, 2026 to 2036
Table 23: North America Chitosan Market Volume (Tons) Forecast, by Country, 2026 to 2036
Table 24: North America Chitosan Market Value (USD Billion) Forecast, by Country, 2026 to 2036
Table 25: U.S. Chitosan Market Volume (Tons) Forecast, by Grade, 2026 to 2036
Table 26: U.S. Chitosan Market Value (USD Billion) Forecast, by Grade, 2026 to 2036
Table 27: U.S. Chitosan Market Volume (Tons) Forecast, by Form, 2026 to 2036
Table 28: U.S. Chitosan Market Value (USD Billion) Forecast, by Form, 2026 to 2036
Table 29: U.S. Chitosan Market Volume (Tons) Forecast, by Sources 2026 to 2036
Table 30: U.S. Chitosan Market Value (USD Billion) Forecast, by Sources, 2026 to 2036
Table 31: U.S. Chitosan Market Volume (Tons) Forecast, by Application, 2026 to 2036
Table 32: U.S. Chitosan Market Value (USD Billion) Forecast, by Application, 2026 to 2036
Table 33: U.S. Chitosan Market Volume (Tons) Forecast, by End-use, 2026 to 2036
Table 34: U.S. Chitosan Market Value (USD Billion) Forecast, by End-use, 2026 to 2036
Table 35: Canada Chitosan Market Volume (Tons) Forecast, by Grade, 2026 to 2036
Table 36: Canada Chitosan Market Value (USD Billion) Forecast, by Grade, 2026 to 2036
Table 37: Canada Chitosan Market Volume (Tons) Forecast, by Form, 2026 to 2036
Table 38: Canada Chitosan Market Value (USD Billion) Forecast, by Form, 2026 to 2036
Table 39: Canada Chitosan Market Volume (Tons) Forecast, by Sources, 2026 to 2036
Table 40: Canada Chitosan Market Value (USD Billion) Forecast, by Sources, 2026 to 2036
Table 41: Canada Chitosan Market Volume (Tons) Forecast, by Application, 2026 to 2036
Table 42: Canada Chitosan Market Value (USD Billion) Forecast, by Application, 2026 to 2036
Table 43: Canada Chitosan Market Volume (Tons) Forecast, by End-use, 2026 to 2036
Table 44: Canada Chitosan Market Value (USD Billion) Forecast, by End-use 2026 to 2036
Table 45: Europe Chitosan Market Volume (Tons) Forecast, by Grade, 2026 to 2036
Table 46: Europe Chitosan Market Value (USD Billion) Forecast, by Grade, 2026 to 2036
Table 47: Europe Chitosan Market Volume (Tons) Forecast, by Form, 2026 to 2036
Table 48: Europe Chitosan Market Value (USD Billion) Forecast, by Form, 2026 to 2036
Table 49: Europe Chitosan Market Volume (Tons) Forecast, by Sources 2026 to 2036
Table 50: Europe Chitosan Market Value (USD Billion) Forecast, by Sources, 2026 to 2036
Table 51: Europe Chitosan Market Volume (Tons) Forecast, by Application, 2026 to 2036
Table 52: Europe Chitosan Market Value (USD Billion) Forecast, by Application, 2026 to 2036
Table 53: Europe Chitosan Market Volume (Tons) Forecast, by End-use, 2026 to 2036
Table 54: Europe Chitosan Market Value (USD Billion) Forecast, by End-use 2026 to 2036
Table 55: Europe Chitosan Market Volume (Tons) Forecast, by Country and Sub-region, 2026 to 2036
Table 56: Europe Chitosan Market Value (USD Billion) Forecast, by Country and Sub-region, 2026 to 2036
Table 57: Germany Chitosan Market Volume (Tons) Forecast, by Grade, 2026 to 2036
Table 58: Germany Chitosan Market Value (USD Billion) Forecast, by Grade, 2026 to 2036
Table 59: Germany Chitosan Market Volume (Tons) Forecast, by Form, 2026 to 2036
Table 60: Germany Chitosan Market Value (USD Billion) Forecast, by Form, 2026 to 2036
Table 61: Germany Chitosan Market Volume (Tons) Forecast, by Sources, 2026 to 2036
Table 62: Germany Chitosan Market Value (USD Billion) Forecast, by Sources, 2026 to 2036
Table 63: Germany Chitosan Market Volume (Tons) Forecast, by Application, 2026 to 2036
Table 64: Germany Chitosan Market Value (USD Billion) Forecast, by Application, 2026 to 2036
Table 65: Germany Chitosan Market Volume (Tons) Forecast, by End-use, 2026 to 2036
Table 66: Germany Chitosan Market Value (USD Billion) Forecast, by End-use 2026 to 2036
Table 67: U.K. Chitosan Market Volume (Tons) Forecast, by Grade, 2026 to 2036
Table 68: U.K. Chitosan Market Value (USD Billion) Forecast, by Grade, 2026 to 2036
Table 69: U.K. Chitosan Market Volume (Tons) Forecast, by Form, 2026 to 2036
Table 70: U.K. Chitosan Market Value (USD Billion) Forecast, by Form, 2026 to 2036
Table 71: U.K. Chitosan Market Volume (Tons) Forecast, by Sources, 2026 to 2036
Table 72: U.K. Chitosan Market Value (USD Billion) Forecast, by Sources, 2026 to 2036
Table 73: U.K. Chitosan Market Volume (Tons) Forecast, by Application, 2026 to 2036
Table 74: U.K. Chitosan Market Value (USD Billion) Forecast, by Application, 2026 to 2036
Table 75: U.K. Chitosan Market Volume (Tons) Forecast, by End-use, 2026 to 2036
Table 76: U.K. Chitosan Market Value (USD Billion) Forecast, by End-use 2026 to 2036
Table 77: France Chitosan Market Volume (Tons) Forecast, by Grade, 2026 to 2036
Table 78: France Chitosan Market Value (USD Billion) Forecast, by Grade, 2026 to 2036
Table 79: France Chitosan Market Volume (Tons) Forecast, by Form, 2026 to 2036
Table 80: France Chitosan Market Value (USD Billion) Forecast, by Form, 2026 to 2036
Table 81: France Chitosan Market Volume (Tons) Forecast, by Sources, 2026 to 2036
Table 82: France Chitosan Market Value (USD Billion) Forecast, by Sources, 2026 to 2036
Table 83: France Chitosan Market Volume (Tons) Forecast, by Application, 2026 to 2036
Table 84: France Chitosan Market Value (USD Billion) Forecast, by Application, 2026 to 2036
Table 85: France Chitosan Market Volume (Tons) Forecast, by End-use, 2026 to 2036
Table 86: France Chitosan Market Value (USD Billion) Forecast, by End-use 2026 to 2036
Table 87: Spain Chitosan Market Volume (Tons) Forecast, by Grade, 2026 to 2036
Table 88: Spain Chitosan Market Value (USD Billion) Forecast, by Grade, 2026 to 2036
Table 89: Spain Chitosan Market Volume (Tons) Forecast, by Form, 2026 to 2036
Table 90: Spain Chitosan Market Value (USD Billion) Forecast, by Form, 2026 to 2036
Table 91: Spain Chitosan Market Volume (Tons) Forecast, by Sources, 2026 to 2036
Table 92: Spain Chitosan Market Value (USD Billion) Forecast, by Sources, 2026 to 2036
Table 93: Spain Chitosan Market Volume (Tons) Forecast, by Application, 2026 to 2036
Table 94: Spain Chitosan Market Value (USD Billion) Forecast, by Application, 2026 to 2036
Table 95: Spain Chitosan Market Volume (Tons) Forecast, by End-use, 2026 to 2036
Table 96: Spain Chitosan Market Value (USD Billion) Forecast, by End-use 2026 to 2036
Table 97: Italy Chitosan Market Volume (Tons) Forecast, by Grade, 2026 to 2036
Table 98: Italy Chitosan Market Value (USD Billion) Forecast, by Grade, 2026 to 2036
Table 99: Italy Chitosan Market Volume (Tons) Forecast, by Form, 2026 to 2036
Table 100: Italy Chitosan Market Value (USD Billion) Forecast, by Form, 2026 to 2036
Table 101: Italy Chitosan Market Volume (Tons) Forecast, by Sources, 2026 to 2036
Table 102: Italy Chitosan Market Value (USD Billion) Forecast, by Sources, 2026 to 2036
Table 103: Italy Chitosan Market Volume (Tons) Forecast, by Application, 2026 to 2036
Table 104: Italy Chitosan Market Value (USD Billion) Forecast, by Application, 2026 to 2036
Table 105: Italy Chitosan Market Volume (Tons) Forecast, by End-use, 2026 to 2036
Table 106: Italy Chitosan Market Value (USD Billion) Forecast, by End-use 2026 to 2036
Table 107: Russia & CIS Chitosan Market Volume (Tons) Forecast, by Grade, 2026 to 2036
Table 108: Russia & CIS Chitosan Market Value (USD Billion) Forecast, by Grade, 2026 to 2036
Table 109: Russia & CIS Chitosan Market Volume (Tons) Forecast, by Form, 2026 to 2036
Table 110: Russia & CIS Chitosan Market Value (USD Billion) Forecast, by Form, 2026 to 2036
Table 111: Russia & CIS Chitosan Market Volume (Tons) Forecast, by Sources, 2026 to 2036
Table 112: Russia & CIS Chitosan Market Value (USD Billion) Forecast, by Sources, 2026 to 2036
Table 113: Russia & CIS Chitosan Market Volume (Tons) Forecast, by Application, 2026 to 2036
Table 114: Russia & CIS Chitosan Market Value (USD Billion) Forecast, by Application, 2026 to 2036
Table 115: Russia & CIS Chitosan Market Volume (Tons) Forecast, by End-use, 2026 to 2036
Table 116: Russia & CIS Chitosan Market Value (USD Billion) Forecast, by End-use 2026 to 2036
Table 117: Rest of Europe Chitosan Market Volume (Tons) Forecast, by Grade, 2026 to 2036
Table 118: Rest of Europe Chitosan Market Value (USD Billion) Forecast, by Grade, 2026 to 2036
Table 119: Rest of Europe Chitosan Market Volume (Tons) Forecast, by Form, 2026 to 2036
Table 120: Rest of Europe Chitosan Market Value (USD Billion) Forecast, by Form, 2026 to 2036
Table 121: Rest of Europe Chitosan Market Volume (Tons) Forecast, by Sources, 2026 to 2036
Table 122: Rest of Europe Chitosan Market Value (USD Billion) Forecast, by Sources, 2026 to 2036
Table 123: Rest of Europe Chitosan Market Volume (Tons) Forecast, by Application, 2026 to 2036
Table 124: Rest of Europe Chitosan Market Value (USD Billion) Forecast, by Application, 2026 to 2036
Table 125: Rest of Europe Chitosan Market Volume (Tons) Forecast, by End-use, 2026 to 2036
Table 126: Rest of Europe Chitosan Market Value (USD Billion) Forecast, by End-use 2026 to 2036
Table 127: Asia Pacific Chitosan Market Volume (Tons) Forecast, by Grade, 2026 to 2036
Table 128: Asia Pacific Chitosan Market Value (USD Billion) Forecast, by Grade, 2026 to 2036
Table 129: Asia Pacific Chitosan Market Volume (Tons) Forecast, by Form, 2026 to 2036
Table 130: Asia Pacific Chitosan Market Value (USD Billion) Forecast, by Form, 2026 to 2036
Table 131: Asia Pacific Chitosan Market Volume (Tons) Forecast, by Sources, 2026 to 2036
Table 132: Asia Pacific Chitosan Market Value (USD Billion) Forecast, by Sources, 2026 to 2036
Table 133: Asia Pacific Chitosan Market Volume (Tons) Forecast, by Application, 2026 to 2036
Table 134: Asia Pacific Chitosan Market Value (USD Billion) Forecast, by Application, 2026 to 2036
Table 135: Asia Pacific Chitosan Market Volume (Tons) Forecast, by End-use, 2026 to 2036
Table 136: Asia Pacific Chitosan Market Value (USD Billion) Forecast, by End-use 2026 to 2036
Table 137: Asia Pacific Chitosan Market Volume (Tons) Forecast, by Country and Sub-region, 2026 to 2036
Table 138: Asia Pacific Chitosan Market Value (USD Billion) Forecast, by Country and Sub-region, 2026 to 2036
Table 139: China Chitosan Market Volume (Tons) Forecast, by Grade, 2026 to 2036
Table 140: China Chitosan Market Value (USD Billion) Forecast, by Grade 2026 to 2036
Table 141: China Chitosan Market Volume (Tons) Forecast, by Form, 2026 to 2036
Table 142: China Chitosan Market Value (USD Billion) Forecast, by Form, 2026 to 2036
Table 143: China Chitosan Market Volume (Tons) Forecast, by Sources, 2026 to 2036
Table 144: China Chitosan Market Value (USD Billion) Forecast, by Sources, 2026 to 2036
Table 145: China Chitosan Market Volume (Tons) Forecast, by Application, 2026 to 2036
Table 146: China Chitosan Market Value (USD Billion) Forecast, by Application, 2026 to 2036
Table 147: China Chitosan Market Volume (Tons) Forecast, by End-use, 2026 to 2036
Table 148: China Chitosan Market Value (USD Billion) Forecast, by End-use 2026 to 2036
Table 149: India Chitosan Market Volume (Tons) Forecast, by Grade, 2026 to 2036
Table 150: India Chitosan Market Value (USD Billion) Forecast, by Grade, 2026 to 2036
Table 151: India Chitosan Market Volume (Tons) Forecast, by Form, 2026 to 2036
Table 152: India Chitosan Market Value (USD Billion) Forecast, by Form, 2026 to 2036
Table 153: India Chitosan Market Volume (Tons) Forecast, by Sources, 2026 to 2036
Table 154: India Chitosan Market Value (USD Billion) Forecast, by Sources, 2026 to 2036
Table 155: India Chitosan Market Volume (Tons) Forecast, by Application, 2026 to 2036
Table 156: India Chitosan Market Value (USD Billion) Forecast, by Application, 2026 to 2036
Table 157: India Chitosan Market Volume (Tons) Forecast, by End-use, 2026 to 2036
Table 158: India Chitosan Market Value (USD Billion) Forecast, by End-use 2026 to 2036
Table 159: Japan Chitosan Market Volume (Tons) Forecast, by Grade, 2026 to 2036
Table 160: Japan Chitosan Market Value (USD Billion) Forecast, by Grade, 2026 to 2036
Table 161: Japan Chitosan Market Volume (Tons) Forecast, by Form, 2026 to 2036
Table 162: Japan Chitosan Market Value (USD Billion) Forecast, by Form, 2026 to 2036
Table 163: Japan Chitosan Market Volume (Tons) Forecast, by Sources, 2026 to 2036
Table 164: Japan Chitosan Market Value (USD Billion) Forecast, by Sources, 2026 to 2036
Table 165: Japan Chitosan Market Volume (Tons) Forecast, by Application, 2026 to 2036
Table 166: Japan Chitosan Market Value (USD Billion) Forecast, by Application, 2026 to 2036
Table 167: Japan Chitosan Market Volume (Tons) Forecast, by End-use, 2026 to 2036
Table 168: Japan Chitosan Market Value (USD Billion) Forecast, by End-use 2026 to 2036
Table 169: ASEAN Chitosan Market Volume (Tons) Forecast, by Grade, 2026 to 2036
Table 170: ASEAN Chitosan Market Value (USD Billion) Forecast, by Grade, 2026 to 2036
Table 171: ASEAN Chitosan Market Volume (Tons) Forecast, by Form, 2026 to 2036
Table 172: ASEAN Chitosan Market Value (USD Billion) Forecast, by Form, 2026 to 2036
Table 173: ASEAN Chitosan Market Volume (Tons) Forecast, by Sources, 2026 to 2036
Table 174: ASEAN Chitosan Market Value (USD Billion) Forecast, by Sources, 2026 to 2036
Table 175: ASEAN Chitosan Market Volume (Tons) Forecast, by Application, 2026 to 2036
Table 176: ASEAN Chitosan Market Value (USD Billion) Forecast, by Application, 2026 to 2036
Table 177: ASEAN Chitosan Market Volume (Tons) Forecast, by End-use, 2026 to 2036
Table 178: ASEAN Chitosan Market Value (USD Billion) Forecast, by End-use 2026 to 2036
Table 179: Rest of Asia Pacific Chitosan Market Volume (Tons) Forecast, by Grade, 2026 to 2036
Table 180: Rest of Asia Pacific Chitosan Market Value (USD Billion) Forecast, by Grade, 2026 to 2036
Table 181: Rest of Asia Pacific Chitosan Market Volume (Tons) Forecast, by Form, 2026 to 2036
Table 182: Rest of Asia Pacific Chitosan Market Value (USD Billion) Forecast, by Form, 2026 to 2036
Table 183: Rest of Asia Pacific Chitosan Market Volume (Tons) Forecast, by Sources, 2026 to 2036
Table 184: Rest of Asia Pacific Chitosan Market Value (USD Billion) Forecast, by Sources, 2026 to 2036
Table 185: Rest of Asia Pacific Chitosan Market Volume (Tons) Forecast, by Application, 2026 to 2036
Table 186: Rest of Asia Pacific Chitosan Market Value (USD Billion) Forecast, by Application, 2026 to 2036
Table 187: Rest of Asia Pacific Chitosan Market Volume (Tons) Forecast, by End-use, 2026 to 2036
Table 188: Rest of Asia Pacific Chitosan Market Value (USD Billion) Forecast, by End-use 2026 to 2036
Table 189: Latin America Chitosan Market Volume (Tons) Forecast, by Grade, 2026 to 2036
Table 190: Latin America Chitosan Market Value (USD Billion) Forecast, by Grade, 2026 to 2036
Table 191: Latin America Chitosan Market Volume (Tons) Forecast, by Form, 2026 to 2036
Table 192: Latin America Chitosan Market Value (USD Billion) Forecast, by Form, 2026 to 2036
Table 193: Latin America Chitosan Market Volume (Tons) Forecast, by Sources, 2026 to 2036
Table 194: Latin America Chitosan Market Value (USD Billion) Forecast, by Sources, 2026 to 2036
Table 195: Latin America Chitosan Market Volume (Tons) Forecast, by Application, 2026 to 2036
Table 196: Latin America Chitosan Market Value (USD Billion) Forecast, by Application, 2026 to 2036
Table 197: Latin America Chitosan Market Volume (Tons) Forecast, by End-use, 2026 to 2036
Table 198: Latin America Chitosan Market Value (USD Billion) Forecast, by End-use 2026 to 2036
Table 199: Latin America Chitosan Market Volume (Tons) Forecast, by Country and Sub-region, 2026 to 2036
Table 200: Latin America Chitosan Market Value (USD Billion) Forecast, by Country and Sub-region, 2026 to 2036
Table 201: Brazil Chitosan Market Volume (Tons) Forecast, by Grade, 2026 to 2036
Table 202: Brazil Chitosan Market Value (USD Billion) Forecast, by Grade, 2026 to 2036
Table 203: Brazil Chitosan Market Volume (Tons) Forecast, by Form, 2026 to 2036
Table 204: Brazil Chitosan Market Value (USD Billion) Forecast, by Form, 2026 to 2036
Table 205: Brazil Chitosan Market Volume (Tons) Forecast, by Sources, 2026 to 2036
Table 206: Brazil Chitosan Market Value (USD Billion) Forecast, by Sources, 2026 to 2036
Table 207: Brazil Chitosan Market Volume (Tons) Forecast, by Application, 2026 to 2036
Table 208: Brazil Chitosan Market Value (USD Billion) Forecast, by Application, 2026 to 2036
Table 209: Brazil Chitosan Market Volume (Tons) Forecast, by End-use, 2026 to 2036
Table 210: Brazil Chitosan Market Value (USD Billion) Forecast, by End-use 2026 to 2036
Table 211: Mexico Chitosan Market Volume (Tons) Forecast, by Grade, 2026 to 2036
Table 212: Mexico Chitosan Market Value (USD Billion) Forecast, by Grade, 2026 to 2036
Table 213: Mexico Chitosan Market Volume (Tons) Forecast, by Form, 2026 to 2036
Table 214: Mexico Chitosan Market Value (USD Billion) Forecast, by Form, 2026 to 2036
Table 215: Mexico Chitosan Market Volume (Tons) Forecast, by Sources, 2026 to 2036
Table 216: Mexico Chitosan Market Value (USD Billion) Forecast, by Sources, 2026 to 2036
Table 217: Mexico Chitosan Market Volume (Tons) Forecast, by Application, 2026 to 2036
Table 218: Mexico Chitosan Market Value (USD Billion) Forecast, by Application, 2026 to 2036
Table 219: Mexico Chitosan Market Volume (Tons) Forecast, by End-use, 2026 to 2036
Table 220: Mexico Chitosan Market Value (USD Billion) Forecast, by End-use 2026 to 2036
Table 221: Rest of Latin America Chitosan Market Volume (Tons) Forecast, by Grade, 2026 to 2036
Table 222: Rest of Latin America Chitosan Market Value (USD Billion) Forecast, by Grade, 2026 to 2036
Table 223: Rest of Latin America Chitosan Market Volume (Tons) Forecast, by Form, 2026 to 2036
Table 224: Rest of Latin America Chitosan Market Value (USD Billion) Forecast, by Form, 2026 to 2036
Table 225: Rest of Latin America Chitosan Market Volume (Tons) Forecast, by Sources, 2026 to 2036
Table 226: Rest of Latin America Chitosan Market Value (USD Billion) Forecast, by Sources, 2026 to 2036
Table 227: Rest of Latin America Chitosan Market Volume (Tons) Forecast, by Application, 2026 to 2036
Table 228: Rest of Latin America Chitosan Market Value (USD Billion) Forecast, by Application, 2026 to 2036
Table 229: Rest of Latin America Chitosan Market Volume (Tons) Forecast, by End-use, 2026 to 2036
Table 230: Rest of Latin America Chitosan Market Value (USD Billion) Forecast, by End-use 2026 to 2036
Table 231: Middle East & Africa Chitosan Market Volume (Tons) Forecast, by Grade, 2026 to 2036
Table 232: Middle East & Africa Chitosan Market Value (USD Billion) Forecast, by Grade, 2026 to 2036
Table 233: Middle East & Africa Chitosan Market Volume (Tons) Forecast, by Form, 2026 to 2036
Table 234: Middle East & Africa Chitosan Market Value (USD Billion) Forecast, by Form, 2026 to 2036
Table 235: Middle East & Africa Chitosan Market Volume (Tons) Forecast, by Sources, 2026 to 2036
Table 236: Middle East & Africa Chitosan Market Value (USD Billion) Forecast, by Sources, 2026 to 2036
Table 237: Middle East & Africa Chitosan Market Volume (Tons) Forecast, by Application, 2026 to 2036
Table 238: Middle East & Africa Chitosan Market Value (USD Billion) Forecast, by Application, 2026 to 2036
Table 239: Middle East & Africa Chitosan Market Volume (Tons) Forecast, by End-use, 2026 to 2036
Table 240: Middle East & Africa Chitosan Market Value (USD Billion) Forecast, by End-use 2026 to 2036
Table 241: Middle East & Africa Chitosan Market Volume (Tons) Forecast, by Country and Sub-region, 2026 to 2036
Table 242: Middle East & Africa Chitosan Market Value (USD Billion) Forecast, by Country and Sub-region, 2026 to 2036
Table 243: GCC Chitosan Market Volume (Tons) Forecast, by Grade, 2026 to 2036
Table 244: GCC Chitosan Market Value (USD Billion) Forecast, by Grade, 2026 to 2036
Table 245: GCC Chitosan Market Volume (Tons) Forecast, by Form, 2026 to 2036
Table 246: GCC Chitosan Market Value (USD Billion) Forecast, by Form, 2026 to 2036
Table 247: GCC Chitosan Market Volume (Tons) Forecast, by Sources, 2026 to 2036
Table 248: GCC Chitosan Market Value (USD Billion) Forecast, by Sources, 2026 to 2036
Table 249: GCC Chitosan Market Volume (Tons) Forecast, by Application, 2026 to 2036
Table 250: GCC Chitosan Market Value (USD Billion) Forecast, by Application, 2026 to 2036
Table 251: GCC Chitosan Market Volume (Tons) Forecast, by End-use, 2026 to 2036
Table 252: GCC Chitosan Market Value (USD Billion) Forecast, by End-use 2026 to 2036
Table 253: South Africa Chitosan Market Volume (Tons) Forecast, by Grade, 2026 to 2036
Table 254: South Africa Chitosan Market Value (USD Billion) Forecast, by Grade, 2026 to 2036
Table 255: South Africa Chitosan Market Volume (Tons) Forecast, by Form, 2026 to 2036
Table 256: South Africa Chitosan Market Value (USD Billion) Forecast, by Form, 2026 to 2036
Table 257: South Africa Chitosan Market Volume (Tons) Forecast, by Sources, 2026 to 2036
Table 258: South Africa Chitosan Market Value (USD Billion) Forecast, by Sources, 2026 to 2036
Table 259: South Africa Chitosan Market Volume (Tons) Forecast, by Application, 2026 to 2036
Table 260: South Africa Chitosan Market Value (USD Billion) Forecast, by Application, 2026 to 2036
Table 261: South Africa Chitosan Market Volume (Tons) Forecast, by End-use, 2026 to 2036
Table 262: South Africa Chitosan Market Value (USD Billion) Forecast, by End-use 2026 to 2036
Table 263: Rest of Middle East & Africa Chitosan Market Volume (Tons) Forecast, by Grade, 2026 to 2036
Table 264: Rest of Middle East & Africa Chitosan Market Value (USD Billion) Forecast, by Grade, 2026 to 2036
Table 265: Rest of Middle East & Africa Chitosan Market Volume (Tons) Forecast, by Form, 2026 to 2036
Table 266: Rest of Middle East & Africa Chitosan Market Value (USD Billion) Forecast, by Form, 2026 to 2036
Table 267: Rest of Middle East & Africa Chitosan Market Volume (Tons) Forecast, by Sources, 2026 to 2036
Table 268: Rest of Middle East & Africa Chitosan Market Value (USD Billion) Forecast, by Sources, 2026 to 2036
Table 269: Rest of Middle East & Africa Chitosan Market Volume (Tons) Forecast, by Application, 2026 to 2036
Table 270: Rest of Middle East & Africa Chitosan Market Value (USD Billion) Forecast, by Application, 2026 to 2036
Table 271: Rest of Middle East & Africa Chitosan Market Volume (Tons) Forecast, by End-use, 2026 to 2036
Table 272: Rest of Middle East & Africa Chitosan Market Value (USD Billion) Forecast, by End-use 2026 to 2036
Figure 1: Global Chitosan Market Volume Share Analysis, by Grade, 2025, 2029, and 2036
Figure 2: Global Chitosan Market Attractiveness, by Grade
Figure 3: Global Chitosan Market Volume Share Analysis, by Form, 2025, 2029, and 2036
Figure 4: Global Chitosan Market Attractiveness, by Form
Figure 5: Global Chitosan Market Volume Share Analysis, by Sources, 2025, 2029, and 2036
Figure 6: Global Chitosan Market Attractiveness, by Sources
Figure 7: Global Chitosan Market Volume Share Analysis, by Application, 2025, 2029, and 2036
Figure 8: Global Chitosan Market Attractiveness, by Application
Figure 9: Global Chitosan Market Volume Share Analysis, by End-use, 2025, 2029, and 2036
Figure 10: Global Chitosan Market Attractiveness, by End-use
Figure 11: Global Chitosan Market Volume Share Analysis, by Region, 2025, 2029, and 2036
Figure 12: Global Chitosan Market Attractiveness, by Region
Figure 13: North America Chitosan Market Volume Share Analysis, by Grade, 2025, 2029, and 2036
Figure 14: North America Chitosan Market Attractiveness, by Grade
Figure 15: North America Chitosan Market Attractiveness, by Grade
Figure 16: North America Chitosan Market Volume Share Analysis, by Form, 2025, 2029, and 2036
Figure 17: North America Chitosan Market Attractiveness, by Form
Figure 18: North America Chitosan Market Volume Share Analysis, by Sources, 2025, 2029, and 2036
Figure 19: North America Chitosan Market Attractiveness, by Sources
Figure 20: North America Chitosan Market Volume Share Analysis, by Application, 2025, 2029, and 2036
Figure 21: North America Chitosan Market Attractiveness, by Application
Figure 22: North America Chitosan Market Volume Share Analysis, by End-use, 2025, 2029, and 2036
Figure 23: North America Chitosan Market Attractiveness, by End-use
Figure 24: North America Chitosan Market Attractiveness, by Country and Sub-region
Figure 25: Europe Chitosan Market Volume Share Analysis, by Grade, 2025, 2029, and 2036
Figure 26: Europe Chitosan Market Attractiveness, by Grade
Figure 27: Europe Chitosan Market Volume Share Analysis, by Form, 2025, 2029, and 2036
Figure 28: Europe Chitosan Market Attractiveness, by Form
Figure 29: Europe Chitosan Market Volume Share Analysis, by Sources, 2025, 2029, and 2036
Figure 30: Europe Chitosan Market Attractiveness, by Sources
Figure 31: Europe Chitosan Market Volume Share Analysis, by Application, 2025, 2029, and 2036
Figure 32: Europe Chitosan Market Attractiveness, by Application
Figure 33: Europe Chitosan Market Volume Share Analysis, by End-use, 2025, 2029, and 2036
Figure 34: Europe Chitosan Market Attractiveness, by End-use
Figure 35: Europe Chitosan Market Volume Share Analysis, by Country and Sub-region, 2025, 2029, and 2036
Figure 36: Europe Chitosan Market Attractiveness, by Country and Sub-region
Figure 37: Asia Pacific Chitosan Market Volume Share Analysis, by Grade, 2025, 2029, and 2036
Figure 38: Asia Pacific Chitosan Market Attractiveness, by Grade
Figure 39: Asia Pacific Chitosan Market Volume Share Analysis, by Form, 2025, 2029, and 2036
Figure 40: Asia Pacific Chitosan Market Attractiveness, by Form
Figure 41: Asia Pacific Chitosan Market Volume Share Analysis, by Sources, 2025, 2029, and 2036
Figure 42: Asia Pacific Chitosan Market Attractiveness, by Sources
Figure 43: Asia Pacific Chitosan Market Volume Share Analysis, by Application, 2025, 2029, and 2036
Figure 44: Asia Pacific Chitosan Market Attractiveness, by Application
Figure 45: Asia Pacific Chitosan Market Volume Share Analysis, by End-use, 2025, 2029, and 2036
Figure 46: Asia Pacific Chitosan Market Attractiveness, by End-use
Figure 47: Asia Pacific Chitosan Market Volume Share Analysis, by Country and Sub-region, 2025, 2029, and 2036
Figure 48: Asia Pacific Chitosan Market Attractiveness, by Country and Sub-region
Figure 49: Latin America Chitosan Market Volume Share Analysis, by Grade, 2025, 2029, and 2036
Figure 50: Latin America Chitosan Market Attractiveness, by Grade
Figure 51: Latin America Chitosan Market Volume Share Analysis, by Form, 2025, 2029, and 2036
Figure 52: Latin America Chitosan Market Attractiveness, by Form
Figure 53: Latin America Chitosan Market Volume Share Analysis, by Sources, 2025, 2029, and 2036
Figure 54: Latin America Chitosan Market Attractiveness, by Sources
Figure 55: Latin America Chitosan Market Volume Share Analysis, by Application, 2025, 2029, and 2036
Figure 56: Latin America Chitosan Market Attractiveness, by Application
Figure 57: Latin America Chitosan Market Volume Share Analysis, by End-use, 2025, 2029, and 2036
Figure 58: Latin America Chitosan Market Attractiveness, by End-use
Figure 59: Latin America Chitosan Market Volume Share Analysis, by Country and Sub-region, 2025, 2029, and 2036
Figure 60: Latin America Chitosan Market Attractiveness, by Country and Sub-region
Figure 61: Middle East & Africa Chitosan Market Volume Share Analysis, by Grade, 2025, 2029, and 2036
Figure 62: Middle East & Africa Chitosan Market Attractiveness, by Grade
Figure 63: Middle East & Africa Chitosan Market Volume Share Analysis, by Form, 2025, 2029, and 2036
Figure 64: Middle East & Africa Chitosan Market Attractiveness, by Form
Figure 65: Middle East & Africa Chitosan Market Volume Share Analysis, by Sources, 2025, 2029, and 2036
Figure 66: Middle East & Africa Chitosan Market Attractiveness, by Sources
Figure 67: Middle East & Africa Chitosan Market Volume Share Analysis, by Application, 2025, 2029, and 2036
Figure 68: Middle East & Africa Chitosan Market Attractiveness, by Application
Figure 69: Middle East & Africa Chitosan Market Volume Share Analysis, by End-use, 2025, 2029, and 2036
Figure 70: Middle East & Africa Chitosan Market Attractiveness, by End-use
Figure 71: Middle East & Africa Chitosan Market Volume Share Analysis, by Country and Sub-region, 2025, 2029, and 2036
Figure 72: Middle East & Africa Chitosan Market Attractiveness, by Country and Sub-region
Copyright © Transparency Market Research, Inc. All Rights reserved
Trust Online


Chitosan Market
