
Reports
Reports
Packaging, especially flexible packaging, is one of the most dynamic industries today owing to its extensive application in the food and beverages, personal care, and pharmaceutical sectors. The rising demand for bi-axially oriented polypropylene (BOPP) in packaging, labeling, printing, and lamination can be primarily attributed to the booming growth in the aforementioned industries. Transparency Market Research predicts that the demand for BOPP will be in line with that of flexible packaging in the near future. It is also likely to be consistent with the growth of the food and beverages industry.
By revenue, the BOPP market is poised to expand at a 5.8% CAGR from 2016 to 2024, with the value rising from US$12.7 bn in 2015 to US$20.9 bn by the end of the forecast period. The market is projected to register a 6.3% CAGR in terms of volume between 2016 and 2024.
BOPP finds application mainly in the food industry and this segment is the leading contributor to the growth of the BOPP market in terms of volume. BOPP is used for packaging and labeling in the food industry and the growing demand for snacks, cakes, breads, ready-to-eat packaged foods, frozen foods, and confectioneries has impacted the demand for BOPP in this sector.
The food sector is also anticipated to be the fastest growing application segment by the end of the forecast period. Considering the growing demand for tapes in industrial packaging, the tapes segment also holds lucrative opportunities for players in the BOPP market.
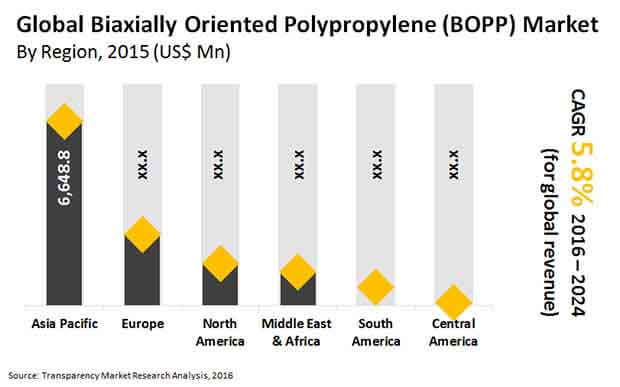
The global BOPP market is geographically segmented into North America, Central America, Latin America, Europe, Asia Pacific, and the Middle East and Africa. In terms of volume, Asia Pacific leads the global BOPP and the region accounted for a share of more than 55% in 2015. Poised for considerable growth over the course of the forecast period, the APAC BOPP market is likely to be driven by the high demand for BOPP for the production of packages and BOPP labels in the food industry and tapes for industrial packaging purposes. China is one of the leading consumers of BOPP in the region.
The Middle East and Africa and Latin America BOPP markets are projected to witness moderate to high growth by 2024, owing to the expansion of the food industry and the rising demand for packaged products. Countries within the GCC are expected to be key markets for BOPP in the Middle East; South Africa and Nigeria are likely to play a leading role in the BOPP market in Africa; Brazil, Argentina, Colombia, and Chile hold promising prospects for the BOPP market in Latin America.
The BOPP market is highly fragmented, marked by the presence of several major players. Some of the prominent companies in the global BOPP market include Kopafilm Elektrofolien GmbH, SRF Limited, Chemosvit A.S., Tempo Group, Taghleef Industries, Vibac Group S.p.A., Treofan Group, Rowad Global Packaging Co. Ltd., Zubairi Plastic Bags Industry LLC, Poligal S.A., Futamura Chemical Co., Ltd., Manucor S.p.A., Oben Holding Group, Innovia Films, Xpro India Limited, Uflex Ltd., Jindal Poly Films Ltd., Biaxplen Ltd., BIOFILM, Cosmos Films Ltd., Dunmore Corporation, Polyplex Corporation Limited, and Vitopel S.A.
Rising Demand from Food Industry to Augment Bi-axially Oriented Polypropylene (BOPP) Market Group
Flexible packaging or any kind of packaging is considered the most powerful businesses today attributable to its broad application in the food and refreshments, individual consideration, and drug areas. The rising interest for bi-pivotally situated polypropylene (BOPP) in bundling, marking, printing, and overlay can be principally ascribed to the flourishing development in the previously mentioned businesses. Straightforwardness Market Research predicts that the interest for BOPP is likely to stand in accordance with adaptable packaging. It is likewise prone to be steady with the development of the food and refreshments industry.
BOPP discovers application basically in the food business and this portion is the main supporter of the development of the BOPP market as far as volume. BOPP is utilized for bundling and marking in the food business and the developing interest for snacks, cakes, breads, prepared to-eat bundled food sources, frozen food sources, and sweet shops has affected the interest for BOPP in this area.
The food area is likewise expected to be the quickest developing application section before the finish of the gauge time frame. Thinking about the developing interest for tapes in mechanical bundling, the tapes section additionally holds worthwhile freedoms for major parts in the BOPP market.
Use of bi-axially arranged polypropylene is generally seen in different businesses including food, tapes, tobacco, customer merchandise, and clinical. BOPP is exceptionally utilized in food and tapes industry because of its high importance in assembling different items. Particularly in the food business is helps in safeguarding the newness of food items and expands its time span of usability. In addition, minimal effort and recyclability of bi-axially arranged polypropylene has given a fillip to the market. Additionally, developing interest for in adaptable bundling is additionally expected to support interest in this market. Rising metropolitan populace and expanding extra cash are a portion of different variables energizing interest in the bi-axially arranged polypropylene market.
1. Preface
1.1. Report Description
1.2. Research Scope
1.3. Assumptions
1.4. Market Segmentation
1.5. Research Methodology
2. Executive Summary
2.1. Global BOPP Market, 2013 - 2024, (Kilo Tons) (US$ Mn)
2.2. BOPP Market: Market Snapshot
3. BOPP Market– Industry Analysis
3.1. Introduction
3.2. Value Chain Analysis
3.3. Market Drivers
3.3.1. Increasing Demand in Flexible Packaging Projected to Boost BOPP Market
3.3.2. Low Cost and Recyclability of BOPP Films Expected to Drive BOPP Market
3.4. Restraints
3.4.1. Fluctuation in Raw Material Prices and Saturation in Developed Regions Anticipated to Act as Restraint for BOPP Market
3.5. Opportunity
3.5.1. Development of Specialty BOPP films and Untapped Market in Developing Regions Likely to Act as Opportunity for the BOPP Market
3.6. Porter’s Five Forces Analysis
3.6.1. Bargaining Power of Suppliers
3.6.2. Bargaining Power of Buyers
3.6.3. Threat of Substitutes
3.6.4. Threat of New Entrants
3.6.5. Degree of Competition
3.7. Global BOPP Market Attractiveness, by Application
3.8. Global BOPP Market Attractiveness, by Country
3.9. Global BOPP Market Share Analysis, 2015
4. Raw Material & Price Trend Analysis
4.1. BOPP Manufacturing Process
4.1.1. Double Bubble / Tubular Film Process
4.1.2. Stenter Process
4.2. BOPP Global Price Trend (US$/Ton), 2015–2024
4.3. BOPP Regional Price Trend (US$/Ton), 2015–2024
5. BOPP Market – Application Analysis
5.1. BOPP Market: Application Overview
5.2. BOPP Market – By Application Analysis
5.2.1. Global BOPP Market for Food, Volume & Revenue, (Kilo Tons) (US$ Mn), 2013–2024
5.2.2. Global BOPP Market for Tapes, Volume & Revenue, (Kilo Tons) (US$ Mn), 2013–2024
5.2.3. Global BOPP Market for Tobacco, Volume & Revenue, (Kilo Tons) (US$ Mn), 2013–2024
5.2.4. Global BOPP Market for Others, Volume & Revenue, (Kilo Tons) (US$ Mn), 2013–2024
6. BOPP Market - Regional Analysis
6.1. Global BOPP Market: Regional Overview
6.2. North America
6.2.1. North America BOPP Market, Application Analysis, Volume, (Kilo Tons), 2013–2024
6.2.2. North America BOPP Market, Application Analysis, Revenue (US$ Mn), 2013–2024
6.2.3. U.S. BOPP Market, Application Analysis, Volume (Kilo Tons), 2013–2024
6.2.4. U.S. BOPP Market, Application Analysis, Revenue (US$ Mn), 2013–2024
6.2.5. U.S. Northeastern Region BOPP Market, Application Analysis, Volume (Kilo Tons), 2013–2024
6.2.6. U.S. Northeastern Region BOPP Market, Application Analysis, Revenue (US$ Mn), 2013–2024
6.2.7. U.S. Southern Region BOPP Market, Application Analysis, Volume (Kilo Tons), 2013–2024
6.2.8. U.S. Southern Region BOPP Market, Application Analysis, Revenue (US$ Mn), 2013–2024
6.2.9. U.S. Western Region BOPP Market, Application Analysis, Volume (Kilo Tons), 2013–2024
6.2.10. U.S. Western Region BOPP Market, Application Analysis, Revenue (US$ Mn), 2013–2024
6.2.11. U.S. Midwestern BOPP Market, Application Analysis, Volume (Kilo Tons), 2013–2024
6.2.12. U.S. Midwestern BOPP Market, Application Analysis, Revenue (US$ Mn), 2013–2024
6.2.13. Mexico BOPP Market, Application Analysis, Volume (Kilo Tons), 2013–2024
6.2.14. Mexico BOPP Market, Application Analysis, Revenue (US$ Mn), 2013–2024
6.2.15. Canada BOPP Market, Application Analysis, Volume (Kilo Tons), 2013–2024
6.2.16. Canada BOPP Market, Application Analysis, Revenue (US$ Mn), 2013–2024
6.3. Central America
6.3.1. Central America BOPP Market, Application Analysis, Volume (Tons), 2013–2024
6.3.2. Central America BOPP Market, Application Analysis, Revenue (US$ Thousand), 2013–2024
6.3.3. Guatemala BOPP Market, Application Analysis, Volume (Tons), 2013–2024
6.3.4. Guatemala BOPP Market, Application Analysis, Revenue (US$ Thousand), 2013–2024
6.3.5. Costa Rica BOPP Market, Application Analysis, Volume (Tons), 2013–2024
6.3.6. Costa Rica BOPP Market, Application Analysis, Revenue (US$ Thousand), 2013–2024
6.3.7. Panama BOPP Market, Application Analysis, Volume (Tons), 2013–2024
6.3.8. Panama BOPP Market, Application Analysis, Revenue (US$ Thousand), 2013–2024
6.3.9. El Salvador BOPP Market, Application Analysis, Volume (Tons), 2013–2024
6.3.10. El Salvador BOPP Market, Application Analysis, Revenue (US$ Thousand), 2013–2024
6.3.11. Honduras BOPP Market, Application Analysis, Volume (Tons), 2013–2024
6.3.12. Honduras BOPP Market, Application Analysis, Revenue (US$ Thousand), 2013–2024
6.3.13. Nicaragua BOPP Market, Application Analysis, Volume (Tons), 2013–2024
6.3.14. Nicaragua BOPP Market, Application Analysis, Revenue (US$ Thousand), 2013–2024
6.3.15. Rest of Central America BOPP Market Volume, by Application, 2013 – 2024 (Kilo Tons)
6.3.16. Rest of Central America BOPP Market Revenue, by Application, 2013 – 2024 (US$ Mn)
6.4. Europe
6.4.1. Europe BOPP Market, Application Analysis, Volume (Tons), 2013–2024
6.4.2. Europe BOPP Market, Application Analysis, Revenue (US$ Thousand), 2013–2024
6.4.3. France BOPP Market, Application Analysis, Volume (Tons), 2013–2024
6.4.4. France BOPP Market, Application Analysis, Revenue (US$ Thousand), 2013–2024
6.4.5. U.K. BOPP Market, Application Analysis, Volume (Tons), 2013–2024
6.4.6. U.K. BOPP Market, Application Analysis, Revenue (US$ Thousand), 2013–2024
6.4.7. Spain BOPP Market, Application Analysis, Volume (Tons), 2013–2024
6.4.8. Spain BOPP Market, Application Analysis, Revenue (US$ Thousand), 2013–2024
6.4.9. Germany BOPP Market, Application Analysis, Volume (Tons), 2013–2024
6.4.10. Germany BOPP Market, Application Analysis, Revenue (US$ Thousand), 2013–2024
6.4.11. Italy BOPP Market, Application Analysis, Volume (Tons), 2013–2024
6.4.12. Italy BOPP Market, Application Analysis, Revenue (US$ Thousand), 2013–2024
6.4.13. Rest of Europe BOPP Market, Application Analysis, Volume (Tons), 2013–2024
6.4.14. Rest of Europe BOPP Market, Application Analysis, Revenue (US$ Thousand), 2013–2024
6.5. Asia Pacific
6.5.1. Asia Pacific BOPP Market, Application Analysis, Volume, 2013–2024 (Kilo Tons)
6.5.2. Asia Pacific BOPP Market, Application Analysis, Revenue, 2013–2024 (US$ Mn)
6.5.3. China BOPP Market, Application Analysis, Volume, 2013–2024 (Kilo Tons)
6.5.4. China BOPP Market, Application Analysis, Revenue, 2013–2024 (US$ Mn)
6.5.5. Japan BOPP Market, Application Analysis, Volume, 2013–2024 (Kilo Tons)
6.5.6. Japan BOPP Market, Application Analysis, Revenue, 2013–2024 (US$ Mn)
6.5.7. ASEAN BOPP Market, Application Analysis, Volume, 2013–2024 (Kilo Tons)
6.5.8. ASEAN BOPP Market, Application Analysis, Revenue, 2013–2024 (US$ Mn)
6.5.9. India BOPP Market, Application Analysis, Volume, 2013–2024 (Kilo Tons)
6.5.10. India BOPP Market, Application Analysis, Revenue, 2013–2024 (US$ Mn)
6.5.11. Rest of Asia Pacific BOPP Market, Application Analysis, Volume, 2013–2024 (Kilo Tons)
6.5.12. Rest of Asia Pacific BOPP Market, Application Analysis, Revenue, 2013–2024 (US$ Mn)
6.6. South America
6.6.1. South America BOPP Market, Application Analysis, Volume (Kilo Tons), 2013–2024
6.6.2. South America BOPP Market, Application Analysis, Revenue (US$ Mn), 2013–2024
6.6.3. Brazil BOPP Market, Application Analysis, Volume (Kilo Tons), 2013–2024
6.6.4. Brazil BOPP Market, Application Analysis, Revenue (US$ Mn), 2013–2024
6.6.5. Argentina BOPP Market, Application Analysis, Volume (Kilo Tons), 2013–2024
6.6.6. Argentina BOPP Market, Application Analysis, Revenue (US$ Mn), 2013–2024
6.6.7. Colombia BOPP Market, Application Analysis, Volume (Kilo Tons), 2013–2024
6.6.8. Colombia BOPP Market, Application Analysis, Revenue (US$ Mn), 2013–2024
6.6.9. Rest of South America BOPP Market, Application Analysis, Volume (Kilo Tons), 2013–2024
6.6.10. Rest of South America BOPP Market, Application Analysis, Revenue (US$ Mn), 2013–2024
6.7. Middle East & Africa
6.7.1. Middle East & Africa BOPP Market, Application Analysis, Volume (Kilo Tons), 2013–2024
6.7.2. Middle East & Africa BOPP Market, Application Analysis, Revenue (US$ Mn), 2013–2024
6.7.3. GCC BOPP Market, Application Analysis, Volume (Kilo Tons), 2013–2024
6.7.4. GCC BOPP Market, Application Analysis, Revenue (US$ Mn), 2013–2024
6.7.5. South Africa BOPP Market, Application Analysis, Volume (Kilo Tons), 2013–2024
6.7.6. South Africa BOPP Market, Application Analysis, Revenue (US$ Mn), 2013–2024
6.7.7. Nigeria BOPP Market, Application Analysis, Volume (Kilo Tons), 2013–2024
6.7.8. Nigeria BOPP Market, Application Analysis, Revenue (US$ Mn), 2013–2024
6.7.9. Angola BOPP Market, Application Analysis, Volume (Tons), 2013–2024
6.7.10. Angola BOPP Market, Application Analysis, Revenue (US$ Thousand), 2013–2024
6.7.11. Cameroon BOPP Market, Application Analysis, Volume (Tons), 2013–2024
6.7.12. Cameroon BOPP Market, Application Analysis, Revenue (US$ Thousand), 2013–2024
6.7.13. Ivory Coast BOPP Market, Application Analysis, Volume (Tons), 2013–2024
6.7.14. Ivory Coast BOPP Market, Application Analysis, Revenue (US$ Thousand), 2013–2024
6.7.15. Rest of Middle East & Africa BOPP Market, Application Analysis, Volume (Kilo Tons), 2013–2024
6.7.16. Rest of Middle East & Africa BOPP Market, Application Analysis, Revenue (US$ Mn), 2013–2024
7. Company Profiles
7.1. Jindal Poly Films Ltd.
7.1.1. Company Details (HQ, Foundation Year, Revenue, Employee Strength)
7.1.2. Business Overview
7.1.3. Product/Services, Key Brands, Key Competitors, Key End-user Industries
7.1.4. Business Strategy
7.1.5. Recent Developments
7.2. Dunmore
7.2.1. Company Details (HQ, Foundation Year, Revenue, Employee Strength)
7.2.2. Business Overview
7.2.3. Product/Services, Key Brands, Key Competitors, Key End-user Industries
7.2.4. Business Strategy
7.2.5. Recent Developments
7.3. Innovia Films
7.3.1. Company Details (HQ, Foundation Year, Revenue, Employee Strength)
7.3.2. Business Overview
7.3.3. Product/Services, Key Brands, Key Competitors, Key End-user Industries
7.3.4. Business Strategy
7.3.5. Recent Developments
7.4. BIOFILM
7.4.1. Company Details (HQ, Foundation Year, Revenue, Employee Strength)
7.4.2. Business Overview
7.4.3. Product/Services, Key Brands, Key Competitors, Key End-user Industries
7.4.4. Business Strategy
7.4.5. Recent Developments
7.5. Taghleef Industries
7.5.1. Company Details (HQ, Foundation Year, Revenue, Employee Strength)
7.5.2. Business Overview
7.5.3. Product/Services, Key Brands, Key Competitors, Key End-user Industries
7.5.4. Business Strategy
7.5.5. Recent Developments
7.6. Treofan Group
7.6.1. Company Details (HQ, Foundation Year, Revenue, Employee Strength)
7.6.2. Business Overview
7.6.3. Product/Services, Key Brands, Key Competitors, Key End-user Industries
7.6.4. Business Strategy
7.6.5. Recent Developments
7.7. Vibac Group S.p.a.
7.7.1. Company Details (HQ, Foundation Year, Revenue, Employee Strength)
7.7.2. Business Overview
7.7.3. Product/Services, Key Brands, Key Competitors, Key End-user Industries
7.7.4. Business Strategy
7.7.5. Recent Developments
7.8. Futamura Chemical Co., Ltd.
7.8.1. Company Details (HQ, Foundation Year, Revenue, Employee Strength)
7.8.2. Business Overview
7.8.3. Product/Services, Key Brands, Key Competitors, Key End-user Industries
7.8.4. Business Strategy
7.8.5. Recent Developments
7.9. Poligal S.A.
7.9.1. Company Details (HQ, Foundation Year, Revenue, Employee Strength)
7.9.2. Business Overview
7.9.3. Product/Services, Key Brands, Key Competitors, Key End-user Industries
7.9.4. Business Strategy
7.9.5. Recent Developments
7.10. Manucor S.p.A.
7.10.1. Company Details (HQ, Foundation Year, Revenue, Employee Strength)
7.10.2. Business Overview
7.10.3. Product/Services, Key Brands, Key Competitors, Key End-user Industries
7.10.4. Business Strategy
7.10.5. Recent Developments
7.11. Uflex Ltd.
7.11.1. Company Details (HQ, Foundation Year, Revenue, Employee Strength)
7.11.2. Business Overview
7.11.3. Product/Services, Key Brands, Key Competitors, Key End-user Industries
7.11.4. Business Strategy
7.11.5. Recent Developments
7.11.6. Financial Details
7.12. Cosmos Films Ltd.
7.12.1. Company Details (HQ, Foundation Year, Revenue, Employee Strength)
7.12.2. Business Overview
7.12.3. Product/Services, Key Brands, Key Competitors, Key End-user Industries
7.12.4. Business Strategy
7.12.5. Recent Developments
7.13. Tempo Group
7.13.1. Company Details (HQ, Foundation Year, Revenue, Employee Strength)
7.13.2. Business Overview
7.13.3. Product/Services, Key Brands, Key Competitors, Key End-user Industries
7.13.4. Business Strategy
7.13.5. Recent Developments
7.14. Polyplex Corporation Limited
7.14.1. Company Details (HQ, Foundation Year, Revenue, Employee Strength)
7.14.2. Business Overview
7.14.3. Product/Services, Key Brands, Key Competitors, Key End-user Industries
7.14.4. Business Strategy
7.14.5. Recent Developments
7.14.6. Financial Details
7.15. Kopafilm Elektrofolien GmbH
7.15.1. Company Details (HQ, Foundation Year, Revenue, Employee Strength)
7.15.2. Business Overview
7.15.3. Product/Services, Key Brands, Key Competitors, Key End-user Industries
7.15.4. Business Strategy
7.15.5. Recent Developments
7.16. Rowad Global Packaging Co. Ltd.
7.16.1. Company Details (HQ, Foundation Year, Revenue, Employee Strength)
7.16.2. Business Overview
7.16.3. Product/Services, Key Brands, Key Competitors, Key End-user Industries
7.16.4. Business Strategy
7.16.5. Recent Developments
7.17. Zubairi Plastic Bags Industry LLC
7.17.1. Company Details (HQ, Foundation Year, Revenue, Employee Strength)
7.17.2. Business Overview
7.17.3. Product/Services, Key Brands, Key Competitors, Key End-user Industries
7.17.4. Business Strategy
7.17.5. Recent Developments
7.18. Chemosvit A.S.
7.18.1. Company Details (HQ, Foundation Year, Revenue, Employee Strength)
7.18.2. Business Overview
7.18.3. Product/Services, Key Brands, Key Competitors, Key End-user Industries
7.18.4. Business Strategy
7.18.5. Recent Developments
7.19. Xpro India Limited
7.19.1. Company Details (HQ, Foundation Year, Revenue, Employee Strength)
7.19.2. Business Overview
7.19.3. Product/Services, Key Brands, Key Competitors, Key End-user Industries
7.19.4. Business Strategy
7.19.5. Recent Developments
7.19.6. Financial Details
7.20. SRF Limited
7.20.1. Company Details (HQ, Foundation Year, Revenue, Employee Strength)
7.20.2. Business Overview
7.20.3. Product/Services, Key Brands, Key Competitors, Key End-user Industries
7.20.4. Business Strategy
7.20.5. Recent Developments
7.20.6. Financial Details
7.21. Oben Holding Group
7.21.1. Company Details (HQ, Foundation Year, Revenue, Employee Strength)
7.21.2. Business Overview
7.21.3. Product/Services, Key Brands, Key Competitors, Key End-user Industries
7.21.4. Business Strategy
7.21.5. Recent Developments
7.22. Biaxplen Ltd.
7.22.1. Company Details (HQ, Foundation Year, Revenue, Employee Strength)
7.22.2. Business Overview
7.22.3. Product/Services, Key Brands, Key Competitors, Key End-user Industries
7.22.4. Business Strategy
7.22.5. Recent Developments
7.23. Vitopel S.A.
7.23.1. Company Details (HQ, Foundation Year, Revenue, Employee Strength)
7.23.2. Business Overview
7.23.3. Product/Services, Key Brands, Key Competitors, Key End-user Industries
7.23.4. Business Strategy
7.23.5. Recent Developments
8. List of Potential/Existing Customers/Convertors/End-users of BOPP
9. Primary Research - Key Findings
List of Tables
Table 1. Global BOPP Market
Table 2. Barrier Comparison of Various Packaging Films
Table 3. BOPP Regional Price Trend (US$/Ton), 2015–2024
Table 4. North America BOPP Market, Application Analysis, Volume, (Kilo Tons), 2013–2024
Table 5. North America BOPP Market, Application Analysis, Revenue (US$ Mn), 2013–2024
Table 6. U.S. BOPP Market, Application Analysis, Volume (Kilo Tons), 2013–2024
Table 7. U.S. BOPP Market, Application Analysis, Revenue (US$ Mn), 2013–2024
Table 8. U.S. Northeastern Region BOPP Market, Application Analysis, Volume (Kilo Tons), 2013–2024
Table 9. U.S. Northeastern Region BOPP Market, Application Analysis, Revenue (US$ Mn), 2013–2024
Table 10. U.S. Southern Region BOPP Market, Application Analysis, Volume (Kilo Tons), 2013–2024
Table 11. U.S. Southern Region BOPP Market, Application Analysis, Revenue (US$ Mn), 2013–2024
Table 12. U.S. Western Region BOPP Market, Application Analysis, Volume (Kilo Tons), 2013–2024
Table 13. U.S. Western Region BOPP Market, Application Analysis, Revenue (US$ Mn), 2013–2024
Table 14. U.S. Midwestern BOPP Market, Application Analysis, Volume (Kilo Tons), 2013–2024
Table 15. U.S. Midwestern BOPP Market, Application Analysis, Revenue (US$ Mn), 2013–2024
Table 16. Mexico BOPP Market, Application Analysis, Volume (Kilo Tons), 2013–2024
Table 17. Mexico BOPP Market, Application Analysis, Revenue (US$ Mn), 2013–2024
Table 18. Canada BOPP Market, Application Analysis, Volume (Kilo Tons), 2013–2024
Table 19. Canada BOPP Market, Application Analysis, Revenue (US$ Mn), 2013–2024
Table 20. Central America BOPP Market, Application Analysis, Volume (Tons), 2013–2024
Table 21. Central America BOPP Market, Application Analysis, Revenue (US$ Thousand), 2013–2024
Table 22. Guatemala BOPP Market, Application Analysis, Volume (Tons), 2013–2024
Table 23. Guatemala BOPP Market, Application Analysis, Revenue (US$ Thousand), 2013–2024
Table 24. Costa Rica BOPP Market, Application Analysis, Volume (Tons), 2013–2024
Table 25. Costa Rica BOPP Market, Application Analysis, Revenue (US$ Thousand), 2013–2024
Table 26. Panama BOPP Market, Application Analysis, Volume (Tons), 2013–2024
Table 27. Panama BOPP Market, Application Analysis, Revenue (US$ Thousand), 2013–2024
Table 28. El Salvador BOPP Market, Application Analysis, Volume (Tons), 2013–2024
Table 29. El Salvador BOPP Market, Application Analysis, Revenue (US$ Thousand), 2013–2024
Table 30. Honduras BOPP Market, Application Analysis, Volume (Tons), 2013–2024
Table 31. Honduras BOPP Market, Application Analysis, Revenue (US$ Thousand), 2013–2024
Table 32. Nicaragua BOPP Market, Application Analysis, Volume (Tons), 2013–2024
Table 33. Nicaragua BOPP Market, Application Analysis, Revenue (US$ Thousand), 2013–2024
Table 34. Rest of Central America BOPP Market, Application Analysis, Volume (Tons), 2013–2024
Table 35. Rest of Central America BOPP Market, Application Analysis, Revenue (US$ Thousand), 2013–2024
Table 36. Europe BOPP Market, Application Analysis, Volume (Kilo Tons), 2013–2024
Table 37. Europe BOPP Market, Application Analysis, Revenue (US$ Mn), 2013–2024
Table 38. France BOPP Market, Application Analysis, Volume (Kilo Tons), 2013–2024
Table 39. France BOPP Market, Application Analysis, Revenue (US$ Mn), 2013–2024
Table 40. U.K. BOPP Market, Application Analysis, Volume (Kilo Tons), 2013–2024
Table 41. U.K. BOPP Market, Application Analysis, Revenue (US$ Mn), 2013–2024
Table 42. Spain BOPP Market, Application Analysis, Volume (Kilo Tons), 2013–2024
Table 43. Spain BOPP Market, Application Analysis, Revenue (US$ Mn), 2013–2024
Table 44. Germany BOPP Market, Application Analysis, Volume (Kilo Tons), 2013–2024
Table 45. Germany BOPP Market, Application Analysis, Revenue (US$ Mn), 2013–2024
Table 46. Italy BOPP Market, Application Analysis, Volume (Kilo Tons), 2013–2024
Table 47. Italy BOPP Market, Application Analysis, Revenue (US$ Mn), 2013–2024
Table 48. Rest of Europe BOPP Market, Application Analysis, Volume (Kilo Tons), 2013–2024
Table 49. Rest of Europe BOPP Market, Application Analysis, Revenue (US$ Mn), 2013–2024
Table 50. Asia Pacific BOPP Market, Application Analysis, Volume, 2013–2024 (Kilo Tons)
Table 51. Asia Pacific BOPP Market, Application Analysis, Revenue, 2013–2024 (US$ Mn)
Table 52. China BOPP Market, Application Analysis, Volume, 2013–2024 (Kilo Tons)
Table 53. China BOPP Market, Application Analysis, Revenue, 2013–2024 (US$ Mn)
Table 54. Japan BOPP Market, Application Analysis, Volume, 2013–2024 (Kilo Tons)
Table 55. Japan BOPP Market, Application Analysis, Revenue, 2013–2024 (US$ Mn)
Table 56. ASEAN BOPP Market, Application Analysis, Volume, 2013–2024 (Kilo Tons)
Table 57. ASEAN BOPP Market, Application Analysis, Revenue, 2013–2024 (US$ Mn)
Table 58. India BOPP Market, Application Analysis, Volume, 2013–2024 (Kilo Tons)
Table 59. India BOPP Market, Application Analysis, Revenue, 2013–2024 (US$ Mn)
Table 60. Rest of APAC BOPP Market, Application Analysis, Volume, 2013–2024 (Kilo Tons)
Table 61. Rest of APAC BOPP Market, Application Analysis, Revenue, 2013–2024 (US$ Mn)
Table 62. South America BOPP Market, Application Analysis, Volume (Kilo Tons), 2013–2024
Table 63. South America BOPP Market, Application Analysis, Revenue (US$ Mn), 2013–2024
Table 64. Brazil BOPP Market, Application Analysis, Volume (Kilo Tons), 2013–2024
Table 65. Brazil BOPP Market, Application Analysis, Revenue (US$ Mn), 2013–2024
Table 66. Argentina BOPP Market, Application Analysis, Volume (Kilo Tons), 2013–2024
Table 67. Argentina BOPP Market, Application Analysis, Revenue (US$ Mn), 2013–2024
Table 68. Colombia BOPP Market, Application Analysis, Volume (Kilo Tons), 2013–2024
Table 69. Colombia BOPP Market, Application Analysis, Revenue (US$ Mn), 2013–2024
Table 70. Rest of South America BOPP Market, Application Analysis, Volume (Kilo Tons), 2013–2024
Table 71. Rest of South America BOPP Market, Application Analysis, Revenue (US$ Mn), 2013–2024
Table 72. Middle East & Africa BOPP Market, Application Analysis, Volume (Kilo Tons), 2013–2024
Table 73. Middle East & Africa BOPP Market, Application Analysis, Revenue (US$ Mn), 2013–2024
Table 74. GCC BOPP Market, Application Analysis, Volume (Kilo Tons), 2013–2024
Table 75. GCC BOPP Market, Application Analysis, Revenue (US$ Mn), 2013–2024
Table 76. South Africa BOPP Market, Application Analysis, Volume (Kilo Tons), 2013–2024
Table 77. South Africa BOPP Market, Application Analysis, Revenue (US$ Mn), 2013–2024
Table 78. Nigeria BOPP Market, Application Analysis, Volume (Kilo Tons), 2013–2024
Table 79. Nigeria BOPP Market, Application Analysis, Revenue (US$ Mn), 2013–2024
Table 80. Angola BOPP Market, Application Analysis, Volume (Tons), 2013–2024
Table 81. Angola BOPP Market, Application Analysis, Revenue (US$ Thousand), 2013–2024
Table 82. Cameroon BOPP Market, Application Analysis, Volume (Tons), 2013–2024
Table 83. Cameroon BOPP Market, Application Analysis, Revenue (US$ Thousand), 2013–2024
Table 84. Ivory Coast BOPP Market, Application Analysis, Volume (Tons), 2013–2024
Table 85. Ivory Coast BOPP Market, Application Analysis, Revenue (US$ Thousand), 2013–2024
Table 86. Rest of Middle East & Africa BOPP Market, Application Analysis, Volume (Kilo Tons), 2013–2024
Table 87. Rest of Middle East & Africa BOPP Market, Application Analysis, Revenue (US$ Mn), 2013–2024
Table 88. North America list of customers
Table 89. Central America list of customers
Table 90. Europe list of customers
Table 91. Asia Pacific list of customers
Table 92. South America list of customers
Table 93. Middle East list of customers
Table 94. Africa list of customers
List of Figures
Figure 1. Market Segmentation
Figure 2. Global BOPP Market
Figure 3. BOPP Market: Value Chain Analysis
Figure 4. BOPP Market: Market Dynamics
Figure 5. Global Packaging Industry (US$ Bn), 2014–2024
Figure 6. Top 5 Global Food Markets, 2015 (US$ Bn)
Figure 7. Cost Comparison of Various Packaging Films (US$/Kg), 2015
Figure 8. Global Price of Crude Oil (US$/Barrel), 2007–2015
Figure 9. India Flexible Plastic Packaging Market (US$ Bn)
Figure 10. Key Developing Countries Population (Million) (2011–2015)
Figure 11. Porter’s Five Forces Analysis
Figure 12. Global BOPP Market Attractiveness, by Application
Figure 13. Global BOPP Market Attractiveness, by Country
Figure 14. Global BOPP Market Share Analysis, 2015
Figure 15. Double Bubble / Tubular Film Process
Figure 16. Stenter Process
Figure 17. BOPP Global Price Trend (US$/Ton), 2015–2024
Figure 18. BOPP Market: Application Overview
Figure 19. Global BOPP Market for Food, Volume & Revenue, (Kilo Tons) (US$ Mn), 2013–2024
Figure 20. Global BOPP Market for Tapes, Volume & Revenue, (Kilo Tons) (US$ Mn), 2013–2024
Figure 21. Global BOPP Market for Tobacco, Volume & Revenue, (Kilo Tons) (US$ Mn), 2013–2024
Figure 22. Global BOPP Market for Others, Volume & Revenue, (Kilo Tons) (US$ Mn), 2013–2024
Figure 23. Global BOPP Market: Regional Overview
Figure 24. North America BOPP Market, 2013 and 2024
Figure 25. Central America BOPP Market, 2013 and 2024
Figure 26. Europe BOPP Market, 2013 and 2024
Figure 27. Asia Pacific BOPP Market, 2013 and 2024
Figure 28. South America BOPP Market, 2013 and 2024
Figure 29. Middle East & Africa BOPP Market, 2013 and 2024
Copyright © Transparency Market Research, Inc. All Rights reserved
Trust Online

Bi-axially Oriented Polypropylene (BOPP) Market