
Reports
Reports
Prebiotics, often overshadowed by the massive popularity garnered by probiotics, are finally getting their due-our new research finds demand for prebiotic ingredients has grown at nearly 6% annually since 2015, propelling global sales to the US$ 4.5 billion mark in 2018. As the global dietary supplements industry fights a ‘perception battle’, prebiotics are emerging as a bright spot. However, it is also pertinent to note that prebiotics still command a market value that pales in comparison to their popular counterparts, the probiotics; this continues to be a challenge for prebiotic ingredients suppliers.
The surge in demand for prebiotic ingredients—although a recent phenomenon—is paradoxical. Over the years, many dietary supplements have faced a legitimacy crisis, as lack of scientific literature on their actual health benefits hasn’t been really forthcoming. However, armed with humungous marketing budgets, the dietary supplements industry has prodded along. And, the status-quo hasn’t entirely changed; instead, it has witnessed an evolution which has created space for ‘less-marketing, more-science’ based products—a playing ground more level and conducive for prebiotic ingredients manufacturers.
While consumer awareness and inquisitiveness about the scientific literature has helped prebiotic ingredients suppliers, the trust factor consumers once placed in probiotics is now being challenged. Scientific research, most notably from University of Copenhagen, has ruled that there is “lack of evidence” surrounding the actual health benefits of probiotics. The prebiotics industry has used these findings to ‘educate’ consumers on the benefits of using a combination of probiotics and prebiotics instead.
As these perception battles support the momentum in the prebiotic ingredients market, gains have also been driven by a range of macro-economic factors, ranging from growing urbanization, increasing disposable income, and resurgency in retail sales. The impact of these broader factors has been especially palpable in the emerging countries of Asia Pacific.
The functional food and dietary supplement industry remained concentrated in North America and Europe for a long time. However, in the last decade or so, a new demographic of consumers in Asia Pacific has induced a scramble among the world’s biggest food and beverage brands. Currently, dietary supplements is a multi-million dollar business in Asia Pacific, and probiotics are easily available in hypermarkets and retail stores.
The plethora of opportunities emerging in Asia Pacific are not lost on prebiotic ingredients industry. However, to succeed in the highly lucrative and fiercely-competitive markets of Asia Pacific, a holistic strategy to capture market share from probiotic industry is required. In a region as cost-sensitive as Asia Pacific, all consumer awareness initiatives and marketing strategies can boomerang if product pricing is out of sync with consumer expectations.
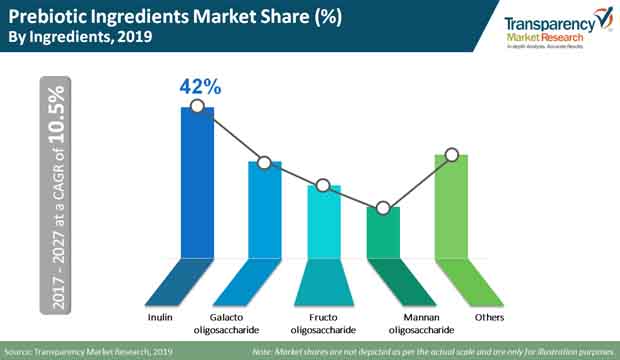
Asia Pacific also offers unique advantages in terms of sourcing prebiotic ingredients. Many countries in the region are agrarian, and the various prebiotic ingredients, including fructo-oligosaccharide, mannan-oligosaccharide, galacto-oligosaccharide, and inulin are easily available to prebiotic manufacturers. As is the case globally, inulin remains the ingredient of choice for prebiotic companies in Asia Pacific. Galacto-oligosaccharides and fructo-oligosaccharides follow suit, with mannan-oligosaccharides being the least preferred of all prebiotic ingredients.
The prebiotic ingredients market shows varied a level of competitive landscape. On a global level, a handful of multinational companies account for a sizeable market share. However, regionally, and also on a country-wide level, smaller players hold sway. Prebiotic companies have to comply with a number of regulations, especially those outlining the marketing and advertising of the products. Guidelines on labelling are also present, which puts pressure on prebiotic ingredients suppliers to be transparent in how they source their products. The degree of competition is high in the prebiotics market, and considering the undercurrents impacting probiotics and dairy supplements, it is highly likely that the landscape will become more competitive during the course of the forecast period.
The companies profiled in this study on prebiotic ingredients market include Koninklijke FrieslandCampina N.V., Roquette Frères S.A., Kerry Group plc, Ingredion Incorporated, Cargill, Incorporated, Yakult Honsha Co.,Ltd., Cosucra Groupe Warcoing SA, BENEO GmbH, Fonterra Co-operative Group Limited, Sensus America, Inc., and Jarrow Formulas, Inc.
Prebiotic Ingredients Market to Gain Momentum Owing to Rising Demand from Food and Beverage Industry
The growing demand for healthy beverage items worldwide is expected to promote the growth of the global prebiotic ingredient market. In the coming years, numerous dietary enhancements have confronted an authenticity emergency, as absence of logical writing on their genuine medical advantages hasn't been truly impending. In any case, equipped with humungous showcasing spending plans, the dietary enhancements industry has nudged along. Furthermore, business as usual hasn't completely changed; all things being equal, it has seen an advancement which has made space for 'less-promoting, more-science' based items—a playing ground more level and favorable for prebiotic fixings makers.
The global prebiotic ingredients market is classified on the basis of source, ingredients, end use, and region. In terms of source, the market is grouped into roots, cereals, vegetables, and others. Geographically, the market is dominated by North America, with Europe in close competition. Furthermore, the market in Asia Pacific will witness notable growth in the coming years owing to the increasing adoption of probiotics from supermarkets and hypermarkets.
There is developing interest in Indian shoppers for stomach related wellbeing fixings, especially prebiotics, in food items. India's probiotics market is to a great extent zeroed in on creature feed, and probiotic items for human utilization are as yet a specialty area. Mindfulness exercises by organizations, for example, Yakult keeps on driving buyer mindfulness about probiotic items that will thusly keep on filling market development. Besides, developing dairy utilization in China is driving interest for esteem added dairy items. China's reliance on imported dairy decreases its ability to build up its own cycles, and subsequently will in general repeat innovations created in Japan. China has an enormous inulin source. Licensed innovation security for these items should be thought of, with numerous imitator items known to exist. The medical advantages of prebiotics and probiotics in China is as of now problematic, thus the deals are commonly determined by viva voce.
1. Executive Summary
1.1. Market Overview
1.2. Market Analysis
1.3. Wheel of Fortune
2. Market Introduction
2.1. Market Taxonomy
2.2. Market Definition
3. Market View Point
3.1. Macro-Economic Factors
3.2. Opportunity Analysis
3.3. Pricing Analysis
3.4. Porters Five Force Analysis
4. Global Market Analysis 2012-2016 and Forecast 2017-2027
4.1. Market Volume Projections
4.2. Market Size
4.3. Value Chain
4.4. Common Foodstuff and Their Prebiotic Fiber Content
5. Global Prebiotic Ingredients Products Market Analysis 2012-2016 and Forecast, By Source 2017-2027
5.1. Introduction
5.2. Historical Market Size (US$ Mn) and Volume Units Analysis By Source (2012-2016)
5.2.1. Vegetables
5.2.2. Cereals
5.2.3. Roots
5.2.4. Others
5.3. Market Size (US$ Mn) and Volume Units Forecast By Source (2017-2027)
5.3.1. Vegetables
5.3.2. Cereals
5.3.3. Roots
5.3.4. Others
6. Global Prebiotic Ingredients Products Market Analysis 2012-2016 and Forecast, By Ingredients 2017-2027
6.1. Introduction
6.2. Historical Market Size (US$ Mn) and Volume Units Analysis By Ingredients (2012-2016)
6.2.1. Fructo-oligosaccharide
6.2.2. Mannan-oligosaccharide
6.2.3. Galacto-oligosaccharide
6.2.4. Inulin
6.2.5. Others
6.3. Market Size (US$ Mn) and Volume Units Forecast By Ingredients (2017-2027)
6.3.1. Fructo-oligosaccharide
6.3.2. Mannan-oligosaccharide
6.3.3. Galacto-oligosaccharide
6.3.4. Inulin
6.3.5. Others
7. Global Prebiotic Ingredients Products Market Analysis 2012-2016 and Forecast, By End Use 2017-2027
7.1. Introduction
7.2. Historical Market Size (US$ Mn) and Volume Units Analysis By End Use (2012-2016)
7.2.1. Clinical Nutrition
7.2.2. Dietary Supplement
7.2.3. Functional Food & Beverage
7.2.4. Dairy Products
7.2.5. Infant Formula
7.2.6. Breakfast Cereal & Cereal Bars
7.2.7. Meat Products
7.2.8. Animal Nutrition
7.2.9. Pet Food
7.3. Market Size (US$ Mn) and Volume Units Forecast By End Use (2017-2027)
7.3.1. Clinical Nutrition
7.3.2. Dietary Supplement
7.3.3. Functional Food & Beverage
7.3.4. Dairy Products
7.3.5. Infant Formula
7.3.6. Breakfast Cereal & Cereal Bars
7.3.7. Meat Products
7.3.8. Animal Nutrition
7.3.9. Pet Food
8. Global Prebiotic Ingredients Products Market Analysis 2012-2016 and Forecast By Region 2017-2027
8.1. Introduction / Key Findings
8.2. Market Size (US$ Mn) and Volume (MT) Forecast By Region
8.2.1. North America
8.2.2. Western Europe
8.2.3. Eastern Europe
8.2.4. Latin America
8.2.5. Asia Pacific Excluding Japan
8.2.6. Japan
8.2.7. Middle East and Africa
9. North America Prebiotic Ingredients Products Market Analysis 2012-2016 and Forecast 2017-2027
9.1. Introduction
9.2. Regional Market Dynamics
9.2.1. Drivers
9.2.2. Restraints
9.2.3. Trends
9.3. Historical Market Size (US$ Mn) and Volume (MT) Analysis By Country (2012-2016)
9.3.1. U.S.
9.3.2. Canada
9.4. Market Size (US$ Mn) and Volume (MT) Forecast By Country (2017-2027)
9.4.1. U.S.
9.4.2. Canada
9.5. Historical Market Size (US$ Mn) and Volume (MT) Analysis By Source (2012-2016)
9.5.1. Vegetables
9.5.2. Cereals
9.5.3. Roots
9.5.4. Others
9.6. Market Size (US$ Mn) and Volume (MT) Forecast By Source (2017-2027)
9.6.1. Vegetables
9.6.2. Cereals
9.6.3. Roots
9.6.4. Others
9.7. Historical Market Size (US$ Mn) and Volume (MT) Analysis By Ingredients (2012-2016)
9.7.1. Fructo-oligosaccharide
9.7.2. Mannan-oligosaccharide
9.7.3. Galacto-oligosaccharide
9.7.4. Inulin
9.7.5. Others
9.8. Market Size (US$ Mn) and Volume (MT) Forecast By Ingredients (2017-2027)
9.8.1. Fructo-oligosaccharide
9.8.2. Mannan-oligosaccharide
9.8.3. Galacto-oligosaccharide
9.8.4. Inulin
9.8.5. Others
9.9. Historical Market Size (US$ Mn) and Volume (MT) Analysis By End Use (2012-2016)
9.9.1. Clinical Nutrition
9.9.2. Dietary Supplement
9.9.3. Functional Food & Beverage
9.9.4. Dairy Products
9.9.5. Infant Formula
9.9.6. Breakfast Cereal & Cereal Bars
9.9.7. Meat Products
9.9.8. Animal Nutrition
9.9.9. Pet Food
9.10. Market Size (US$ Mn) and Volume (MT) Forecast By End Use (2017-2027)
9.10.1. Clinical Nutrition
9.10.2. Dietary Supplement
9.10.3. Functional Food & Beverage
9.10.4. Dairy Products
9.10.5. Infant Formula
9.10.6. Breakfast Cereal & Cereal Bars
9.10.7. Meat Products
9.10.8. Animal Nutrition
9.10.9. Pet Food
9.11. Market Attractiveness Analysis
9.11.1. By Country
9.11.2. By Source
9.11.3. By Ingredients
9.11.4. By End Use
10. Western Europe Prebiotic Ingredients Products Market Analysis 2012-2016 and Forecast 2017-2027
10.1. Introduction
10.2. Regional Market Dynamics
10.2.1. Drivers
10.2.2. Restraints
10.2.3. Trends
10.3. Historical Market Size (US$ Mn) and Volume (MT) Analysis By Country (2012-2016)
10.3.1. Germany
10.3.2. France
10.3.3. U.K.
10.3.4. Spain
10.3.5. Italy
10.3.6. Rest of Western Europe
10.4. Market Size (US$ Mn) and Volume (MT) Forecast By Country (2017-2027)
10.4.1. Germany
10.4.2. France
10.4.3. U.K.
10.4.4. Spain
10.4.5. Italy
10.4.6. Netherland
10.4.7. Rest of Western Europe
10.5. Historical Market Size (US$ Mn) and Volume (MT) Analysis By Source (2012-2016)
10.5.1. Vegetables
10.5.2. Cereals
10.5.3. Roots
10.5.4. Others
10.6. Market Size (US$ Mn) and Volume (MT) Forecast By Source (2017-2027)
10.6.1. Vegetables
10.6.2. Cereals
10.6.3. Roots
10.6.4. Others
10.7. Historical Market Size (US$ Mn) and Volume (MT) Analysis By Ingredients (2012-2016)
10.7.1. Fructo-oligosaccharide
10.7.2. Mannan-oligosaccharide
10.7.3. Galacto-oligosaccharide
10.7.4. Inulin
10.7.5. Others
10.8. Market Size (US$ Mn) and Volume (MT) Forecast By Ingredients (2017-2027)
10.8.1. Fructo-oligosaccharide
10.8.2. Mannan-oligosaccharide
10.8.3. Galacto-oligosaccharide
10.8.4. Inulin
10.8.5. Others
10.9. Historical Market Size (US$ Mn) and Volume (MT) Analysis By End Use (2012-2016)
10.9.1. Clinical Nutrition
10.9.2. Dietary Supplement
10.9.3. Functional Food & Beverage
10.9.4. Dairy Products
10.9.5. Infant Formula
10.9.6. Breakfast Cereal & Cereal Bars
10.9.7. Meat Products
10.9.8. Animal Nutrition
10.9.9. Pet Food
10.10. Market Size (US$ Mn) and Volume (MT) Forecast By End Use (2017-2027)
10.10.1. Clinical Nutrition
10.10.2. Dietary Supplement
10.10.3. Functional Food & Beverage
10.10.4. Dairy Products
10.10.5. Infant Formula
10.10.6. Breakfast Cereal & Cereal Bars
10.10.7. Meat Products
10.10.8. Animal Nutrition
10.10.9. Pet Food
10.11. Market Attractiveness Analysis
10.11.1. By Country
10.11.2. By Source
10.11.3. By Ingredients
10.11.4. By End Use
11. Eastern Europe Prebiotic Ingredients Products Market Analysis 2012-2016 and Forecast 2017-2027
11.1. Introduction
11.2. Regional Market Dynamics
11.2.1. Drivers
11.2.2. Restraints
11.2.3. Trends
11.3. Historical Market Size (US$ Mn) and Volume (MT) Analysis By Country 2012-2016
11.3.1. Russia
11.3.2. Poland
11.3.3. Rest of Eastern Europe
11.4. Market Size (US$ Mn) and Volume (MT) Forecast By Country 2017-2027
11.4.1. Russia
11.4.2. Poland
11.4.3. Rest of Eastern Europe
11.5. Historical Market Size (US$ Mn) and Volume (MT) Analysis By Source (2012-2016)
11.5.1. Vegetables
11.5.2. Cereals
11.5.3. Roots
11.5.4. Others
11.6. Market Size (US$ Mn) and Volume (MT) Forecast By Source (2017-2027)
11.6.1. Vegetables
11.6.2. Cereals
11.6.3. Roots
11.6.4. Others
11.7. Historical Market Size (US$ Mn) and Volume (MT) Analysis By Ingredients (2012-2016)
11.7.1. Fructo-oligosaccharide
11.7.2. Mannan-oligosaccharide
11.7.3. Galacto-oligosaccharide
11.7.4. Inulin
11.7.5. Others
11.8. Market Size (US$ Mn) and Volume (MT) Forecast By Ingredients (2017-2027)
11.8.1. Fructo-oligosaccharide
11.8.2. Mannan-oligosaccharide
11.8.3. Galacto-oligosaccharide
11.8.4. Inulin
11.8.5. Others
11.9. Historical Market Size (US$ Mn) and Volume (MT) Analysis By End Use (2012-2016)
11.9.1. Clinical Nutrition
11.9.2. Dietary Supplement
11.9.3. Functional Food & Beverage
11.9.4. Dairy Products
11.9.5. Infant Formula
11.9.6. Breakfast Cereal & Cereal Bars
11.9.7. Meat Products
11.9.8. Animal Nutrition
11.9.9. Pet Food
11.10. Market Size (US$ Mn) and Volume (MT) Forecast By End Use (2017-2027)
11.10.1. Clinical Nutrition
11.10.2. Dietary Supplement
11.10.3. Functional Food & Beverage
11.10.4. Dairy Products
11.10.5. Infant Formula
11.10.6. Breakfast Cereal & Cereal Bars
11.10.7. Meat Products
11.10.8. Animal Nutrition
11.10.9. Pet Food
11.11. Market Attractiveness Analysis
11.11.1. By Country
11.11.2. By Source
11.11.3. By Ingredients
11.11.4. By End Use
12. Latin America Prebiotic Ingredients Products Market Analysis 2012-2016 and Forecast 2017-2027
12.1. Introduction
12.2. Regional Market Dynamics
12.2.1. Drivers
12.2.2. Restraints
12.2.3. Trends
12.3. Historical Market Size (US$ Mn) and Volume (MT) Analysis By Country (2012-2016)
12.3.1. Brazil
12.3.2. Mexico
12.3.3. Rest of Latin America
12.4. Market Size (US$ Mn) and Volume (MT) Forecast By Country (2017-2027)
12.4.1. Brazil
12.4.2. Mexico
12.4.3. Rest of Latin America
12.5. Historical Market Size (US$ Mn) and Volume (MT) Analysis By Source (2012-2016)
12.5.1. Vegetables
12.5.2. Cereals
12.5.3. Roots
12.5.4. Others
12.6. Market Size (US$ Mn) and Volume (MT) Forecast By Source (2017-2027)
12.6.1. Vegetables
12.6.2. Cereals
12.6.3. Roots
12.6.4. Others
12.7. Historical Market Size (US$ Mn) and Volume (MT) Analysis By Ingredients (2012-2016)
12.7.1. Fructo-oligosaccharide
12.7.2. Mannan-oligosaccharide
12.7.3. Galacto-oligosaccharide
12.7.4. Inulin
12.7.5. Others
12.8. Market Size (US$ Mn) and Volume (MT) Forecast By Ingredients (2017-2027)
12.8.1. Fructo-oligosaccharide
12.8.2. Mannan-oligosaccharide
12.8.3. Galacto-oligosaccharide
12.8.4. Inulin
12.8.5. Others
12.9. Historical Market Size (US$ Mn) and Volume (MT) Analysis By End Use (2012-2016)
12.9.1. Clinical Nutrition
12.9.2. Dietary Supplement
12.9.3. Functional Food & Beverage
12.9.4. Dairy Products
12.9.5. Infant Formula
12.9.6. Breakfast Cereal & Cereal Bars
12.9.7. Meat Products
12.9.8. Animal Nutrition
12.9.9. Pet Food
12.10. Market Size (US$ Mn) and Volume (MT) Forecast By End Use (2017-2027)
12.10.1. Clinical Nutrition
12.10.2. Dietary Supplement
12.10.3. Functional Food & Beverage
12.10.4. Dairy Products
12.10.5. Infant Formula
12.10.6. Breakfast Cereal & Cereal Bars
12.10.7. Meat Products
12.10.8. Animal Nutrition
12.10.9. Pet Food
12.11. Market Attractiveness Analysis
12.11.1. By Country
12.11.2. By Source
12.11.3. By Ingredients
12.11.4. By End Use
13. Asia Pacific Excluding Japan (APEJ) Prebiotic Ingredients Products Market Analysis 2012-2016 and Forecast 2017-2027
13.1. Introduction
13.2. Regional Market Dynamics
13.2.1. Drivers
13.2.2. Restraints
13.2.3. Trends
13.3. Historical Market Size (US$ Mn) and Volume (MT) Analysis By Country (2012-2016)
13.3.1. China
13.3.2. India
13.3.3. Australia and New Zealand
13.3.4. ASEAN
13.3.5. Rest of APEJ
13.4. Market Size (US$ Mn) and Volume (MT) Forecast By Country (2017-2027)
13.4.1. China
13.4.2. India
13.4.3. Australia and New Zealand
13.4.4. ASEAN
13.4.5. Rest of APEJ
13.5. Historical Market Size (US$ Mn) and Volume (MT) Analysis By Source (2012-2016)
13.5.1. Vegetables
13.5.2. Cereals
13.5.3. Roots
13.5.4. Others
13.6. Market Size (US$ Mn) and Volume (MT) Forecast By Source (2017-2027)
13.6.1. Vegetables
13.6.2. Cereals
13.6.3. Roots
13.6.4. Others
13.7. Historical Market Size (US$ Mn) and Volume (MT) Analysis By Ingredients (2012-2016)
13.7.1. Fructo-oligosaccharide
13.7.2. Mannan-oligosaccharide
13.7.3. Galacto-oligosaccharide
13.7.4. Inulin
13.7.5. Others
13.8. Market Size (US$ Mn) and Volume (MT) Forecast By Ingredients (2017-2027)
13.8.1. Fructo-oligosaccharide
13.8.2. Mannan-oligosaccharide
13.8.3. Galacto-oligosaccharide
13.8.4. Inulin
13.8.5. Others
13.9. Historical Market Size (US$ Mn) and Volume (MT) Analysis By End Use (2012-2016)
13.9.1. Clinical Nutrition
13.9.2. Dietary Supplement
13.9.3. Functional Food & Beverage
13.9.4. Dairy Products
13.9.5. Infant Formula
13.9.6. Breakfast Cereal & Cereal Bars
13.9.7. Meat Products
13.9.8. Animal Nutrition
13.9.9. Pet Food
13.10. Market Size (US$ Mn) and Volume (MT) Forecast By End Use (2017-2027)
13.10.1. Clinical Nutrition
13.10.2. Dietary Supplement
13.10.3. Functional Food & Beverage
13.10.4. Dairy Products
13.10.5. Infant Formula
13.10.6. Breakfast Cereal & Cereal Bars
13.10.7. Meat Products
13.10.8. Animal Nutrition
13.10.9. Pet Food
13.11. Market Attractiveness Analysis
13.11.1. By Country
13.11.2. By Source
13.11.3. By Ingredients
13.11.4. By End Use
14. Japan Prebiotic Ingredients Products Market Analysis 2012-2016 and Forecast 2017-2027
14.1. Introduction
14.2. Regional Market Dynamics
14.2.1. Drivers
14.2.2. Restraints
14.2.3. Trends
14.3. Historical Market Size (US$ Mn) and Volume (MT) Analysis By Source (2012-2016)
14.3.1. Vegetables
14.3.2. Cereals
14.3.3. Roots
14.3.4. Others
14.4. Market Size (US$ Mn) and Volume (MT) Forecast By Source (2017-2027)
14.4.1. Vegetables
14.4.2. Cereals
14.4.3. Roots
14.4.4. Others
14.5. Historical Market Size (US$ Mn) and Volume (MT) Analysis By Ingredients (2012-2016)
14.5.1. Fructo-oligosaccharide
14.5.2. Mannan-oligosaccharide
14.5.3. Galacto-oligosaccharide
14.5.4. Inulin
14.5.5. Others
14.6. Market Size (US$ Mn) and Volume (MT) Forecast By Ingredients (2017-2027)
14.6.1. Fructo-oligosaccharide
14.6.2. Mannan-oligosaccharide
14.6.3. Galacto-oligosaccharide
14.6.4. Inulin
14.6.5. Others
14.7. Historical Market Size (US$ Mn) and Volume (MT) Analysis By End Use (2012-2016)
14.7.1. Clinical Nutrition
14.7.2. Dietary Supplement
14.7.3. Functional Food & Beverage
14.7.4. Dairy Products
14.7.5. Infant Formula
14.7.6. Breakfast Cereal & Cereal Bars
14.7.7. Meat Products
14.7.8. Animal Nutrition
14.7.9. Pet Food
14.8. Market Size (US$ Mn) and Volume (MT) Forecast By End Use (2017-2027)
14.8.1. Clinical Nutrition
14.8.2. Dietary Supplement
14.8.3. Functional Food & Beverage
14.8.4. Dairy Products
14.8.5. Infant Formula
14.8.6. Breakfast Cereal & Cereal Bars
14.8.7. Meat Products
14.8.8. Animal Nutrition
14.8.9. Pet Food
14.9. Market Attractiveness Analysis
14.9.1. By Country
14.9.2. By Source
14.9.3. By Ingredients
14.9.4. By End Use
15. Middle East and Africa Prebiotic Ingredients Products Market Analysis 2012-2016 and Forecast 2017-2027
15.1. Introduction
15.2. Regional Market Dynamics
15.2.1. Drivers
15.2.2. Restraints
15.2.3. Trends
15.3. Historical Market Size (US$ Mn) and Volume (MT) Forecast By Country (2012-2016)
15.3.1. GCC Countries
15.3.2. North Africa
15.3.3. South Africa
15.3.4. Rest of Middle East and Africa
15.4. Market Size (US$ Mn) and Volume (MT) Forecast By Country (2017 -2027)
15.4.1. GCC Countries
15.4.2. North Africa
15.4.3. South Africa
15.4.4. Rest of Middle East and Africa
15.5. Historical Market Size (US$ Mn) and Volume (MT) Analysis By Source (2012-2016)
15.5.1. Vegetables
15.5.2. Cereals
15.5.3. Roots
15.5.4. Others
15.6. Market Size (US$ Mn) and Volume (MT) Forecast By Source (2017-2027)
15.6.1. Vegetables
15.6.2. Cereals
15.6.3. Roots
15.6.4. Others
15.7. Historical Market Size (US$ Mn) and Volume (MT) Analysis By Ingredients (2012-2016)
15.7.1. Fructo-oligosaccharide
15.7.2. Mannan-oligosaccharide
15.7.3. Galacto-oligosaccharide
15.7.4. Inulin
15.7.5. Others
15.8. Market Size (US$ Mn) and Volume (MT) Forecast By Ingredients (2017-2027)
15.8.1. Fructo-oligosaccharide
15.8.2. Mannan-oligosaccharide
15.8.3. Galacto-oligosaccharide
15.8.4. Inulin
15.8.5. Others
15.9. Historical Market Size (US$ Mn) and Volume (MT) Analysis By End Use (2012-2016)
15.9.1. Clinical Nutrition
15.9.2. Dietary Supplement
15.9.3. Functional Food & Beverage
15.9.4. Dairy Products
15.9.5. Infant Formula
15.9.6. Breakfast Cereal & Cereal Bars
15.9.7. Meat Products
15.9.8. Animal Nutrition
15.9.9. Pet Food
15.10. Market Size (US$ Mn) and Volume (MT) Forecast By End Use (2017-2027)
15.10.1. Clinical Nutrition
15.10.2. Dietary Supplement
15.10.3. Functional Food & Beverage
15.10.4. Dairy Products
15.10.5. Infant Formula
15.10.6. Breakfast Cereal & Cereal Bars
15.10.7. Meat Products
15.10.8. Animal Nutrition
15.10.9. Pet Food
15.11. Market Attractiveness Analysis
15.11.1. By Country
15.11.2. By Source
15.11.3. By Ingredients
15.11.4. By End Use
16. Forecast Factors: Relevance and Impact
17. Forecast Assumptions
18. Competition Landscape
18.1. Market Structure
18.2. Competition Dashboard
18.3. Company Profiles (Details - Overview, Financials, Strategy, Recent Developments)
18.3.1. Koninklijke FrieslandCampina N.V.
18.3.2. Roquette Frères S.A.
18.3.3. Kerry Group plc
18.3.4. Ingredion Incorporated
18.3.5. Cargill, Incorporated
18.3.6. Yakult Honsha Co.,Ltd.
18.3.7. Cosucra Groupe Warcoing SA
18.3.8. BENEO GmbH
18.3.9. Fonterra Co-operative Group Limited
18.3.10. Sensus America, Inc.
18.3.11. Jarrow Formulas, Inc.
19. Research Methodology
List of Table
Table 01: Global Prebiotic Ingredients Market Value (US$ Mn) and Volume (MT) Forecast, By Source, 2012-2027
Table 02: Global Prebiotic Ingredients Market Value (US$ Mn) and Volume (MT) Forecast, By Ingredients, 2012-2027
Table 03: Global Prebiotic Ingredients Market Value (US$ Mn) and Volume (MT) Forecast, By End Use, 2012-2027s
Table 04: Global Prebiotic Ingredients Market Value (US$ Mn) and Volume (MT) Forecast, By Application, 2012-2027
Table 05: Global Prebiotic Ingredients Market Value (US$ Mn) and Volume (MT) Forecast, By Region, 2012-2027
Table 06: Global Prebiotic Ingredients Market Value (US$ Mn) and Volume (MT) Forecast, By Region, 2012-2027
Table 07: North America Prebiotic Ingredients Market Value (US$ Mn) and Volume (MT) Forecast, By Country, 2012-2027
Table 08: North America Prebiotic Ingredients Market Value (US$ Mn) and Volume (MT) Forecast, By Source, 2012-2027
Table 09: North America Prebiotic Ingredients Market Value (US$ Mn) and Volume (MT) Forecast, By Ingredients, 2012-2027
Table 10: North America Prebiotic Ingredients Market Value (US$ Mn) and Volume (MT) Forecast, By End Use, 2012-2027
Table 11: North America Prebiotic Ingredients Market Value (US$ Mn) and Volume (MT) Forecast, By End Use, 2012-2027
Table 12: Western Europe Prebiotic Ingredients Market Value (US$ Mn) and Volume (MT) Forecast, By Country, 2012-2027
Table 13: Western Europe Prebiotic Ingredients Market Value (US$ Mn) and Volume (MT) Forecast, By Country, 2012-2027
Table 14: Western Europe Prebiotic Ingredients Market Value (US$ Mn) and Volume (MT) Forecast, By Source, 2012-2027
Table 15: Western Europe Prebiotic Ingredients Market Value (US$ Mn) and Volume (MT) Forecast, By Ingredients, 2012-2027
Table 16: Western Europe Prebiotic Ingredients Market Value (US$ Mn) and Volume (MT) Forecast, By End Use, 2012-2027
Table 17: Western Europe Prebiotic Ingredients Market Value (US$ Mn) and Volume (MT) Forecast, By End Use, 2012-2027
Table 18: Eastern Europe Prebiotic Ingredients Market Value (US$ Mn) and Volume (MT) Forecast, By Country, 2012-2027
Table 19: Eastern Europe Prebiotic Ingredients Market Value (US$ Mn) and Volume (MT) Forecast, By Source, 2012-2027
Table 20: Eastern Europe Prebiotic Ingredients Market Value (US$ Mn) and Volume (MT) Forecast, By Ingredients, 2012-2027
Table 21: Eastern Europe Prebiotic Ingredients Market Value (US$ Mn) and Volume (MT) Forecast, By End Use, 2012-2027
Table 22: Eastern Europe Prebiotic Ingredients Market Value (US$ Mn) and Volume (MT) Forecast, By End Use, 2012-2027
Table 23: Latin America Prebiotic Ingredients Market Value (US$ Mn) and Volume (MT) Forecast, By Country, 2012-2027
Table 24: Latin America Prebiotic Ingredients Market Value (US$ Mn) and Volume (MT) Forecast, By Source, 2012-2027
Table 25: Latin America Prebiotic Ingredients Market Value (US$ Mn) and Volume (MT) Forecast, By Ingredients, 2012-2027
Table 26: Latin America Prebiotic Ingredients Market Value (US$ Mn) and Volume (MT) Forecast, By End Use, 2012-2027
Table 27: Latin America Prebiotic Ingredients Market Value (US$ Mn) and Volume (MT) Forecast, By End Use, 2012-2027
Table 28: APEJ Prebiotic Ingredients Market Value (US$ Mn) and Volume (MT) Forecast, By Country, 2012-2027
Table 29: APEJ Prebiotic Ingredients Market Value (US$ Mn) and Volume (MT) Forecast, By Source, 2012-2027
Table 30: APEJ Prebiotic Ingredients Market Value (US$ Mn) and Volume (MT) Forecast, By Ingredients, 2012-2027
Table 31: APEJ Prebiotic Ingredients Market Value (US$ Mn) and Volume (MT) Forecast, By End Use, 2012-2027
Table 32: APEJ Prebiotic Ingredients Market Value (US$ Mn) and Volume (MT) Forecast, By End Use, 2012-2027
Table 33: Japan Prebiotic Ingredients Market Value (US$ Mn) and Volume (MT) Forecast, By Source, 2012-2027
Table 34: Japan Prebiotic Ingredients Market Value (US$ Mn) and Volume (MT) Forecast, By Ingredients, 2012-2027
Table 35: Japan Prebiotic Ingredients Market Value (US$ Mn) and Volume (MT) Forecast, By End Use, 2012-2027
Table 36: Japan Prebiotic Ingredients Market Value (US$ Mn) and Volume (MT) Forecast, By End Use, 2012-2027
Table 37: MEA Prebiotic Ingredients Market Value (US$ Mn) and Volume (MT) Forecast, By Country, 2012-2027
Table 38: MEA Prebiotic Ingredients Market Value (US$ Mn) and Volume (MT) Forecast, By Source, 2012-2027
Table 39: MEA Prebiotic Ingredients Market Value (US$ Mn) and Volume (MT) Forecast, By Ingredients, 2012-2027
Table 40: MEA Prebiotic Ingredients Market Value (US$ Mn) and Volume (MT) Forecast, By End Use, 2012-2027
Table 41: MEA Prebiotic Ingredients Market Value (US$ Mn) and Volume (MT) Forecast, By End Use, 2012-2027
List of Figures
Figure 01: Global Prebiotic Ingredients Market Value (US$ Mn) and Volume (MT), 2012-2016
Figure 02: Global Prebiotic Ingredients Market Value (US$ Mn) and Volume (MT) Forecast, 2017-2027
Figure 03: Global Prebiotic Ingredients Market Value Share (%) and BPS Analysis, By Source, 2012, 2017 & 2027
Figure 04: Global Prebiotic Ingredients Market Y-o-Y Growth (%) Projections, By Source, 2012-2027
Figure 05: Global Prebiotic Ingredients Market Absolute $ Opportunity (US$ Mn), By Vegetable Segment, 2012 to 2016-2027
Figure 06: Global Prebiotic Ingredients Market Absolute $ Opportunity (US$ Mn), By Cereals Segment, 2012 to 2016-2027
Figure 07: Global Prebiotic Ingredients Market Absolute $ Opportunity (US$ Mn), By Roots Segment, 2012 to 2016-2027
Figure 08: Global Prebiotic Ingredients Market Absolute $ Opportunity (US$ Mn), By Others Segment, 2012 to 2016-2027
Figure 09: Global Prebiotic Ingredients Market Attractiveness, By Source, 2017-2027
Figure 10: Global Prebiotic Ingredients Market Value Share (%) and BPS Analysis, By Ingredients - 2012, 2017 & 2027
Figure 11: Global Prebiotic Ingredients Market Y-o-Y Growth (%) Projections, By Ingredients, 2012-2027
Figure 12: Global Prebiotic Ingredients Market Absolute $ Opportunity (US$ Mn), By Fructo-oligosaccharide, 2012 to 2016-2027
Figure 13: Global Prebiotic Ingredients Market Absolute $ Opportunity (US$ Mn), By Mannan-oligosaccharide, 2012 to 2016-2027
Figure 14: Global Prebiotic Ingredients Market Absolute $ Opportunity (US$ Mn), By Spice Flavours Segment, 2012 to 2016-2027
Figure 15: Global Prebiotic Ingredients Market Absolute $ Opportunity (US$ Mn), By Nut Flavours Segment, 2012 to 2016-2027
Figure 16: Global Prebiotic Ingredients Market Absolute $ Opportunity (US$ Mn), By Others Segment, 2012 to 2016-2027
Figure 17: Global Prebiotic Ingredients Market Attractiveness, By Ingredients, 2017-2027
Figure 18: Global Prebiotic Ingredients Market Value Share (%) and BPS Analysis, By End Use - 2012, 2017 & 2027
Figure 19: Global Prebiotic Ingredients Market Y-o-Y Growth (%) Projections, By End Use, 2012-2027
Figure 20: Global Prebiotic Ingredients Market Absolute $ Opportunity (US$ Mn), By Clinical Nutrition, 2012 to 2016-2027
Figure 21: Global Prebiotic Ingredients Market Absolute $ Opportunity (US$ Mn), By Dietary Supplements, 2012 to 2016-2027
Figure 22: Global Prebiotic Ingredients Market Absolute $ Opportunity (US$ Mn), By Functional Foods & Beverages, 2012 to 2016-2027
Figure 23: Global Prebiotic Ingredients Market Absolute $ Opportunity (US$ Mn), By Dairy Products, 2012 to 2016-2027
Figure 24: Global Prebiotic Ingredients Market Absolute $ Opportunity (US$ Mn), By Infant Formula, 2012 to 2016-2027
Figure 25: Global Prebiotic Ingredients Market Absolute $ Opportunity (US$ Mn), By Breakfast Cereal & Cereal Bars, 2012 to 2016-2027
Figure 26: Global Prebiotic Ingredients Market Absolute $ Opportunity (US$ Mn), By Meat Products, 2012 to 2016-2027
Figure 27: Global Prebiotic Ingredients Market Absolute $ Opportunity (US$ Mn), By Animal Nutrition, 2012 to 2016-2027
Figure 28: Global Prebiotic Ingredients Market Absolute $ Opportunity (US$ Mn), By Animal Nutrition, 2012 to 2016-2027
Figure 29: Global Prebiotic Ingredients Market Attractiveness, By Application, 2017-2027
Figure 30 : Global Prebiotic Ingredients Market Value Share (%) and BPS Analysis, By Region -2017 & 2027
Figure 31: Global Prebiotic Ingredients Market Y-o-Y Growth (%) Projections, By Region, 2017-2027
Figure 32: Global Prebiotic Ingredients Market Attractiveness, By Region, 2017-2027
Figure 33: North America Prebiotic Ingredients Market Value (US$ Mn) and Volume (MT), 2012-2016
Figure 34: North America Prebiotic Ingredients Market Value (US$ Mn) and Volume (MT) Forecast, 2017-2027
Figure 35: U.S. Prebiotic Ingredients Market Absolute $ Opportunity (US$ Mn), 2012 to 2016-2027
Figure 36: Canada Prebiotic Ingredients Market Absolute $ Opportunity (US$ Mn), 2012 to 2016-2027
Figure 37: North America Prebiotic Ingredients Market Attractiveness, By Country, 2017-2027
Figure 38: North America Prebiotic Ingredients Market Value Share (%) and BPS Analysis, By Source, 2012, 2017 & 2027
Figure 39: North America Prebiotic Ingredients Market Y-o-Y Growth (%) Projections, By Source , 2012-2027
Figure 40: North America Prebiotic Ingredients Market Attractiveness, By Source, 2017-2027
Figure 41: North America Prebiotic Ingredients Market Value Share (%) and BPS Analysis, By Ingredients - 2012, 2017 & 2027
Figure 42: North America Prebiotic Ingredients Market Y-o-Y Growth (%) Projections, By Ingredients, 2012-2027
Figure 43: North America Prebiotic Ingredients Market Attractiveness, By Ingredients, 2017-2027
Figure 44: North America Prebiotic Ingredients Market Value Share (%) and BPS Analysis, By End Use - 2012, 2017 & 2027
Figure 45: North America Prebiotic Ingredients Market Y-o-Y Growth (%) Projections, By End Use, 2012-2027
Figure 46: North America Prebiotic Ingredients Market Attractiveness, By Application, 2017-2027
Figure 47: Western Europe Prebiotic Ingredients Market Value (US$ Mn) and Volume (MT), 2012-2016
Figure 48: Western Europe Prebiotic Ingredients Market Value (US$ Mn) and Volume (MT) Forecast, 2017-2027
Figure 49: Germany Prebiotic Ingredients Market Absolute $ Opportunity (US$ Mn), 2012 to 2016-2027
Figure 50: France Prebiotic Ingredients Market Absolute $ Opportunity (US$ Mn), 2012 to 2016-2027
Figure 51: U.K. Prebiotic Ingredients Market Absolute $ Opportunity (US$ Mn), 2012 to 2016-2027
Figure 52: Spain Prebiotic Ingredients Market Absolute $ Opportunity (US$ Mn), 2012 to 2016-2027
Figure 53: Italy Prebiotic Ingredients Market Absolute $ Opportunity (US$ Mn), 2012 to 2016-2027
Figure 54: BENELUX Prebiotic Ingredients Market Absolute $ Opportunity (US$ Mn), 2012 to 2016-2027
Figure 55: NORDIC Prebiotic Ingredients Market Absolute $ Opportunity (US$ Mn), 2012 to 2016-2027
Figure 56: Rest of Western Europe Prebiotic Ingredients Market Absolute $ Opportunity (US$ Mn), 2012 to 2016-2027
Figure 57: Western Europe Prebiotic Ingredients Market Attractiveness, By Country, 2017-2027
Figure 58: Western Europe Prebiotic Ingredients Market Value Share (%) and BPS Analysis, By Source, 2012, 2017 & 2027
Figure 59: Western Europe Prebiotic Ingredients Market Y-o-Y Growth (%) Projections, By Source , 2012-2027
Figure 60: Western Europe Prebiotic Ingredients Market Attractiveness, By Source, 2017-2027
Figure 61: Western Europe Prebiotic Ingredients Market Value Share (%) and BPS Analysis, By Ingredients - 2012, 2017 & 2027
Figure 62: Western Europe Prebiotic Ingredients Market Y-o-Y Growth (%) Projections, By Ingredients, 2012-2027
Figure 63: Western Europe Prebiotic Ingredients Market Attractiveness, By Ingredients, 2017-2027
Figure 64: Western Europe Prebiotic Ingredients Market Value Share (%) and BPS Analysis, By End Use - 2012, 2017 & 2027
Figure 65: Western Europe Prebiotic Ingredients Market Y-o-Y Growth (%) Projections, By End Use, 2012-2027
Figure 66: Western Europe Prebiotic Ingredients Market Attractiveness, By Application, 2017-2027
Figure 67: Eastern Europe Prebiotic Ingredients Market Value (US$ Mn) and Volume (MT), 2012-2016
Figure 68: Eastern Europe Prebiotic Ingredients Market Value (US$ Mn) and Volume (MT) Forecast, 2017-2027
Figure 69: Russia Prebiotic Ingredients Market Absolute $ Opportunity (US$ Mn), 2012 to 2016-2027
Figure 70: Poland Prebiotic Ingredients Market Absolute $ Opportunity (US$ Mn), 2012 to 2016-2027
Figure 71: Rest of Eastern Europe Prebiotic Ingredients Market Absolute $ Opportunity (US$ Mn), 2012 to 2016-2027
Figure 72: Eastern Europe Prebiotic Ingredients Market Attractiveness, By Country, 2017-2027
Figure 73: Eastern Europe Prebiotic Ingredients Market Value Share (%) and BPS Analysis, By Source, 2012, 2017 & 2027
Figure 74: Eastern Europe Prebiotic Ingredients Market Y-o-Y Growth (%) Projections, By Source , 2012-2027
Figure 75: Eastern Europe Prebiotic Ingredients Market Attractiveness, By Source, 2017-2027
Figure 76: Eastern Europe Prebiotic Ingredients Market Value Share (%) and BPS Analysis, By Ingredients - 2012, 2017 & 2027
Figure 77: Eastern Europe Prebiotic Ingredients Market Y-o-Y Growth (%) Projections, By Ingredients, 2012-2027
Figure 78: Eastern Europe Prebiotic Ingredients Market Attractiveness, By Ingredients, 2017-2027
Figure 79: Eastern Europe Prebiotic Ingredients Market Value Share (%) and BPS Analysis, By End Use - 2012, 2017 & 2027
Figure 80: Eastern Europe Prebiotic Ingredients Market Y-o-Y Growth (%) Projections, By End Use, 2012-2027
Figure 81: Eastern Europe Prebiotic Ingredients Market Attractiveness, By Application, 2017-2027
Figure 82: Latin America Prebiotic Ingredients Market Value (US$ Mn) and Volume (MT), 2012-2016
Figure 83: Latin America Prebiotic Ingredients Market Value (US$ Mn) and Volume (MT) Forecast, 2017-2027
Figure 84: Brazil Prebiotic Ingredients Market Absolute $ Opportunity (US$ Mn), 2012 to 2016-2027
Figure 85: Mexico Prebiotic Ingredients Market Absolute $ Opportunity (US$ Mn), 2012 to 2016-2027
Figure 86: Argentina Prebiotic Ingredients Market Absolute $ Opportunity (US$ Mn), 2012 to 2016-2027
Figure 87: Rest of Latin America Prebiotic Ingredients Market Absolute $ Opportunity (US$ Mn), 2012 to 2016-2027
Figure 88: Latin America Prebiotic Ingredients Market Attractiveness, By Country, 2017-2027
Figure 89: Latin America Prebiotic Ingredients Market Value Share (%) and BPS Analysis, By Source, 2012, 2017 & 2027
Figure 90: Latin America Prebiotic Ingredients Market Y-o-Y Growth (%) Projections, By Source , 2012-2027
Figure 91: Latin America Prebiotic Ingredients Market Attractiveness, By Source, 2017-2027
Figure 92: Latin America Prebiotic Ingredients Market Value Share (%) and BPS Analysis, By Ingredients - 2012, 2017 & 2027
Figure 93: Latin America Prebiotic Ingredients Market Y-o-Y Growth (%) Projections, By Ingredients, 2012-2027
Figure 94: Latin America Prebiotic Ingredients Market Attractiveness, By Ingredients, 2017-2027
Figure 95: Latin America Prebiotic Ingredients Market Value Share (%) and BPS Analysis, By End Use - 2012, 2017 & 2027
Figure 96: Latin America Prebiotic Ingredients Market Y-o-Y Growth (%) Projections, By End Use, 2012-2027
Figure 97: Latin America Prebiotic Ingredients Market Attractiveness, By Application, 2017-2027
Figure 98: APEJ Prebiotic Ingredients Market Value (US$ Mn) and Volume (MT), 2012-2016
Figure 99: APEJ Prebiotic Ingredients Market Value (US$ Mn) and Volume (MT) Forecast, 2017-2027
Figure 100: China Prebiotic Ingredients Market Absolute $ Opportunity (US$ Mn), 2012 to 2016-2027
Figure 101: India Prebiotic Ingredients Market Absolute $ Opportunity (US$ Mn), 2012 to 2016-2027
Figure 102: Australia & New Zealand Prebiotic Ingredients Market Absolute $ Opportunity (US$ Mn), 2012 to 2016-2027
Figure 103: ASEAN Prebiotic Ingredients Market Absolute $ Opportunity (US$ Mn), 2012 to 2016-2027
Figure 104: Rest of APEJ Prebiotic Ingredients Market Absolute $ Opportunity (US$ Mn), 2012 to 2016-2027
Figure 105: APEJ Prebiotic Ingredients Market Attractiveness, By Country, 2017-2027
Figure 106: APEJ Prebiotic Ingredients Market Value Share (%) and BPS Analysis, By Source, 2012, 2017 & 2027
Figure 107: APEJ Prebiotic Ingredients Market Y-o-Y Growth (%) Projections, By Source , 2012-2027
Figure 108: APEJ Prebiotic Ingredients Market Attractiveness, By Source, 2017-2027
Figure 109: APEJ Prebiotic Ingredients Market Value Share (%) and BPS Analysis, By Ingredients - 2012, 2017 & 2027
Figure 110: APEJ Prebiotic Ingredients Market Y-o-Y Growth (%) Projections, By Ingredients, 2012-2027
Figure 111: APEJ Prebiotic Ingredients Market Attractiveness, By Ingredients, 2017-2027
Figure 112: APEJ Prebiotic Ingredients Market Value Share (%) and BPS Analysis, By End Use - 2012, 2017 & 2027
Figure 113: APEJ Prebiotic Ingredients Market Y-o-Y Growth (%) Projections, By End Use, 2012-2027
Figure 114: APEJ Prebiotic Ingredients Market Attractiveness, By End Use, 2017-2027
Figure 115: Japan Prebiotic Ingredients Market Value (US$ Mn) and Volume (MT), 2012-2016
Figure 116: Japan Prebiotic Ingredients Market Value (US$ Mn) and Volume (MT) Forecast, 2017-2027
Figure 117: Japan Prebiotic Ingredients Market Value Share (%) and BPS Analysis, By Source, 2012, 2017 & 2027
Figure 118: Japan Prebiotic Ingredients Market Y-o-Y Growth (%) Projections, By Source , 2012-2027
Figure 119: Japan Prebiotic Ingredients Market Attractiveness, By Source, 2017-2027
Figure 120: Japan Prebiotic Ingredients Market Value Share (%) and BPS Analysis, By Ingredients - 2012, 2017 & 2027
Figure 121: Japan Prebiotic Ingredients Market Y-o-Y Growth (%) Projections, By Ingredients, 2012-2027
Figure 122: Japan Prebiotic Ingredients Market Attractiveness, By Ingredients, 2017-2027
Figure 123: Japan Prebiotic Ingredients Market Value Share (%) and BPS Analysis, By End Use - 2012, 2017 & 2027
Figure 124: Japan Prebiotic Ingredients Market Y-o-Y Growth (%) Projections, By End Use, 2012-2027
Figure 125: Japan Prebiotic Ingredients Market Attractiveness, By End Use, 2017-2027
Figure 126: APEJ Prebiotic Ingredients Market Value (US$ Mn) and Volume (MT), 2012-2016
Figure 127: APEJ Prebiotic Ingredients Market Value (US$ Mn) and Volume (MT) Forecast, 2017-2027
Figure 128: GCC Prebiotic Ingredients Market Absolute $ Opportunity (US$ Mn), 2012 to 2016-2027
Figure 129: North Africa Prebiotic Ingredients Market Absolute $ Opportunity (US$ Mn), 2012 to 2016-2027
Figure 130: South Africa Prebiotic Ingredients Market Absolute $ Opportunity (US$ Mn), 2012 to 2016-2027
Figure 131: Rest of MEA Prebiotic Ingredients Market Absolute $ Opportunity (US$ Mn), 2012 to 2016-2027
Figure 132: MEA Prebiotic Ingredients Market Attractiveness, By Country, 2017-2027
Figure 133: MEA Prebiotic Ingredients Market Value Share (%) and BPS Analysis, By Source, 2012, 2017 & 2027
Figure 134: MEA Prebiotic Ingredients Market Y-o-Y Growth (%) Projections, By Source , 2012-2027
Figure 135: MEA Prebiotic Ingredients Market Attractiveness, By Source, 2017-2027
Figure 136: MEA Prebiotic Ingredients Market Value Share (%) and BPS Analysis, By Ingredients - 2012, 2017 & 2027
Figure 137: MEA Prebiotic Ingredients Market Y-o-Y Growth (%) Projections, By Ingredients, 2012-2027
Figure 138: MEA Prebiotic Ingredients Market Attractiveness, By Ingredients, 2017-2027
Figure 139: MEA Prebiotic Ingredients Market Value Share (%) and BPS Analysis, By End Use - 2012, 2017 & 2027
Figure 140: MEA Prebiotic Ingredients Market Y-o-Y Growth (%) Projections, By End Use, 2012-2027
Figure 141: MEA Prebiotic Ingredients Market Attractiveness, By End Use, 2017-2027
Copyright © Transparency Market Research, Inc. All Rights reserved
Trust Online

Prebiotic Ingredients Market Insights, 2027