
Reports
Reports
Analysts’ Viewpoint on Nanophotonics Market Scenario
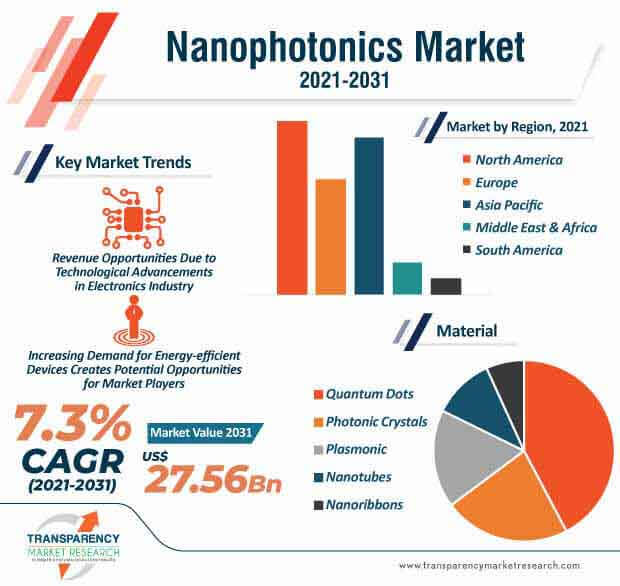
“The ongoing research and development activities in nanophotonics to develop energy-efficient electronics devices are driving the global nanophotonics market. The increasing demand for optical fibers and other telecommunication devices is contributing to market growth. Implementation of cloud services, rapid adoption of 5G, and increase in the number of players in the global market are some of the major factor driving the global nanophotonics market. Market stakeholders are extending their services arms to gain competitive edge. There is a healthy growth in market due to the demand from consumer electronics and healthcare industries. Companies in the nanophotonics market should accelerate their product development and unlock revenue opportunities to obtain competitive benefits. Digitalization and technological advancements in nanophotonics are other factors fueling market growth in developing economies.”
Many companies and manufacturing industries have temporarily shuttered their business activities due to prolonged lockdown and rapidly spreading coronavirus across the globe. Manufactures are adopting new trends and technologies to develop nanophotonics products that are useful in different end-use industries. Increasing initiatives by governments to support manufacturing industries, along with the strong presence of manufacturers operating in the nanophotonics market are driving the market growth amid the coronavirus pandemic.
Rise in the number of manufacturers in consumer electronics due to increase in demand from consumers are driving the nanophotonics market. There has been a rapid growth in sales of smartphones, laptops, smart devices, PCs, tablets, wearable devices, etc. during the coronavirus pandemic. Nanophotonics devices can be widely used in electronic component such as LED, OLED, sensors, memories, and photovoltaic cells, etc. Moreover, ongoing research & development in the field of nanophotonics is fueling global expansion.
The increasing demand for nanophotonics products is due to rising application in various end-use industries. This is expected to drive the nanophotonics market. Nanophotonics devices are increasingly being used in a growing range of applications in healthcare, IT & telecommunication, and automotive industries. The global market is driven by increasing applications of nanophotonics in consumer electronics for manufacturing electronic components. There are many industries that benefit from nanophotonics science.
Nanophotonics is a study of the interaction of matter and light at the nanometer scale. It is the scientific way of using nanotechnology in photonics or photonics in nanotechnology. Many developing countries are investing in research and development activities in nanophotonics. Digitalization, advancement in telecommunication and biotechnology, rising implementation of artificial intelligence, and surge in Internet penetration globally are some of the factors responsible for the growth of the nanophotonics market.
The increasing demand for devices that consume less energy and offer high luminance efficiency is fueling the growth of the global market.
The rising usage of nanophotonics LEDs and OLEDs for manufacturing flat panel displays and lighting applications is responsible for market growth. These energy-saving and cost-effective solutions are increasingly becoming popular with end users. Developing countries are increasing their focus on energy saving solutions. The growing popularity of large screen displays in consumers is propelling the penetration of LED & OLED.
LED/OLED are used in a wide range of applications such as TV screens, cell phones, and other electronics. In addition, there has been an increasing demand for nanophotonics high beam LEDs for ultra-high light sanitization during COVID-19 pandemic. The rising penetration of Internet, along with advancement in digitalization is contributing to the market growth in Asia Pacific during the forecast period. There is a growing presence of manufacturing companies operating in North America, India, and China. Major players in the nanophotonics market are expanding their business by collaborating with small and medium-scale manufactures.
Due to their unique properties, quantum dots can be widely used in applications such as single-electron transistors, solar cells, second-harmonic generation, LEDs, lasers, single-photon sources, quantum computing, cell biology research, microscopy, and medical imaging. These nanometer-sized semiconductor particles are made from cadmium, indium, lead, etc., and they emit light of specific wavelengths of energy is applied to them. The quantum dots are popular due to their dimensions.
There is an increasing popularity of nanomaterial such as quantum dots in nanophotonics. Major applications of quantum dots are surveying and detection, data communication, image capture, and display, medical equipment, lighting, instrumentation, research, etc. This factor propels the global nanophotonics market in the recent future.
Quantum dots are known be an efficient light source for optical interconnects, datacom/telecom, lighting and data storage, as well as low-noise photodetectors for imaging, sensing, and photovoltaic applications. These nanomaterials are used in the optical communications, data storage, imaging, and photovoltaic solar cells.
The growing competition among top market players is creating profitable opportunities for the nanophotonics market. Furthermore, the increasing demand for nanophotonics devices is driving the global market. Market players are implementing new technologies such as cloud services and artificial intelligence to design and develop energy-efficient products. Market players are also focusing on innovations and research to stay ahead of the competition. The high cost associated with research activities in nanophotonics is a major factor hampering the growth of the global market. Market contributors and governments of various countries are exploring different ways to deal with high investment costs required for the research & development. There are ample opportunities for the manufacturers operating in the Asia Pacific countries, such as China, India, Japan, and South Korea. This can be attributed to increasing demand for consumer electronics, rapid expansion of industries, technological growth, and digitalization.
| Attribute | Details |
|---|---|
| Market Size Value in 2020 (Base Year) | US$ 12.80 Bn |
| Market Forecast Value in 2031 | US$ 27.56 Bn |
| Growth Rate (CAGR) | 7.3% |
| Forecast Period | 2021-2031 |
| Quantitative Units | US$ Bn for Value |
| Market analysis | It includes cross segment analysis at global as well as regional level. Furthermore, qualitative analysis includes drivers, restraints, opportunities, key trends, porters five forces analysis, supply chain analysis, parent industry overview, etc. |
| Competition Landscape |
|
| Format | Electronic (PDF) or Word + Excel |
| Market Segmentation |
|
| Regions Covered |
|
| Countries Covered |
|
| Companies Profiled |
|
| Customization Scope | Available upon Request |
| Pricing | Available upon Request |
Nanophotonics Market is projected to reach US$ 27.56 Bn by the end of 2031
Nanophotonics Market is expected to grow at a CAGR of 7.3% during 2021-2031
Nanophotonics Market is studied from 2021-2031
Key vendors in the Nanophotonics Market are OSRAM Opto Semiconductors GmbH, Hamamatsu Photonics K.K., Nanosys Inc. QD Solar Inc., Agiltron Inc., Seoul Semiconductor Co., Ltd., Jenoptik AG, Thorlabs, Inc., ROHM CO., LTD., and OLEDWorks
North America and Asia Pacific region Takes Lead in the Nanophotonics Market
1. Preface
1.1. Market Introduction
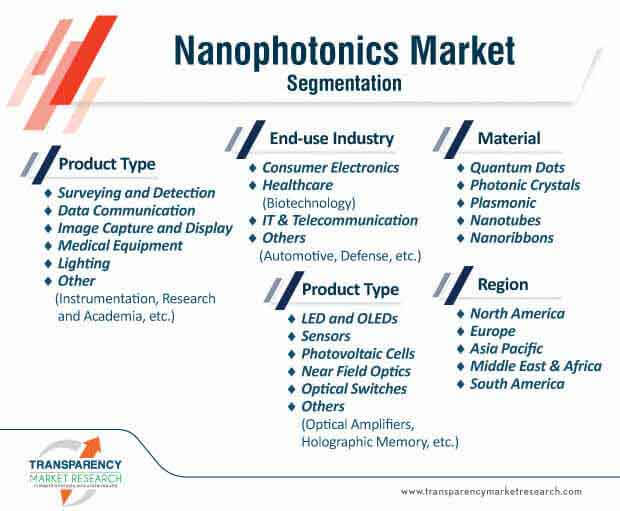
1.2. Market and Segments Definition
1.3. Market Taxonomy
1.4. Research Methodology
1.5. Assumption and Acronyms
2. Executive Summary
2.1. Global Nanophotonics Market Analysis and Forecast
2.2. Regional Outline
2.3. Market Dynamics Snapshot
2.4. Competition Blueprint
3. Market Dynamics
3.1. Macro-economic Factors
3.2. Key Market Indicator
3.3. Drivers
3.3.1. Economic Drivers
3.3.2. Supply Side Drivers
3.3.3. Demand Side Drivers
3.4. Market Restraints and Opportunities
3.5. Market Trends
3.5.1. Demand Side
3.5.2. Supply Side
3.6. Regulatory Framework
4. Associated Industry and Key Indicator Assessment
4.1. Parent Industry Overview - Photonics Industry
4.2. Supply Chain Analysis
4.3. Technology Roadmap Analysis
4.4. Industry SWOT Analysis
4.5. Porter Five Forces Analysis
4.6. COVID-19 Impact Analysis
5. Global Nanophotonics Market Analysis, by Product Type
5.1. Nanophotonics Market Size (US$ Bn) Analysis and Forecast, by Product Type, 2017-2031
5.1.1. LED and OLEDs
5.1.2. Sensors
5.1.3. Photovoltaic Cells
5.1.4. Near Field Optics
5.1.5. Optical Switches
5.1.6. Others (Optical Amplifiers, Holographic Memory, etc.)
5.2. Market Attractiveness Analysis, by Product Type
6. Global Nanophotonics Market Analysis, by Material
6.1. Nanophotonics Market Size (US$ Bn) Analysis and Forecast, by Material, 2017-2031
6.1.1. Quantum Dots
6.1.2. Photonic Crystals
6.1.3. Plasmonic
6.1.4. Nanotubes
6.1.5. Nanoribbons
6.2. Market Attractiveness Analysis, by Material
7. Global Nanophotonics Market Analysis, by Application
7.1. Nanophotonics Market Size (US$ Bn) Analysis and Forecast, by Application, 2017-2031
7.1.1. Surveying and Detection
7.1.2. Data Communication
7.1.3. Image Capture and Display
7.1.4. Medical Equipment
7.1.5. Lighting
7.1.6. Other (Instrumentation, Research and Academia, etc.)
7.2. Market Attractiveness Analysis, by Application
8. Global Nanophotonics Market Analysis, by End-use Industry
8.1. Nanophotonics Market Size (US$ Bn) Analysis and Forecast, by End-use Industry, 2017-2031
8.1.1. Consumer Electronics
8.1.2. Healthcare (Biotechnology)
8.1.3. IT & Telecommunication
8.1.4. Others (Automotive, Defense, etc.)
8.2. Market Attractiveness Analysis, by End-use Industry
9. Global Nanophotonics Market Analysis and Forecast, by Region
9.1. Nanophotonics Market Size (US$ Bn) Analysis and Forecast, by Region, 2017-2031
9.1.1. North America
9.1.2. Europe
9.1.3. Asia Pacific
9.1.4. Middle East & Africa
9.1.5. South America
9.2. Market Attractiveness Analysis, by Region
10. North America Nanophotonics Market Analysis and Forecast
10.1. Market Snapshot
10.2. Nanophotonics Market Size (US$ Bn) Analysis and Forecast, by Product Type, 2017-2031
10.2.1. LED and OLEDs
10.2.2. Sensors
10.2.3. Photovoltaic Cells
10.2.4. Near Field Optics
10.2.5. Optical Switches
10.2.6. Others (Optical Amplifiers, Holographic Memory, etc.)
10.3. Nanophotonics Market Size (US$ Bn) Analysis and Forecast, by Material, 2017-2031
10.3.1. Quantum Dots
10.3.2. Photonic Crystals
10.3.3. Plasmonic
10.3.4. Nanotubes
10.3.5. Nanoribbons
10.4. Nanophotonics Market Size (US$ Bn) Analysis and Forecast, by Application, 2017-2031
10.4.1. Surveying and Detection
10.4.2. Data Communication
10.4.3. Image Capture and Display
10.4.4. Medical Equipment
10.4.5. Lighting
10.4.6. Other (Instrumentation, Research and Academia, etc.)
10.5. Nanophotonics Market Size (US$ Bn) Analysis and Forecast, by End-use Industry, 2017-2031
10.5.1. Consumer Electronics
10.5.2. Healthcare (Biotechnology)
10.5.3. IT & Telecommunication
10.5.4. Others (Automotive, Defense, etc.)
10.6. Nanophotonics Market Size (US$ Bn) Analysis and Forecast, by Country & Sub-region, 2017-2031
10.6.1. U.S.
10.6.2. Canada
10.6.3. Rest of North America
10.7. Market Attractiveness Analysis
10.7.1. By Product Type
10.7.2. By Material
10.7.3. By Application
10.7.4. By End-use Industry
10.7.5. By Country & Sub-region
11. Europe Nanophotonics Market Analysis and Forecast
11.1. Nanophotonics Market Size (US$ Bn) Analysis and Forecast, by Product Type, 2017-2031
11.1.1. LED and OLEDs
11.1.2. Sensors
11.1.3. Photovoltaic Cells
11.1.4. Near Field Optics
11.1.5. Optical Switches
11.1.6. Others (Optical Amplifiers, Holographic Memory, etc.)
11.2. Nanophotonics Market Size (US$ Bn) Analysis and Forecast, by Material, 2017-2031
11.2.1. Quantum Dots
11.2.2. Photonic Crystals
11.2.3. Plasmonic
11.2.4. Nanotubes
11.2.5. Nanoribbons
11.3. Nanophotonics Market Size (US$ Bn) Analysis and Forecast, by Application, 2017-2031
11.3.1. Surveying and Detection
11.3.2. Data Communication
11.3.3. Image Capture and Display
11.3.4. Medical Equipment
11.3.5. Lighting
11.3.6. Other (Instrumentation, Research and Academia, etc.)
11.4. Nanophotonics Market Size (US$ Bn) Analysis and Forecast, by End-use Industry, 2017-2031
11.4.1. Consumer Electronics
11.4.2. Healthcare (Biotechnology)
11.4.3. IT & Telecommunication
11.4.4. Others (Automotive, Defense, etc.)
11.5. Nanophotonics Market Size (US$ Bn) Analysis and Forecast, by Country & Sub-region, 2017-2031
11.5.1. U.K.
11.5.2. Germany
11.5.3. France
11.5.4. Italy
11.5.5. Russia
11.5.6. Rest of Europe
11.6. Market Attractiveness Analysis
11.6.1. By Product Type
11.6.2. By Material
11.6.3. By Application
11.6.4. By End-use Industry
11.6.5. By Country & Sub-region
12. Asia Pacific Nanophotonics Market Analysis and Forecast
12.1. Nanophotonics Market Size (US$ Bn) Analysis and Forecast, by Product Type, 2017-2031
12.1.1. LED and OLEDs
12.1.2. Sensors
12.1.3. Photovoltaic Cells
12.1.4. Near Field Optics
12.1.5. Optical Switches
12.1.6. Others (Optical Amplifiers, Holographic Memory, etc.)
12.2. Nanophotonics Market Size (US$ Bn) Analysis and Forecast, by Material, 2017-2031
12.2.1. Quantum Dots
12.2.2. Photonic Crystals
12.2.3. Plasmonic
12.2.4. Nanotubes
12.2.5. Nanoribbons
12.3. Nanophotonics Market Size (US$ Bn) Analysis and Forecast, by Application, 2017-2031
12.3.1. Surveying and Detection
12.3.2. Data Communication
12.3.3. Image Capture and Display
12.3.4. Medical Equipment
12.3.5. Lighting
12.3.6. Other (Instrumentation, Research and Academia, etc.)
12.4. Nanophotonics Market Size (US$ Bn) Analysis and Forecast, by End-use Industry, 2017-2031
12.4.1. Consumer Electronics
12.4.2. Healthcare (Biotechnology)
12.4.3. IT & Telecommunication
12.4.4. Others (Automotive, Defense, etc.)
12.5. Nanophotonics Market Size (US$ Bn) Analysis and Forecast, by Country & Sub-region, 2017-2031
12.5.1. China
12.5.2. India
12.5.3. Japan
12.5.4. South Korea
12.5.5. ASEAN
12.5.6. Rest of Asia Pacific
12.6. Market Attractiveness Analysis
12.6.1. By Product Type
12.6.2. By Material
12.6.3. By Application
12.6.4. By End-use Industry
12.6.5. By Country & Sub-region
13. Middle East & Africa (MEA) Nanophotonics Market Analysis and Forecast
13.1. Nanophotonics Market Size (US$ Bn) Analysis and Forecast, by Product Type, 2017-2031
13.1.1. LED and OLEDs
13.1.2. Sensors
13.1.3. Photovoltaic Cells
13.1.4. Near Field Optics
13.1.5. Optical Switches
13.1.6. Others (Optical Amplifiers, Holographic Memory, etc.)
13.2. Nanophotonics Market Size (US$ Bn) Analysis and Forecast, by Material, 2017-2031
13.2.1. Quantum Dots
13.2.2. Photonic Crystals
13.2.3. Plasmonic
13.2.4. Nanotubes
13.2.5. Nanoribbons
13.3. Nanophotonics Market Size (US$ Bn) Analysis and Forecast, by Application, 2017-2031
13.3.1. Surveying and Detection
13.3.2. Data Communication
13.3.3. Image Capture and Display
13.3.4. Medical Equipment
13.3.5. Lighting
13.3.6. Other (Instrumentation, Research and Academia, etc.)
13.4. Nanophotonics Market Size (US$ Bn) Analysis and Forecast, by End-use Industry, 2017-2031
13.4.1. Consumer Electronics
13.4.2. Healthcare (Biotechnology)
13.4.3. IT & Telecommunication
13.4.4. Others (Automotive, Defense, etc.)
13.5. Nanophotonics Market Size (US$ Bn) Analysis and Forecast, by Country & Sub-region, 2017-2031
13.5.1. GCC
13.5.2. South Africa
13.5.3. Rest of Middle East & Africa
13.6. Market Attractiveness Analysis
13.6.1. By Product Type
13.6.2. By Material
13.6.3. By Application
13.6.4. By End-use Industry
13.6.5. By Country & Sub-region
14. South America Nanophotonics Market Analysis and Forecast
14.1. Nanophotonics Market Size (US$ Bn) Analysis and Forecast, by Product Type, 2017-2031
14.1.1. LED and OLEDs
14.1.2. Sensors
14.1.3. Photovoltaic Cells
14.1.4. Near Field Optics
14.1.5. Optical Switches
14.1.6. Others (Optical Amplifiers, Holographic Memory, etc.)
14.2. Nanophotonics Market Size (US$ Bn) Analysis and Forecast, by Material, 2017-2031
14.2.1. Quantum Dots
14.2.2. Photonic Crystals
14.2.3. Plasmonic
14.2.4. Nanotubes
14.2.5. Nanoribbons
14.3. Nanophotonics Market Size (US$ Bn) Analysis and Forecast, by Application, 2017-2031
14.3.1. Surveying and Detection
14.3.2. Data Communication
14.3.3. Image Capture and Display
14.3.4. Medical Equipment
14.3.5. Lighting
14.3.6. Other (Instrumentation, Research and Academia, etc.)
14.4. Nanophotonics Market Size (US$ Bn) Analysis and Forecast, by End-use Industry, 2017-2031
14.4.1. Consumer Electronics
14.4.2. Healthcare (Biotechnology)
14.4.3. IT & Telecommunication
14.4.4. Others (Automotive, Defense, etc.)
14.5. Nanophotonics Market Size (US$ Bn) Analysis and Forecast, by Country & Sub-region, 2017-2031
14.5.1. Brazil
14.5.2. Rest of South America
14.6. Market Attractiveness Analysis
14.6.1. By Product Type
14.6.2. By Material
14.6.3. By Application
14.6.4. By End-use Industry
14.6.5. By Country
15. Competition Assessment
15.1. Global Nanophotonics Market Competition Matrix - a Dashboard View
15.1.1. Global Nanophotonics Market Company Share Analysis, by Value (2020)
15.1.2. Technological Differentiator
16. Company Profiles (Manufacturers/Suppliers)
16.1. OSRAM Opto Semiconductors GmbH
16.1.1. Overview
16.1.2. Product Portfolio
16.1.3. Sales Footprint
16.1.4. Key Subsidiaries or Distributors
16.1.5. Strategy and Recent Developments
16.1.6. Financial Analysis
16.2. Hamamatsu Photonics K.K.
16.2.1. Overview
16.2.2. Product Portfolio
16.2.3. Sales Footprint
16.2.4. Key Subsidiaries or Distributors
16.2.5. Strategy and Recent Developments
16.2.6. Financial Analysis
16.3. Nanosys Inc.
16.3.1. Overview
16.3.2. Product Portfolio
16.3.3. Sales Footprint
16.3.4. Key Subsidiaries or Distributors
16.3.5. Strategy and Recent Developments
16.3.6. Financial Analysis
16.4. QD Solar Inc.
16.4.1. Overview
16.4.2. Product Portfolio
16.4.3. Sales Footprint
16.4.4. Key Subsidiaries or Distributors
16.4.5. Strategy and Recent Developments
16.4.6. Financial Analysis
16.5. Agiltron Inc.
16.5.1. Overview
16.5.2. Product Portfolio
16.5.3. Sales Footprint
16.5.4. Key Subsidiaries or Distributors
16.5.5. Strategy and Recent Developments
16.5.6. Financial Analysis
16.6. Seoul Semiconductor Co., Ltd.
16.6.1. Overview
16.6.2. Product Portfolio
16.6.3. Sales Footprint
16.6.4. Key Subsidiaries or Distributors
16.6.5. Strategy and Recent Developments
16.6.6. Financial Analysis
16.7. Jenoptik AG
16.7.1. Overview
16.7.2. Product Portfolio
16.7.3. Sales Footprint
16.7.4. Key Subsidiaries or Distributors
16.7.5. Strategy and Recent Developments
16.7.6. Financial Analysis
16.8. Thorlabs, Inc.
16.8.1. Overview
16.8.2. Product Portfolio
16.8.3. Sales Footprint
16.8.4. Key Subsidiaries or Distributors
16.8.5. Strategy and Recent Developments
16.8.6. Financial Analysis
16.9. ROHM CO., LTD.
16.9.1. Overview
16.9.2. Product Portfolio
16.9.3. Sales Footprint
16.9.4. Key Subsidiaries or Distributors
16.9.5. Strategy and Recent Developments
16.9.6. Financial Analysis
16.10. OLEDWorks
16.10.1. Overview
16.10.2. Product Portfolio
16.10.3. Sales Footprint
16.10.4. Key Subsidiaries or Distributors
16.10.5. Strategy and Recent Developments
16.10.6. Financial Analysis
17. Recommendation
17.1. Opportunity Assessment
17.1.1. By Product Type
17.1.2. By Material
17.1.3. By Application
17.1.4. By End-use Industry
17.1.5. By Region
List of Tables
Table 01: Global Nanophotonics Market Value (US$ Bn) & Forecast, by Product Type, 2017-2031
Table 02: Global Nanophotonics Market Value (US$ Bn) & Forecast, by Material, 2017-2031
Table 03: Global Nanophotonics Market Value (US$ Bn) & Forecast, by Application, 2017-2031
Table 04: Global Nanophotonics Market Value (US$ Bn) & Forecast, by End-use Industry, 2017-2031
Table 05: Global Nanophotonics Market Value (US$ Bn) & Forecast, by Region, 2017-2031
Table 06: North America Nanophotonics Market Value (US$ Bn) & Forecast, by Product Type, 2017-2031
Table 07: North America Nanophotonics Market Value (US$ Bn) & Forecast, by Material, 2017-2031
Table 08: North America Nanophotonics Market Value (US$ Bn) & Forecast, by Application, 2017-2031
Table 09: North America Nanophotonics Market Value (US$ Bn) & Forecast, by End-use Industry, 2017-2031
Table 10: North America Nanophotonics Market Value (US$ Bn) & Forecast, by Country & Sub-region, 2017-2031
Table 11: Europe Nanophotonics Market Value (US$ Bn) & Forecast, by Product Type, 2017-2031
Table 12: Europe Nanophotonics Market Value (US$ Bn) & Forecast, by Material, 2017-2031
Table 13: Europe Nanophotonics Market Value (US$ Bn) & Forecast, by Application, 2017-2031
Table 14: Europe Nanophotonics Market Value (US$ Bn) & Forecast, by End-use Industry, 2017-2031
Table 15: Europe Nanophotonics Market Value (US$ Bn) & Forecast, by Country & Sub-region, 2017-2031
Table 16: Asia Pacific Nanophotonics Market Value (US$ Bn) & Forecast, by Product Type, 2017-2031
Table 17: Asia Pacific Nanophotonics Market Value (US$ Bn) & Forecast, by Material, 2017-2031
Table 18: Asia Pacific Nanophotonics Market Value (US$ Bn) & Forecast, by Application, 2017-2031
Table 19: Asia Pacific Nanophotonics Market Value (US$ Bn) & Forecast, by End-use Industry, 2017-2031
Table 20: Asia Pacific Nanophotonics Market Value (US$ Bn) & Forecast, by Country & Sub-region, 2017-2031
Table 21: Middle East & Africa (MEA) Nanophotonics Market Value (US$ Bn) & Forecast, by Product Type, 2017-2031
Table 22: Middle East & Africa (MEA) Nanophotonics Market Value (US$ Bn) & Forecast, by Material, 2017-2031
Table 23: Middle East & Africa (MEA) Nanophotonics Market Value (US$ Bn) & Forecast, by Application, 2017-2031
Table 24: Middle East & Africa (MEA) Nanophotonics Market Value (US$ Bn) & Forecast, by End-use Industry, 2017-2031
Table 25: Middle East & Africa (MEA) Nanophotonics Market Value (US$ Bn) & Forecast, by Country & Sub-region, 2017-2031
Table 26: South America Nanophotonics Market Value (US$ Bn) & Forecast, by Product Type, 2017-2031
Table 27: South America Nanophotonics Market Value (US$ Bn) & Forecast, by Material, 2017-2031
Table 28: South America Nanophotonics Market Value (US$ Bn) & Forecast, by Application, 2017-2031
Table 29: South America Nanophotonics Market Value (US$ Bn) & Forecast, by End-use Industry, 2017-2031
Table 30: South America Nanophotonics Market Value (US$ Bn) & Forecast, by Country & Sub-region, 2017-2031
List of Figures
Figure 01: Global Nanophotonics Market, Value (US$ Bn), 2017-2031
Figure 02: Global Nanophotonics Market, Value (US$ Bn), 2017-2031
Figure 03: Global Nanophotonics Market Size & Forecast, by Product Type, Revenue (US$ Bn), 2017-2031
Figure 04: Global Nanophotonics Market Attractiveness, By Product Type, Value (US$ Bn), 2021-2031
Figure 05: Global Nanophotonics Market Value (US$ Bn) & Forecast, by Product Type, 2021-2031
Figure 06: Global Nanophotonics Market Size & Forecast, by Material, Revenue (US$ Bn), 2017-2031
Figure 07: Global Nanophotonics Market Attractiveness, By Material, Value (US$ Bn), 2021-2031
Figure 08: Global Nanophotonics Market Value (US$ Bn) & Forecast, by Material, 2021-2031
Figure 09: Global Nanophotonics Market Size & Forecast, by Application, Revenue (US$ Bn), 2017-2031
Figure 10: Global Nanophotonics Market Attractiveness, By Application, Value (US$ Bn), 2021-2031
Figure 11: Global Nanophotonics Market Value (US$ Bn) & Forecast, by Application, 2021-2031
Figure 12: Global Nanophotonics Market Size & Forecast, by End-use industry, Revenue (US$ Bn), 2017-2031
Figure 13: Global Nanophotonics Market Attractiveness, By End-use Industry, Value (US$ Bn), 2021-2031
Figure 14: Global Nanophotonics Market Value (US$ Bn) & Forecast, by End-use Industry, 2021-2031
Figure 15: Global Nanophotonics Market Size & Forecast, by Region, Revenue (US$ Bn), 2017-2031
Figure 16: Global Nanophotonics Market Attractiveness, By Region, Value (US$ Bn), 2021-2031
Figure 17: Global Nanophotonics Market Value (US$ Bn) & Forecast, by Region, 2021-2031
Figure 18: North America Nanophotonics Market, Value (US$ Bn), 2017-2031
Figure 19: North America Nanophotonics Market, Value (US$ Bn), 2017-2031
Figure 20: North America Nanophotonics Market Size & Forecast, by Product Type, Revenue (US$ Bn), 2017-2031
Figure 21: North America Nanophotonics Market Attractiveness, By Product Type, Value (US$ Bn), 2021-2031
Figure 22: North America Nanophotonics Market Value (US$ Bn) & Forecast, by Product Type, 2021-2031
Figure 23: North America Nanophotonics Market Size & Forecast, by Material, Revenue (US$ Bn), 2017-2031
Figure 24: North America Nanophotonics Market Attractiveness, By Material, Value (US$ Bn), 2021-2031
Figure 25: North America Nanophotonics Market Value (US$ Bn) & Forecast, by Material, 2021-2031
Figure 26: North America Nanophotonics Market Size & Forecast, by Application, Revenue (US$ Bn), 2017-2031
Figure 27: North America Nanophotonics Market Attractiveness, By Application, Value (US$ Bn), 2021-2031
Figure 28: North America Nanophotonics Market Value (US$ Bn) & Forecast, by Application, 2021-2031
Figure 29: North America Nanophotonics Market Size & Forecast, by End-use industry, Revenue (US$ Bn), 2017-2031
Figure 30: North America Nanophotonics Market Attractiveness, By End-use Industry, Value (US$ Bn), 2021-2031
Figure 31: North America Nanophotonics Market Value (US$ Bn) & Forecast, by End-use Industry, 2021-2031
Figure 32: North America Nanophotonics Market Size & Forecast, by Country, Revenue (US$ Bn), 2017-2031
Figure 33: North America Nanophotonics Market Attractiveness, By Country, Value (US$ Bn), 2021-2031
Figure 34: North America Nanophotonics Market Value (US$ Bn) & Forecast, by Country & Sub-region, 2021-2031
Figure 35: Europe Nanophotonics Market, Value (US$ Bn), 2017-2031
Figure 36: Europe Nanophotonics Market, Value (US$ Bn), 2017-2031
Figure 37: Europe Nanophotonics Market Size & Forecast, by Product Type, Revenue (US$ Bn), 2017-2031
Figure 38: Europe Nanophotonics Market Attractiveness, By Product Type, Value (US$ Bn), 2021-2031
Figure 39: Europe Nanophotonics Market Value (US$ Bn) & Forecast, by Product Type, 2021-2031
Figure 40: Europe Nanophotonics Market Size & Forecast, by Material, Revenue (US$ Bn), 2017-2031
Figure 41: Europe Nanophotonics Market Attractiveness, By Material, Value (US$ Bn), 2021-2031
Figure 42: Europe Nanophotonics Market Value (US$ Bn) & Forecast, by Material, 2021-2031
Figure 43: Europe Nanophotonics Market Size & Forecast, by Application, Revenue (US$ Bn), 2017-2031
Figure 44: Europe Nanophotonics Market Attractiveness, By Application, Value (US$ Bn), 2021-2031
Figure 45: Europe Nanophotonics Market Value (US$ Bn) & Forecast, by Application, 2021-2031
Figure 46: Europe Nanophotonics Market Size & Forecast, by End-use industry, Revenue (US$ Bn), 2017-2031
Figure 47: Europe Nanophotonics Market Attractiveness, By End-use Industry, Value (US$ Bn), 2021-2031
Figure 48: Europe Nanophotonics Market Value (US$ Bn) & Forecast, by End-use Industry, 2021-2031
Figure 49: Europe Nanophotonics Market Size & Forecast, by Country, Revenue (US$ Bn), 2017-2031
Figure 50: Europe Nanophotonics Market Attractiveness, By Country, Value (US$ Bn), 2021-2031
Figure 51: Europe Nanophotonics Market Value (US$ Bn) & Forecast, by Country & Sub-region, 2021-2031
Figure 52: Asia Pacific Nanophotonics Market, Value (US$ Bn), 2017-2031
Figure 53: Asia Pacific Nanophotonics Market, Value (US$ Bn), 2017-2031
Figure 54: Asia Pacific Nanophotonics Market Size & Forecast, by Product Type, Revenue (US$ Bn), 2017-2031
Figure 55: Asia Pacific Nanophotonics Market Attractiveness, By Product Type, Value (US$ Bn), 2021-2031
Figure 56: Asia Pacific Nanophotonics Market Value (US$ Bn) & Forecast, by Product Type, 2021-2031
Figure 57: Asia Pacific Nanophotonics Market Size & Forecast, by Material, Revenue (US$ Bn), 2017-2031
Figure 58: Asia Pacific Nanophotonics Market Attractiveness, By Material, Value (US$ Bn), 2021-2031
Figure 59: Asia Pacific Nanophotonics Market Value (US$ Bn) & Forecast, by Material, 2021-2031
Figure 60: Asia Pacific Nanophotonics Market Size & Forecast, by Application, Revenue (US$ Bn), 2017-2031
Figure 61: Asia Pacific Nanophotonics Market Attractiveness, By Application, Value (US$ Bn), 2021-2031
Figure 62: Asia Pacific Nanophotonics Market Value (US$ Bn) & Forecast, by Application, 2021-2031
Figure 63: Asia Pacific Nanophotonics Market Size & Forecast, by End-use industry, Revenue (US$ Bn), 2017-2031
Figure 64: Asia Pacific Nanophotonics Market Attractiveness, By End-use Industry, Value (US$ Bn), 2021-2031
Figure 65: Asia Pacific Nanophotonics Market Value (US$ Bn) & Forecast, by End-use Industry, 2021-2031
Figure 66: Asia Pacific Nanophotonics Market Size & Forecast, by Country, Revenue (US$ Bn), 2017-2031
Figure 67: Asia Pacific Nanophotonics Market Attractiveness, By Country, Value (US$ Bn), 2021-2031
Figure 68: Asia Pacific Nanophotonics Market Value (US$ Bn) & Forecast, by Country & Sub-region, 2021-2031
Figure 69: Middle East & Africa (MEA) Nanophotonics Market, Value (US$ Bn), 2017-2031
Figure 70: Middle East & Africa (MEA) Nanophotonics Market, Value (US$ Bn), 2017-2031
Figure 71: Middle East & Africa (MEA) Nanophotonics Market Size & Forecast, by Product Type, Revenue (US$ Bn), 2017-2031
Figure 72: Middle East & Africa (MEA) Nanophotonics Market Attractiveness, By Product Type, Value (US$ Bn), 2021-2031
Figure 73: Middle East & Africa (MEA) Nanophotonics Market Value (US$ Bn) & Forecast, by Product Type, 2021-2031
Figure 74: Middle East & Africa (MEA) Nanophotonics Market Size & Forecast, by Material, Revenue (US$ Bn), 2017-2031
Figure 75: Middle East & Africa (MEA) Nanophotonics Market Attractiveness, By Material, Value (US$ Bn), 2021-2031
Figure 76: Middle East & Africa (MEA) Nanophotonics Market Value (US$ Bn) & Forecast, by Material, 2021-2031
Figure 77: Middle East & Africa (MEA) Nanophotonics Market Size & Forecast, by Application, Revenue (US$ Bn), 2017-2031
Figure 78: Middle East & Africa (MEA) Nanophotonics Market Attractiveness, By Application, Value (US$ Bn), 2021-2031
Figure 79: Middle East & Africa (MEA) Nanophotonics Market Value (US$ Bn) & Forecast, by Application, 2021-2031
Figure 80: Middle East & Africa (MEA) Nanophotonics Market Size & Forecast, by End-use industry, Revenue (US$ Bn), 2017-2031
Figure 81: Middle East & Africa (MEA) Nanophotonics Market Attractiveness, By End-use Industry, Value (US$ Bn), 2021-2031
Figure 82: Middle East & Africa (MEA) Nanophotonics Market Value (US$ Bn) & Forecast, by End-use Industry, 2021-2031
Figure 83: Middle East & Africa (MEA) Nanophotonics Market Size & Forecast, by Country, Revenue (US$ Bn), 2017-2031
Figure 84: Middle East & Africa (MEA)Nanophotonics Market Attractiveness, By Country, Value (US$ Bn), 2021-2031
Figure 85: Middle East & Africa (MEA)Nanophotonics Market Value (US$ Bn) & Forecast, by Country & Sub-region, 2021-2031
Figure 86: South America Nanophotonics Market, Value (US$ Bn), 2017-2031
Figure 87: South America Nanophotonics Market, Value (US$ Bn), 2017-2031
Figure 88: South America Nanophotonics Market Size & Forecast, by Product Type, Revenue (US$ Bn), 2017-2031
Figure 89: South America Nanophotonics Market Attractiveness, By Product Type, Value (US$ Bn), 2021-2031
Figure 90: South America Nanophotonics Market Value (US$ Bn) & Forecast, by Product Type, 2021-2031
Figure 91: South America Nanophotonics Market Size & Forecast, by Material, Revenue (US$ Bn), 2017-2031
Figure 92: South America Nanophotonics Market Attractiveness, By Material, Value (US$ Bn), 2021-2031
Figure 93: South America Nanophotonics Market Value (US$ Bn) & Forecast, by Material, 2021-2031
Figure 94: South America Nanophotonics Market Size & Forecast, by Application, Revenue (US$ Bn), 2017-2031
Figure 95: South America Nanophotonics Market Attractiveness, By Application, Value (US$ Bn), 2021-2031
Figure 96: South America Nanophotonics Market Value (US$ Bn) & Forecast, by Application, 2021-2031
Figure 97: South America Nanophotonics Market Size & Forecast, by End-use industry, Revenue (US$ Bn), 2017-2031
Figure 98: South America Nanophotonics Market Attractiveness, By End-use Industry, Value (US$ Bn), 2021-2031
Figure 99: South America Nanophotonics Market Value (US$ Bn) & Forecast, by End-use Industry, 2021-2031
Figure 100: South America Nanophotonics Market Size & Forecast, by Country, Revenue (US$ Bn), 2017-2031
Figure 101: South America Nanophotonics Market Attractiveness, By Country, Value (US$ Bn), 2021-2031
Figure 102: South America Nanophotonics Market Value (US$ Bn) & Forecast, by Country & Sub-region, 2021-2031
Copyright © Transparency Market Research, Inc. All Rights reserved
Trust Online

Nanophotonics Market