
Global Intellectual Property Software Market: Overview
Intellectual property refers to the inventions, symbols, names and images used by organizations, and other properties such as artistic works. Intellectual property software enables user and organizations to effectively and efficiently manage and protect their intellectual properties. In addition, intellectual property software also helps to gain and maintain patents, trademarks, licenses, rights and others such as agreements across the intellectual property lifecycle. According to the research report, the global intellectual property software market is expected to be worth US$6,758.4 mn by the end of 2025. During the forecast period of 2017 and 2025, the global market is estimated to surge at a CAGR of 14.3%.
Deployment of Cloud-based Solutions Stokes Demand for Software Components
Intellectual property software market is segmented by component, application, and end-use industry. By component, global intellectual property software market is categorized into software, and services. Among these components, software segment is further segmented into cloud-based and on premise. Furthermore, services segment is categorized into development and implementation services, consulting services, and maintenance & support services. Among these services, maintenance & support services segment is anticipated to see flourishing growth during the forecast period. This is primarily due to rising adoption of intellectual property software across multiple end-use industries especially manufacturing, healthcare, and IT & telecommunication. Whereas cloud-based segment is expected to see increasing adoption, owning to the factor such as transition of businesses to paperless or cloud-based business models.
Healthcare and IT and Telecommunication to be Key End Users
Based on applications, global intellectual property software market is categorized into patent management, trademark management, intellectual property portfolio management, intellectual property licensing, intellectual property reporting & analytics, and others. Intellectual property licensing, reporting, & analytics segments are projected to see healthy growth during the forecast period. On the basis of end-use industry, intellectual property software market is segmented into individuals (independent inventors), banking, financial institutions, and insurance (BFSI), government, healthcare, IT and telecommunication, electronics, manufacturing, and others. Among these, healthcare, IT & telecommunication, and electronics are the key industries supplementing the growth of intellectual property software market.
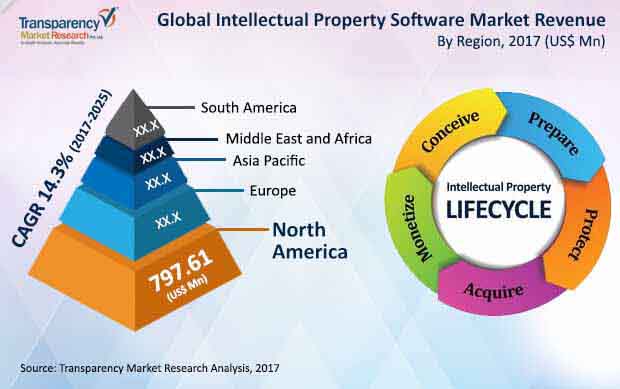
North America Slated to Lead due to Higher Awareness
Geographically, the global market is segmented into North America, Europe, the Middle East and Africa, Asia Pacific, and South America. North America held the largest share in the global market for intellectual property software market as of 2015. The high rate of patenting has been the driving force for this market in the last few years. Growing application and awareness of intellectual property rights amongst end-use industries has also benefitted the overall market. The report states that emergence of information and communication technologies is also likely to contribute towards the growth of this regional market in the forthcoming years. On the other hand, Asia Pacific is also expected to show an excellent growth rate as the region is on the verge of an economic revolution with emergence of a banking and finance sector. The emerging economies of India, China, and Indonesia are expected to be the key contributors to the intellectual property software market.
The rising penetration of intellectual property software has encouraged many regional and global companies to extend their product portfolio across the world. Among these companies, some of the major players in global intellectual property software market are Aistemos, Ambercite, Anaqua, Inc., Clarivate Analytics, Dennemeyer, Evalueserve Netherlands B.V., Gemalto NV, Gridlogics, Innography, Inc., Innovation Asset Group, Inc., Inteum Company, LLC, Iolite Softwares Inc., IP Checkups, Inc., IP Street Holdings, LLC, IPfolio, LexisNexis, Minesoft Ltd., O P Solutions, Inc., Patrix AB, PatSnap Pte. Ltd., Questel, TORViC Technologies, Inc., VajraSoft Inc., Wellspring Worldwide, and XLPAT.
Market Segmentation:
|
Component |
|
|
Application |
|
|
End-use Industries |
|
|
Geographic |
|
The global Intellectual Property Software market is expected to be worth US$6,758.4 mn by the end of 2025.
The global Intellectual Property Software market was estimated compound annual growth rate of 14.3% from 2017 - 2025.
Intellectual property software market is mainly driven by growing emphasis of companies towards the protection of intellectual assets by gaining patents, and licenses for their innovations and technologies.
Some key players operating in the Intellectual Property Software market include Aistemos, Ambercite, Anaqua, Inc., Clarivate Analytics, Dennemeyer, Evalueserve Netherlands B.V., Gemalto NV, Gridlogics, Innography, Inc., Innovation Asset Group, Inc., Inteum Company, LLC, Iolite Softwares Inc., IP Checkups, Inc., IP Street Holdings, LLC, IPfolio, LexisNexis, Minesoft Ltd., O P Solutions, Inc., Patrix AB, PatSnap Pte. Ltd., Questel, TORViC Technologies, Inc., VajraSoft Inc., Wellspring Worldwide.
North America intellectual property software market held a share of 30% and is expected continue its dominance in the forthcoming years.
1.Preface
1.1.Market Definition and Scope
1.2.Market Segmentation
1.3.Key Research Objectives
1.4.Research Highlights
2.Assumptions and Research Methodology
3.Executive Summary : Global Intellectual Property software Market
4.Market Overview
4.1.Introduction
4.2.Market Dynamics
4.2.1.Drivers
4.2.2.Restraints
4.2.3.Opportunities
4.3.Key Market Indicators
4.3.1.Use Cases/ Case Studies of Intellectual Property software across the industries
4.3.2.Adoption Analysis of Intellectual Property Software across End-use Applications – Independent Inventors Vs Other IP Management Companies
4.3.2.1.Challenging factors for Independent Inventors
4.4.Global Intellectual Property software Market Analysis and Forecasts, 2015 – 2025
4.4.1.Market Revenue Projections (US$ Mn)
4.4.2.Market Year-on-Year (Y-o-Y) Growth (Value %)
4.5.Porter’s Five Force Analysis
4.6.Intellectual Property software Ecosystem Analysis
4.7.Market Outlook
5.Product Overview
5.1.Software Products Overview (Top 20) –
5.1.1.Products Overview
5.1.2.Features
5.1.3.Deployment
5.1.4.Applications (User Base)
5.1.5.Developments
5.1.6.Profit Model
5.2.Intellectual Property (IP) Lifecycle (Top 20) –
5.2.1.Product Positioning Matrix across IP Lifecycle
5.3.End-use Application/ Consumer Analysis
5.3.1.Demand Analysis
5.3.2.Profit Models
5.3.3.Historic Roadmap
5.3.4.Recent Developments
5.4.Product Competition Matrix
6.Global Intellectual Property software Market Analysis and Forecast, by Component
6.1.Overview & Definitions
6.2.Key Trends
6.3.Intellectual Property software Market Size (US$ Mn) Forecast by Component, 2015 – 2025
6.3.1.Software
6.3.1.1.Cloud-based
6.3.1.2.On Premise
6.3.2.Services
6.3.2.1.Development & Implementation Services
6.3.2.2.Consulting Services
6.3.2.3.Maintenance & Support Services
6.4.Component Comparison Matrix
6.5.Market Attractiveness by Component
7.Global Intellectual Property software Market Analysis and Forecast, by Application
7.1.Overview & Definition
7.2.Key Trends
7.3.Intellectual Property software Market Size (US$ Mn) Forecast by Application, 2015 – 2025
7.3.1.Patent Management
7.3.2.Trademark Management
7.3.3.Intellectual Property (IP) Portfolio Management
7.3.4.Intellectual Property (IP) Licensing
7.3.5.Intellectual Property (IP) Reporting & Analytics
7.3.6.Others
7.4.Application Comparison Matrix
7.5.Market Attractiveness by Application
8.Global Intellectual Property software Market Analysis and Forecast, by End-user Industry
8.1.Overview & Definition
8.2.Key Trends
8.3.Intellectual Property software Market Size (US$ Mn) Forecast by End-user Industry, 2015 – 2025
8.3.1.Individuals (independent Inventors)
8.3.2.Enterprises
8.3.2.1.Banking, Financial Institutions, and Insurance (BFSI)
8.3.2.2.Government
8.3.2.3.Healthcare
8.3.2.4.IT & Telecommunication
8.3.2.5.Electronics
8.3.2.6.Manufacturing
8.3.2.7.Others
8.4.End-user Industry Comparison Matrix
8.5.Market Attractiveness by End-user Industry
9.Global Intellectual Property software Market Analysis and Forecast, by Region
9.1.Key Findings
9.2.Policies and Regulations
9.3.Intellectual Property software Market Size (US$ Mn) Forecast by Region, 2015 – 2025
9.3.1.North America
9.3.2.Europe
9.3.3.Asia Pacific
9.3.4.Middle East and Africa
9.3.5.South America
9.4.Market Attractiveness by Region
10.North America Intellectual Property software Market Analysis and Forecast
10.1.Key Findings
10.2.Key Trends
10.3.Intellectual Property software Market Size (US$ Mn) Forecast by Component, 2015 – 2025
10.3.1.Software
10.3.1.1.Cloud-based
10.3.1.2.On Premise
10.3.2.Services
10.3.2.1.Development & Implementation Services
10.3.2.2.Consulting Services
10.3.2.3.Maintenance & Support Services
10.4.Intellectual Property software Market Size (US$ Mn) Forecast by Application, 2015 – 2025
10.4.1.Patent Management
10.4.2.Trademark Management
10.4.3.Intellectual Property (IP) Portfolio Management
10.4.4.Intellectual Property (IP) Licensing
10.4.5.Intellectual Property (IP) Reporting & Analytics
10.4.6.Others
10.5.Intellectual Property software Market Size (US$ Mn) Forecast by End-user Industry, 2015 – 2025
10.5.1.Individuals (independent Inventors)
10.5.2.Enterprises
10.5.2.1.Banking, Financial Institutions, and Insurance (BFSI)
10.5.2.2.Government
10.5.2.3.Healthcare
10.5.2.4.IT & Telecommunication
10.5.2.5.Electronics
10.5.2.6.Manufacturing
10.5.2.7.Others
10.6.Intellectual Property software Market Size (US$ Mn) Forecast by Country, 2015 – 2025
10.6.1.The U.S.
10.6.2.Canada
10.6.3.Rest of North America
10.7.Market Attractiveness Analysis
10.7.1.By Country
10.7.2.By Component
10.7.3.By Application
10.7.4.By End-user Industry
11.Europe Intellectual Property software Market Analysis and Forecast
11.1.Key Findings
11.2.Key Trends
11.3.Intellectual Property software Market Size (US$ Mn) Forecast by Component, 2015 – 2025
11.3.1.Software
11.3.1.1.Cloud-based
11.3.1.2.On Premise
11.3.2.Services
11.3.2.1.Development & Implementation Services
11.3.2.2.Consulting Services
11.3.2.3.Maintenance & Support Services
11.4.Intellectual Property software Market Size (US$ Mn) Forecast by Application, 2015 – 2025
11.4.1.Patent Management
11.4.2.Trademark Management
11.4.3.Intellectual Property (IP) Portfolio Management
11.4.4.Intellectual Property (IP) Licensing
11.4.5.Intellectual Property (IP) Reporting & Analytics
11.4.6.Others
11.5.Intellectual Property software Market Size (US$ Mn) Forecast by End-user Industry, 2015 – 2025
11.5.1.Individuals (independent Inventors)
11.5.2.Enterprises
11.5.2.1.Banking, Financial Institutions, and Insurance (BFSI)
11.5.2.2.Government
11.5.2.3.Healthcare
11.5.2.4.IT & Telecommunication
11.5.2.5.Electronics
11.5.2.6.Manufacturing
11.5.2.7.Others
11.6.Intellectual Property software Market Size (US$ Mn) Forecast by Country, 2015 – 2025
11.6.1.Germany
11.6.2.France
11.6.3.The U.K.
11.6.4.Italy
11.6.5.Spain
11.6.6.Rest of Europe
11.7.Market Attractiveness Analysis
11.7.1.By Country
11.7.2.By Component
11.7.3.By Application
11.7.4.By End-user Industry
12.Asia Pacific Intellectual Property software Market Analysis and Forecast
12.1.Key Findings
12.2.Key Trends
12.3.Intellectual Property software Market Size (US$ Mn) Forecast by Component, 2015 – 2025
12.3.1.Software
12.3.1.1.Cloud-based
12.3.1.2.On Premise
12.3.2.Services
12.3.2.1.Development & Implementation Services
12.3.2.2.Consulting Services
12.3.2.3.Maintenance & Support Services
12.4.Intellectual Property software Market Size (US$ Mn) Forecast by Application, 2015 – 2025
12.4.1.Patent Management
12.4.2.Trademark Management
12.4.3.Intellectual Property (IP) Portfolio Management
12.4.4.Intellectual Property (IP) Licensing
12.4.5.Intellectual Property (IP) Reporting & Analytics
12.4.6.Others
12.5.Intellectual Property software Market Size (US$ Mn) Forecast by End-user Industry, 2015 – 2025
12.5.1.Individuals (independent Inventors)
12.5.2.Enterprises
12.5.2.1.Banking, Financial Institutions, and Insurance (BFSI)
12.5.2.2.Government
12.5.2.3.Healthcare
12.5.2.4.IT & Telecommunication
12.5.2.5.Electronics
12.5.2.6.Manufacturing
12.5.2.7.Others
12.6.Intellectual Property software Market Size (US$ Mn) Forecast by Country, 2015 – 2025
12.6.1.China
12.6.2.Japan
12.6.3.India
12.6.4.Australia
12.6.5.Rest of Asia Pacific
12.7.Market Attractiveness Analysis
12.7.1.By Country
12.7.2.By Component
12.7.3.By Application
12.7.4.By End-user Industry
13.Middle East and Africa (MEA) Intellectual Property software Market Analysis and Forecast
13.1.Key Findings
13.2.Key Trends
13.3.Intellectual Property software Market Size (US$ Mn) Forecast by Component, 2015 – 2025
13.3.1.Software
13.3.1.1.Cloud-based
13.3.1.2.On Premise
13.3.2.Services
13.3.2.1.Development & Implementation Services
13.3.2.2.Consulting Services
13.3.2.3.Maintenance & Support Services
13.4.Intellectual Property software Market Size (US$ Mn) Forecast by Application, 2015 – 2025
13.4.1.Patent Management
13.4.2.Trademark Management
13.4.3.Intellectual Property (IP) Portfolio Management
13.4.4.Intellectual Property (IP) Licensing
13.4.5.Intellectual Property (IP) Reporting & Analytics
13.4.6.Others
13.5.Intellectual Property software Market Size (US$ Mn) Forecast by End-user Industry, 2015 – 2025
13.5.1.Individuals (independent Inventors)
13.5.2.Enterprises
13.5.2.1.Banking, Financial Institutions, and Insurance (BFSI)
13.5.2.2.Government
13.5.2.3.Healthcare
13.5.2.4.IT & Telecommunication
13.5.2.5.Electronics
13.5.2.6.Manufacturing
13.5.2.7.Others
13.6.Intellectual Property software Market Size (US$ Mn) Forecast by Country, 2015 – 2025
13.6.1.United Arab Emirates (U.A.E.)
13.6.2.Saudi Arabia
13.6.3.South Africa
13.6.4.Rest of MEA
13.7.Market Attractiveness Analysis
13.7.1.By Country
13.7.2.By Component
13.7.3.By Application
13.7.4.By End-user Industry
14.South America Intellectual Property software Market Analysis and Forecast
14.1.Key Findings
14.2.Key Trends
14.3.Intellectual Property software Market Size (US$ Mn) Forecast by Component, 2015 – 2025
14.3.1.Software
14.3.1.1.Cloud-based
14.3.1.2.On Premise
14.3.2.Services
14.3.2.1.Development & Implementation Services
14.3.2.2.Consulting Services
14.3.2.3.Maintenance & Support Services
14.4.Intellectual Property software Market Size (US$ Mn) Forecast by Application, 2015 – 2025
14.4.1.Patent Management
14.4.2.Trademark Management
14.4.3.Intellectual Property (IP) Portfolio Management
14.4.4.Intellectual Property (IP) Licensing
14.4.5.Intellectual Property (IP) Reporting & Analytics
14.4.6.Others
14.5.Intellectual Property software Market Size (US$ Mn) Forecast by End-user Industry, 2015 – 2025
14.5.1.Individuals (independent Inventors)
14.5.2.Enterprises
14.5.2.1.Banking, Financial Institutions, and Insurance (BFSI)
14.5.2.2.Government
14.5.2.3.Healthcare
14.5.2.4.IT & Telecommunication
14.5.2.5.Electronics
14.5.2.6.Manufacturing
14.5.2.7.Others
14.6.Intellectual Property software Market Size (US$ Mn) Forecast by Country, 2015 – 2025
14.6.1.Brazil
14.6.2.Rest of South America
14.7.Market Attractiveness Analysis
14.7.1.By Country
14.7.2.By Component
14.7.3.By Application
14.7.4.By End-user Industry
15.Competition Landscape
15.1.Market Player – Competition Matrix
15.2.Market Share Analysis by Company (2016)
15.3.Market Share Analysis by Application (2016)
15.4.Company Profiles
15.4.1.Aistemos
15.4.1.1.Company Details (Headquarter, Foundation Year, & Employee Strength)
15.4.1.2.Company Description
15.4.1.3.SWOT Analysis
15.4.1.4.Annual Revenue
15.4.1.5.Strategic Overview
15.4.2.Ambercite
15.4.2.1.Company Details (Headquarter, Foundation Year, & Employee Strength)
15.4.2.2.Company Description
15.4.2.3.SWOT Analysis
15.4.2.4.Annual Revenue
15.4.2.5.Strategic Overview
15.4.3.Anaqua, Inc.
15.4.3.1.Company Details (Headquarter, Foundation Year, & Employee Strength)
15.4.3.2.Company Description
15.4.3.3.SWOT Analysis
15.4.3.4.Annual Revenue
15.4.3.5.Strategic Overview
15.4.4.Clarivate Analytics
15.4.4.1.Company Details (Headquarter, Foundation Year, & Employee Strength)
15.4.4.2.Company Description
15.4.4.3.SWOT Analysis
15.4.4.4.Annual Revenue
15.4.4.5.Strategic Overview
15.4.5.Dennemeyer
15.4.5.1.Company Details (Headquarter, Foundation Year, & Employee Strength)
15.4.5.2.Company Description
15.4.5.3.SWOT Analysis
15.4.5.4.Annual Revenue
15.4.5.5.Strategic Overview
15.4.6.Evalueserve Netherlands B.V.
15.4.6.1.Company Details (Headquarter, Foundation Year, & Employee Strength)
15.4.6.2.Company Description
15.4.6.3.SWOT Analysis
15.4.6.4.Annual Revenue
15.4.6.5.Strategic Overview
15.4.7.Gemalto NV
15.4.7.1.Company Details (Headquarter, Foundation Year, & Employee Strength)
15.4.7.2.Company Description
15.4.7.3.SWOT Analysis
15.4.7.4.Annual Revenue
15.4.7.5.Strategic Overview
15.4.8.Gridlogics
15.4.8.1.Company Details (Headquarter, Foundation Year, & Employee Strength)
15.4.8.2.Company Description
15.4.8.3.SWOT Analysis
15.4.8.4.Annual Revenue
15.4.8.5.Strategic Overview
15.4.9.Innography, Inc.
15.4.9.1.Company Details (Headquarter, Foundation Year, & Employee Strength)
15.4.9.2.Company Description
15.4.9.3.SWOT Analysis
15.4.9.4.Annual Revenue
15.4.9.5.Strategic Overview
15.4.10.Innovation Asset Group, Inc.
15.4.10.1.Company Details (Headquarter, Foundation Year, & Employee Strength)
15.4.10.2.Company Description
15.4.10.3.SWOT Analysis
15.4.10.4.Annual Revenue
15.4.10.5.Strategic Overview
15.4.11.Inteum Company, LLC
15.4.11.1.Company Details (Headquarter, Foundation Year, & Employee Strength)
15.4.11.2.Company Description
15.4.11.3.SWOT Analysis
15.4.11.4.Annual Revenue
15.4.11.5.Strategic Overview
15.4.12.Iolite Softwares Inc.
15.4.12.1.Company Details (Headquarter, Foundation Year, & Employee Strength)
15.4.12.2.Company Description
15.4.12.3.SWOT Analysis
15.4.12.4.Annual Revenue
15.4.12.5.Strategic Overview
15.4.13.IP Checkups, Inc.
15.4.13.1.Company Details (Headquarter, Foundation Year, & Employee Strength)
15.4.13.2.Company Description
15.4.13.3.SWOT Analysis
15.4.13.4.Annual Revenue
15.4.13.5.Strategic Overview
15.4.14.IP Street Holdings, LLC
15.4.14.1.Company Details (Headquarter, Foundation Year, & Employee Strength)
15.4.14.2.Company Description
15.4.14.3.SWOT Analysis
15.4.14.4.Annual Revenue
15.4.14.5.Strategic Overview
15.4.15.IPfolio
15.4.15.1.Company Details (Headquarter, Foundation Year, & Employee Strength)
15.4.15.2.Company Description
15.4.15.3.SWOT Analysis
15.4.15.4.Annual Revenue
15.4.15.5.Strategic Overview
15.4.16.LexisNexis
15.4.16.1.Company Details (Headquarter, Foundation Year, & Employee Strength)
15.4.16.2.Company Description
15.4.16.3.SWOT Analysis
15.4.16.4.Annual Revenue
15.4.16.5.Strategic Overview
15.4.17.Minesoft Ltd
15.4.17.1.Company Details (Headquarter, Foundation Year, & Employee Strength)
15.4.17.2.Company Description
15.4.17.3.SWOT Analysis
15.4.17.4.Annual Revenue
15.4.17.5.Strategic Overview
15.4.18.O P Solutions, Inc.
15.4.18.1.Company Details (Headquarter, Foundation Year, & Employee Strength)
15.4.18.2.Company Description
15.4.18.3.SWOT Analysis
15.4.18.4.Annual Revenue
15.4.18.5.Strategic Overview
15.4.19.Patrix AB
15.4.19.1.Company Details (Headquarter, Foundation Year, & Employee Strength)
15.4.19.2.Company Description
15.4.19.3.SWOT Analysis
15.4.19.4.Annual Revenue
15.4.19.5.Strategic Overview
15.4.20.PatSnap Pte. Ltd.
15.4.20.1.Company Details (Headquarter, Foundation Year, & Employee Strength)
15.4.20.2.Company Description
15.4.20.3.SWOT Analysis
15.4.20.4.Annual Revenue
15.4.20.5.Strategic Overview
15.4.21.Questel
15.4.21.1.Company Details (Headquarter, Foundation Year, & Employee Strength)
15.4.21.2.Company Description
15.4.21.3.SWOT Analysis
15.4.21.4.Annual Revenue
15.4.21.5.Strategic Overview
15.4.22.TORViC Technologies, Inc.
15.4.22.1.Company Details (Headquarter, Foundation Year, & Employee Strength)
15.4.22.2.Company Description
15.4.22.3.SWOT Analysis
15.4.22.4.Annual Revenue
15.4.22.5.Strategic Overview
15.4.23.VajraSoft Inc.
15.4.23.1.Company Details (Headquarter, Foundation Year, & Employee Strength)
15.4.23.2.Company Description
15.4.23.3.SWOT Analysis
15.4.23.4.Annual Revenue
15.4.23.5.Strategic Overview
15.4.24.Wellspring Worldwide
15.4.24.1.Company Details (Headquarter, Foundation Year, & Employee Strength)
15.4.24.2.Company Description
15.4.24.3.SWOT Analysis
15.4.24.4.Annual Revenue
15.4.24.5.Strategic Overview
15.4.25.XLPAT
15.4.25.1.Company Details (Headquarter, Foundation Year, & Employee Strength)
15.4.25.2.Company Description
15.4.25.3.SWOT Analysis
15.4.25.4.Annual Revenue
15.4.25.5.Strategic Overview
16.Key Takeaways
List of Tables
Table1: Global Intellectual Property Software Market Size and Forecast, By Component, 2015 – 2025 (US$ Mn)
Table2: Global Intellectual Property Software Market Size and Forecast, By Software, 2015 – 2025 (US$ Mn)
Table3: Global Intellectual Property Software Market Size and Forecast, By Services, 2015 – 2025 (US$ Mn)
Table4: Global Intellectual Property Software Market Size and Forecast, By Application, 2015 – 2025 (US$ Mn)
Table5: Global Intellectual Property Software Market Size and Forecast, By End-use Industry, 2015 – 2025 (US$ Mn)
Table6: Global Intellectual Property Software Market Size and Forecast, By Region, 2015 – 2025 (US$ Mn)
Table7: North America Intellectual Property Software Market Size and Forecast, By Component, 2015 – 2025 (US$ Mn)
Table8: North America Intellectual Property Software Market Size and Forecast, By Software, 2015 – 2025 (US$ Mn)
Table9: North America Intellectual Property Software Market Size and Forecast, By Services, 2015 – 2025 (US$ Mn)
Table10: North America Intellectual Property Software Market Size and Forecast, By Application, 2015 – 2025 (US$ Mn)
Table11: North America Intellectual Property Software Market Size and Forecast, By Enterprises, 2015 – 2025 (US$ Mn)
Table12: North America Intellectual Property Software Market Size and Forecast, By Country, 2015 – 2025 (US$ Mn)
Table13: Europe Intellectual Property Software Market Size and Forecast, By Component, 2015 – 2025 (US$ Mn)
Table14: Europe Intellectual Property Software Market Size and Forecast, By Software, 2015 – 2025 (US$ Mn)
Table15: Europe Intellectual Property Software Market Size and Forecast, By Services, 2015 – 2025 (US$ Mn)
Table16: Europe Intellectual Property Software Market Size and Forecast, By Application, 2015 – 2025 (US$ Mn)
Table17: Europe Intellectual Property Software Market Size and Forecast, By Enterprises, 2015 – 2025 (US$ Mn)
Table18: Europe Intellectual Property Software Market Size and Forecast, By Country, 2015 – 2025 (US$ Mn)
Table19: Asia Pacific Intellectual Property Software Market Size and Forecast, By Component, 2015 – 2025 (US$ Mn)
Table20: Asia Pacific Intellectual Property Software Market Size and Forecast, By Software, 2015–2025 (US$ Mn)
Table21: Asia Pacific Intellectual Property Software Market Size and Forecast, By Services, 2015 – 2025 (US$ Mn)
Table22: Asia Pacific Intellectual Property Software Market Size and Forecast, By Application, 2015 – 2025 (US$ Mn)
Table23: Asia Pacific Intellectual Property Software Market Size and Forecast, By Enterprises, 2015 – 2025 (US$ Mn)
Table24: Asia Pacific Intellectual Property Software Market Size and Forecast, By Country, 2015 – 2025 (US$ Mn)
Table25: MEA Intellectual Property Software Market Size and Forecast, By Component, 2015–2025 (US$ Mn)
Table26: MEA Intellectual Property Software Market Size and Forecast, By Software, 2015–2025 (US$ Mn)
Table27: MEA Intellectual Property Software Market Size and Forecast, By Services, 2015–2025 (US$ Mn)
Table28: MEA Intellectual Property Software Market Size and Forecast, By Application, 2015–2025 (US$ Mn)
Table29: MEA Intellectual Property Software Market Size and Forecast, By Enterprises, 2015–2025 (US$ Mn)
Table30: MEA Intellectual Property Software Market Size and Forecast, By Country, 2015 – 2025 (US$ Mn)
Table31: South America Intellectual Property Software Market Size and Forecast, By Component, 2015 – 2025 (US$ Mn)
Table32: South America Intellectual Property Software Market Size and Forecast, By Software, 2015–2025 (US$ Mn)
Table33: South America Intellectual Property Software Market Size and Forecast, By Services, 2015 – 2025 (US$ Mn)
Table34: South America Intellectual Property Software Market Size and Forecast, By Application, 2015 – 2025 (US$ Mn)
Table35: South America Intellectual Property Software Market Size and Forecast, By Enterprises, 2015 – 2025 (US$ Mn)
Table36: South America Intellectual Property Software Market Size and Forecast, By Country, 2015 – 2025 (US$ Mn)
List of Figures
Figure 1: Global Intellectual Property Software Market Size (US$ Mn) Forecast, 2015–2025
Figure 2: Global Intellectual Property Software Market Y-o-Y Growth (Value %) Forecast, 2015 – 2025
Figure 4: Global Intellectual Property Software Market Value Share (Value %) By Component, 2017
Figure 3: Global Intellectual Property Software Market Value Share (Value %), Application, 2017
Figure 5: Global Intellectual Property Software Market Opportunity Growth Analysis (US$ Mn), 2015 – 2025
Figure 6: End-user Patent – Revenue Analysis
Figure 7: Global Intellectual Property Software Market Value Share Analysis, by Component, 2017 and 2025
Figure 8: Intellectual Property Software Market Value Share Analysis, by Software
Figure 9: Intellectual Property Software Market Value Share Analysis, by Services
Figure 10: Global Intellectual Property Software Market Value Share Analysis, by Software, 2017 and 2025
Figure 11: Intellectual Property Software Market Value Share Analysis, by Cloud-based
Figure 12: Intellectual Property Software Market Value Share Analysis, by On Premise
Figure 13: Global Intellectual Property Software Market Value Share Analysis, by Services, 2017 and 2025
Figure 14: Intellectual Property Software Market Value Share Analysis, by Development & Implementation Services
Figure 15: Intellectual Property Software Market Value Share Analysis, by Consulting Services
Figure 16: Intellectual Property Software Market Value Share Analysis, by Maintenance & Support Services
Figure 17: Global Intellectual Property Software Comparison Matrix, By Component
Figure 18: Global Intellectual Property Software Market Attractiveness Analysis, by Software
Figure 19: Global Intellectual Property Software Market Attractiveness Analysis, by Services
Figure 20: Global Intellectual Property Software Market Value Share Analysis, by Application, 2017 and 2025
Figure 21: Intellectual Property Software Market Value Share Analysis, by Patent Management
Figure 22: Intellectual Property Software Market Value Share Analysis, by Trademark Management
Figure 23: Intellectual Property Software Market Value Share Analysis, by Intellectual Property (IP) Portfolio Management
Figure 24: Intellectual Property Software Market Value Share Analysis, by Intellectual Property (IP) Licensing
Figure 25: Intellectual Property Software Market Value Share Analysis, by Intellectual Property (IP) Reporting & Analytics
Figure 26: Intellectual Property Software Market Value Share Analysis, by Others
Figure 27: Global Intellectual Property Software Comparison Matrix by Application
Figure 28: Intellectual Property Software Market Attractiveness Analysis, by Application
Figure 29: Global Intellectual Property Software Market Value Share Analysis, by End-use Industry, 2017 and 2025
Figure 30: Intellectual Property Software Market Value Share Analysis, by BFSI
Figure 31: Intellectual Property Software Market Value Share Analysis, by Government
Figure 32: Intellectual Property Software Market Value Share Analysis, by Healthcare
Figure 33: Intellectual Property Software Market Value Share Analysis, by IT & Telecommunication
Figure 34: Intellectual Property Software Market Value Share Analysis, by Electronics
Figure 35: Intellectual Property Software Market Value Share Analysis, by Manufacturing
Figure 36: Intellectual Property Software Market Value Share Analysis, by Others
Figure 37: Intellectual Property Software Market Value Share Analysis, by Independent Inventors
Figure 38: Global Intellectual Property Software Comparison Matrix by End-use Industry
Figure 39: Intellectual Property Software Market Attractiveness Analysis, by End-use Industry
Figure 40: Global Intellectual Property Software Market Value Share Analysis, by Region, 2017 and 2025
Figure 41: Intellectual Property Software Market Attractiveness Analysis, by Region
Figure 42: North America Intellectual Property Software Market Size (US$ Mn) Forecast, 2015 – 2025
Figure 43: North America Intellectual Property Software Market Value Share Analysis, By Component, 2017 and 2025
Figure 44: North America Intellectual Property Software Market Value Share Analysis, By Software, 2017 and 2025
Figure 45: North America Intellectual Property Software Market Value Share Analysis, By Services, 2017 and 2025
Figure 46: North America Intellectual Property Software Market Value Share Analysis, By Application, 2017 and 2025
Figure 47: North America Intellectual Property Software Market Value Share Analysis, By End-use Industry, 2017 and 2025
Figure 48: North America Intellectual Property Software Market Value Share Analysis, By Country, 2017 and 2025
Figure 49: North America Intellectual Property Software Market Attractiveness Analysis, By Software
Figure 50: North America Intellectual Property Software Market Attractiveness Analysis, By Services
Figure 51: North America Intellectual Property Software Market Attractiveness Analysis, By Application
Figure 52: North America Intellectual Property Software Market Attractiveness Analysis, By Country
Figure 53: North America Intellectual Property Software Market Attractiveness Analysis, By Enterprise
Figure 54: Europe Intellectual Property Software Market Size (US$ Mn) Forecast, 2015–2025
Figure 55: Europe Intellectual Property Software Market Value Share Analysis, By Component, 2017 and 2025
Figure 56: Europe Intellectual Property Software Market Value Share Analysis, By Software, 2017 and 2025
Figure 57: Europe Intellectual Property Software Market Value Share Analysis, By Services, 2017 and 2025
Figure 58: Europe Intellectual Property Software Market Value Share Analysis, By Application, 2017 and 2025
Figure 59: Europe Intellectual Property Software Market Value Share Analysis, By End-use Industry, 2017 and 2025
Figure 60: Europe Intellectual Property Software Market Value Share Analysis, By Country, 2017 and 2025
Figure 61: Europe Intellectual Property Software Market Attractiveness Analysis, By Software
Figure 62: Europe Intellectual Property Software Market Attractiveness Analysis, By Services
Figure 63: Europe Intellectual Property Software Market Attractiveness Analysis, By Application
Figure 64: Europe Intellectual Property Software Market Attractiveness Analysis, By Country
Figure 65: Europe Intellectual Property Software Market Attractiveness Analysis, By Enterprise
Figure 66: Asia Pacific Intellectual Property Software Market Size (US$ Mn) Forecast, 2015–2025
Figure 67: Asia Pacific Intellectual Property Software Market Value Share Analysis, By Component, 2017 and 2025
Figure 68: Asia Pacific Intellectual Property Software Market Value Share Analysis, By Software, 2017 and 2025
Figure 69: Asia Pacific Intellectual Property Software Market Value Share Analysis, By Services, 2017 and 2025
Figure 70: Asia Pacific Intellectual Property Software Market Value Share Analysis, By Application, 2017 and 2025
Figure 71: Asia Pacific Intellectual Property Software Market Value Share Analysis, By End-use Industry, 2017 and 2025
Figure 72: Asia Pacific Intellectual Property Software Market Value Share Analysis, By Country, 2017 and 2025
Figure 73: Asia Pacific Intellectual Property Software Market Attractiveness Analysis, By Software
Figure 74: Asia Pacific Intellectual Property Software Market Attractiveness Analysis, By Services
Figure 75: Asia Pacific Intellectual Property Software Market Attractiveness Analysis, By Application
Figure 76: Asia Pacific Intellectual Property Software Market Attractiveness Analysis, By Country
Figure 77: Asia Pacific Intellectual Property Software Market Attractiveness Analysis, By Enterprise
Figure 78: MEA Intellectual Property Software Market Size (US$ Mn) Forecast, 2015–2025
Figure 79: MEA Intellectual Property Software Market Value Share Analysis, By Component, 2017 and 2025
Figure 80: MEA Intellectual Property Software Market Value Share Analysis, By Software, 2017 and 2025
Figure 81: MEA Intellectual Property Software Market Value Share Analysis, By Services, 2017 and 2025
Figure 82: MEA Intellectual Property Software Market Value Share Analysis, By Application, 2017 and 2025
Figure 83: MEA Intellectual Property Software Market Value Share Analysis, By End-use Industry, 2017 and 2025
Figure 84: MEA Intellectual Property Software Market Value Share Analysis, By Country, 2017 and 2025
Figure 85: MEA Intellectual Property Software Market Attractiveness Analysis, By Software
Figure 86: MEA Intellectual Property Software Market Attractiveness Analysis, By Services
Figure 87: MEA Intellectual Property Software Market Attractiveness Analysis, By Application
Figure 88: MEA Intellectual Property Software Market Attractiveness Analysis, By Country
Figure 89: MEA Intellectual Property Software Market Attractiveness Analysis, By Enterprise
Figure 90: South America Intellectual Property Software Market Size (US$ Mn) Forecast, 2015–2025
Figure 91: South America Intellectual Property Software Market Value Share Analysis, By Component, 2017 and 2025
Figure 92: South America Intellectual Property Software Market Value Share Analysis, By Software, 2017 and 2025
Figure 93: South America Intellectual Property Software Market Value Share Analysis, By Services, 2017 and 2025
Figure 94: South America Intellectual Property Software Market Value Share Analysis, By Application, 2017 and 2025
Figure 95: South America Intellectual Property Software Market Value Share Analysis, By End-use Industry, 2017 and 2025
Figure 96: South America Intellectual Property Software Market Value Share Analysis, By Country, 2017 and 2025
Figure 97: South America Intellectual Property Software Market Attractiveness Analysis, By Software
Figure 98: South America Intellectual Property Software Market Attractiveness Analysis, By Services
Figure 99: South America Intellectual Property Software Market Attractiveness Analysis, By Application
Figure 100: South America Intellectual Property Software Market Attractiveness Analysis, By Country
Figure 101: South America Intellectual Property Software Market Attractiveness Analysis, By Enterprise
Figure 102(a): Global Intellectual Property Software Market Share Analysis by Company (2016)
Figure 102(b): Global Intellectual Property Software Market Share Analysis by Company (2016)
Figure 103: Global Intellectual Property Software Market Share Analysis by Application (2016)
Copyright © Transparency Market Research, Inc. All Rights reserved
Trust Online


Intellectual Property Software Market Growth Outlook