
Reports
Reports
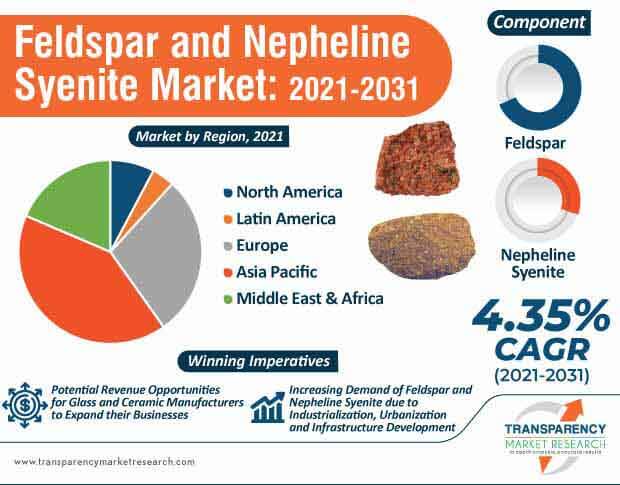
The feldspar and nepheline syenite market has been negatively affected by COVID-19. Lockdown, shutting down businesses, and construction ban lead to disruption in value chain. However, market players are recovering from losses and emerging stronger than before. Increasing applications of glass and ceramic in various industries such as construction, automotive, transportation, etc. drives the growth of the feldspar and nepheline syenite market. Feldspar is primarily used in manufacturing of glass and ceramic due to their outstanding features. Increasing applications of laminated & tempered glass in fabrication, automobiles, and transport sector are boosting the demand for glass in automobile and transportation industries. The unparalleled demand for glass and ceramic is generating revenue streams for manufacturers.
The increasing popularity of feldspar and nepheline syenite is due to its durability, toughness, low viscosity, and resistance to chemical corrosion. Strategic approach by glass manufacturing companies are creating lucrative revenue opportunities during the COVID-19 outbreak. Nepheline syenite, due to its high strength and excellent weather-resistant properties can be extremely efficient for the construction industry. Increasing population, expanding building & construction projects across the globe, growth and development of residential as well as commercial sector demand for good quality flooring material. Owing to its properties such as strength and toughness, feldspar can be widely used for floor tiles.
Rapid industrialization, growth, and development of infrastructure facilities and urbanization are some of the factor contributing to the rising demand for feldspar and nepheline syenite products across the globe, which, in turn, drives the global market. Nepheline syenite is majorly used as a fluxing agent, excellent component for the production of sanitary wares. Being an abundant source of alkalis and alumina, it lowers the temperature of a ceramic body and provides good quality sanitary ware products that are even cost-efficient. This factor is driving the feldspar and nepheline syenite market during the forecast period.
The feldspar and nepheline syenite market is projected to reach the valuation of US$ 5.67 Bn by 2031. Since nepheline syenite products are increasingly becoming popular for construction, automobiles, etc., manufacturers operating in Asian countries such as China and India are focusing on fulfilling demands from consumers. In addition, to cater the increasing demands from the industrial sector globally, nepheline syenite is exported to other countries, which further create huge business opportunities for market contributors. Feldspar is considered to be the most useful component in manufacturing of ceramic after clay. China, being the largest producer of ceramic tiles can show profitable opportunities in the global market.
The feldspar and nepheline syenite market is expected to register a CAGR of 4.35% during the forecast period. Market players are focusing on staying ahead of the competition. Advancements in the glass and ceramic industry are augmenting the feldspar and nepheline syenite market growth. Feldspar also acts as a fluxing agent due to its alumina and alkali content. Thus, it can be widely used in a variety of industrial applications. Increasing competition between market players and expanding growth opportunities help small and medium scale manufacturers to establish their brand in the feldspar and nepheline syenite market.
Analysts’ Viewpoint
Feldspar and nepheline syenite market is booming after the threatening pandemic. Owing to their unique properties, they can be used as an excellent ingredient for fillers, coatings, glass, and ceramic manufacturing. Products manufactured by key contributors in the feldspar and nepheline syenite market can be used in different applications ranges automobiles, construction, electronics, paint & coating industry, etc. Feldspar and nepheline syenite market is projected to witness continuing growth at the global level. Besides glass and ceramics, increasing applications of feldspar and nepheline syenite in other industries are also creating leveraging opportunities. In order to take potential measures to increase the production, researchers and stakeholders in the feldspar and nepheline syenite market should join forces to fulfill demands from consumers. Manufacturing companies must try to increase efforts to overcome challenges in the feldspar and nepheline syenite market.
Feldspar and Nepheline Syenite Market: Overview
Increase in Construction & Infrastructure Activities: Key Driver
Expansion of Glass Industry
Feldspar and Nepheline Syenite Market: Competition Landscape
Feldspar and Nepheline Syenite Market Snapshot
|
Attribute |
Detail |
|
Market Size Value in 2020 |
US$ 3.58 Bn |
|
Market Forecast Value in 2031 |
US$ 5.67 Bn |
|
Growth Rate (CAGR) |
4.35% |
|
Forecast Period |
2021-2031 |
|
Quantitative Units |
US$ Mn for Value & Kilo Tons for Volume |
|
Market Analysis |
It includes cross segment analysis at global as well as regional level. Furthermore, qualitative analysis includes drivers, restraints, opportunities, key trends, Porter’s Five Forces analysis, value chain analysis, and key trend analysis. |
|
Competition Landscape |
|
|
Format |
Electronic (PDF) + Excel |
|
Market Segmentation |
|
|
Key Regions Covered |
|
|
Key Countries Covered |
|
|
Key Companies Profiled |
|
|
Customization Scope |
Available upon Request |
|
Pricing |
Available upon Request |
Feldspar and Nepheline Syenite Market is expected to reach US$ 5.67 Bn By 2031
Feldspar and Nepheline Syenite Market is estimated to rise at a CAGR of 4.35% during forecast period
Rise in demand for feldspar and nepheline syenite in the construction industry is propelling the global feldspar and nepheline syenite market
Key players operating in the global feldspar and nepheline syenite market are Anglo Pacific Minerals, Covia Holdings LLC., The QUARTZ Corp, Esan, Imerys, Pacer Minerals, LLC, Minerali Industriali S.r.l., I-Minerals Inc., Sibelco, and ArrMaz.
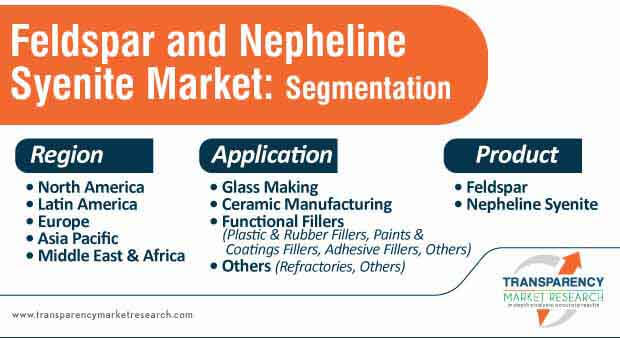
Glass Making, Ceramic Manufacturing, Functional Fillers, Plastic & Rubber Fillers, Paints & Coatings Fillers, Adhesive Fillers are the application segments in the Feldspar and Nepheline Syenite Market
1. Executive Summary
1.1. Feldspar and Nepheline Syenite Market Snapshot
1.2. Key Market Trends
1.3. Current Market and Future Potential
1.4. TMR’s Growth Opportunity Wheel
2. Market Overview
2.1. Market Segmentation
2.2. Market Indicators
2.3. Market Definitions
2.4. Market Dynamics
2.4.1. Drivers
2.4.2. Restraints
2.4.3. Opportunities
2.5. Porter’s Five Forces Analysis
2.6. Value Chain Analysis
2.6.1. List of Potential Customers
3. COVID-19 Impact Analysis
4. Feldspar and Nepheline Syenite Market Production Outlook
5. Feldspar and Nepheline Syenite Price Trend Analysis, 2020–2031
5.1. By Product
5.2. By Region
6. Global Feldspar and Nepheline Syenite Market Analysis and Forecast, by Product, 2020–2031
6.1. Introduction and Definitions
6.2. Global Feldspar and Nepheline Syenite Market Volume (Kilo tons) and Value (US$ Mn) Forecast, by Product, 2020–2031
6.2.1. Feldspar
6.2.2. Nepheline Syenite
6.3. Global Feldspar and Nepheline Syenite Market Attractiveness, by Product
7. Global Feldspar and Nepheline Syenite Market Analysis and Forecast, by Application, 2020–2031
7.1. Introduction and Definitions
7.2. Global Feldspar and Nepheline Syenite Market Volume (Kilo tons) and Value (US$ Mn) Forecast, by Application, 2020–2031
7.2.1. Glass Making
7.2.2. Ceramic Manufacturing
7.2.3. Functional Fillers
7.2.3.1. Plastic & Rubber Fillers
7.2.3.2. Paints & Coatings Fillers
7.2.3.3. Adhesive Fillers
7.2.3.4. Others
7.2.4. Others (Refractories, Other)
7.3. Global Feldspar and Nepheline Syenite Market Attractiveness, by Application
8. Global Feldspar and Nepheline Syenite Market Analysis and Forecast, by Region, 2020–2031
8.1. Key Findings
8.2. Global Feldspar and Nepheline Syenite Market Volume (Kilo tons) and Value (US$ Mn) Forecast, by Region, 2020–2031
8.2.1. North America
8.2.2. Europe
8.2.3. Asia Pacific
8.2.4. Latin America
8.2.5. Middle East & Africa
8.3. Global Feldspar and Nepheline Syenite Market Attractiveness, by Region
9. North America Feldspar and Nepheline Syenite Market Analysis and Forecast, 2020–2031
9.1. Key Findings
9.2. North America Feldspar and Nepheline Syenite Market Volume (Kilo tons) and Value (US$ Mn) Forecast, by Product, 2020–2031
9.3. North America Feldspar and Nepheline Syenite Market Volume (Kilo tons) and Value (US$ Mn) Forecast, by Application, 2020–2031
9.4. North America Feldspar and Nepheline Syenite Market Volume (Kilo tons) and Value (US$ Mn) Forecast, by Country, 2020–2031
9.4.1. U.S. Feldspar and Nepheline Syenite Market Volume (Kilo tons) and Value (US$ Mn) Forecast, by Product, 2020–2031
9.4.2. U.S. Feldspar and Nepheline Syenite Market Volume (Kilo tons) and Value (US$ Mn) Forecast, by Application, 2020–2031
9.4.3. Canada Feldspar and Nepheline Syenite Market Volume (Kilo tons) and Value (US$ Mn) Forecast, by Product, 2020–2031
9.4.4. Canada Feldspar and Nepheline Syenite Market Volume (Kilo tons) and Value (US$ Mn) Forecast, by Application, 2020–2031
9.5. North America Feldspar and Nepheline Syenite Market Attractiveness Analysis
10. Europe Feldspar and Nepheline Syenite Market Analysis and Forecast, 2020–2031
10.1. Key Findings
10.2. Europe Feldspar and Nepheline Syenite Market Volume (Kilo tons) and Value (US$ Mn) Forecast, by Product, 2020–2031
10.3. Europe Feldspar and Nepheline Syenite Market Volume (Kilo tons) and Value (US$ Mn) Forecast, by Application, 2020–2031
10.4. Europe Feldspar and Nepheline Syenite Market Volume (Kilo tons) and Value (US$ Mn) Forecast, by Country and Sub-region, 2020–2031
10.4.1. Germany Feldspar and Nepheline Syenite Market Volume (Kilo tons) and Value (US$ Mn) Forecast, by Product, 2020–2031
10.4.2. Germany Feldspar and Nepheline Syenite Market Volume (Kilo tons) and Value (US$ Mn) Forecast, by Application, 2020–2031
10.4.3. France Feldspar and Nepheline Syenite Market Volume (Kilo tons) and Value (US$ Mn) Forecast, by Product, 2020–2031
10.4.4. France Feldspar and Nepheline Syenite Market Volume (Kilo tons) and Value (US$ Mn) Forecast, by Application, 2020–2031
10.4.5. U.K. Feldspar and Nepheline Syenite Market Volume (Kilo tons) and Value (US$ Mn) Forecast, by Product, 2020–2031
10.4.6. U.K. Feldspar and Nepheline Syenite Market Volume (Kilo tons) and Value (US$ Mn) Forecast, by Application, 2020–2031
10.4.7. Italy Feldspar and Nepheline Syenite Market Volume (Kilo tons) and Value (US$ Mn) Forecast, by Product, 2020–2031
10.4.8. Italy Feldspar and Nepheline Syenite Market Volume (Kilo tons) and Value (US$ Mn) Forecast, by Application, 2020–2031
10.4.9. Spain Feldspar and Nepheline Syenite Market Volume (Kilo tons) and Value (US$ Mn) Forecast, by Product, 2020–2031
10.4.10. Spain Feldspar and Nepheline Syenite Market Volume (Kilo tons) and Value (US$ Mn) Forecast, by Application, 2020–2031
10.4.11. Russia & CIS Feldspar and Nepheline Syenite Market Volume (Kilo tons) and Value (US$ Mn) Forecast, by Product, 2020–2031
10.4.12. Russia & CIS Feldspar and Nepheline Syenite Market Volume (Kilo tons) and Value (US$ Mn) Forecast, by Application, 2020–2031
10.4.13. Rest of Europe Feldspar and Nepheline Syenite Market Volume (Kilo tons) and Value (US$ Mn) Forecast, by Product, 2020–2031
10.4.14. Rest of Europe Feldspar and Nepheline Syenite Market Volume (Kilo tons) and Value (US$ Mn) Forecast, by Application, 2020–2031
10.5. Europe Feldspar and Nepheline Syenite Market Attractiveness Analysis
11. Asia Pacific Feldspar and Nepheline Syenite Market Analysis and Forecast, 2020–2031
11.1. Key Findings
11.2. Asia Pacific Feldspar and Nepheline Syenite Market Volume (Kilo tons) and Value (US$ Mn) Forecast, by Product, 2020–2031
11.3. Asia Pacific Feldspar and Nepheline Syenite Market Volume (Kilo tons) and Value (US$ Mn) Forecast, by Application, 2020–2031
11.4. Asia Pacific Feldspar and Nepheline Syenite Market Volume (Kilo tons) and Value (US$ Mn) Forecast, by Country and Sub-region, 2020–2031
11.4.1. China Feldspar and Nepheline Syenite Market Volume (Kilo tons) and Value (US$ Mn) Forecast, by Product, 2020–2031
11.4.2. China Feldspar and Nepheline Syenite Market Volume (Kilo tons) and Value (US$ Mn) Forecast, by Application, 2020–2031
11.4.3. Japan Feldspar and Nepheline Syenite Market Volume (Kilo tons) and Value (US$ Mn) Forecast, by Product, 2020–2031
11.4.4. Japan Feldspar and Nepheline Syenite Market Volume (Kilo tons) and Value (US$ Mn) Forecast, by Application, 2020–2031
11.4.5. India Feldspar and Nepheline Syenite Market Volume (Kilo tons) and Value (US$ Mn) Forecast, by Product, 2020–2031
11.4.6. India Feldspar and Nepheline Syenite Market Volume (Kilo tons) and Value (US$ Mn) Forecast, by Application, 2020–2031
11.4.7. South Korea Feldspar and Nepheline Syenite Market Volume (Kilo tons) and Value (US$ Mn) Forecast, by Product, 2020–2031
11.4.8. South Korea Feldspar and Nepheline Syenite Market Volume (Kilo tons) and Value (US$ Mn) Forecast, by Application, 2020–2031
11.4.9. ASEAN Feldspar and Nepheline Syenite Market Volume (Kilo tons) and Value (US$ Mn) Forecast, by Product, 2020–2031
11.4.10. ASEAN Feldspar and Nepheline Syenite Market Volume (Kilo tons) and Value (US$ Mn) Forecast, by Application, 2020–2031
11.4.11. Rest of Asia Pacific Feldspar and Nepheline Syenite Market Volume (Kilo tons) and Value (US$ Mn) Forecast, by Product, 2020–2031
11.4.12. Rest of Asia Pacific Feldspar and Nepheline Syenite Market Volume (Kilo tons) and Value (US$ Mn) Forecast, by Application, 2020–2031
11.5. Asia Pacific Feldspar and Nepheline Syenite Market Attractiveness Analysis
12. Latin America Feldspar and Nepheline Syenite Market Analysis and Forecast, 2020–2031
12.1. Key Findings
12.2. Latin America Feldspar and Nepheline Syenite Market Volume (Kilo tons) and Value (US$ Mn) Forecast, by Product, 2020–2031
12.3. Latin America Feldspar and Nepheline Syenite Market Volume (Kilo tons) and Value (US$ Mn) Forecast, by Application, 2020–2031
12.4. Latin America Feldspar and Nepheline Syenite Market Volume (Kilo tons) and Value (US$ Mn) Forecast, by Country and Sub-region, 2020–2031
12.4.1. Brazil Feldspar and Nepheline Syenite Market Volume (Kilo tons) and Value (US$ Mn) Forecast, by Product, 2020–2031
12.4.2. Brazil Feldspar and Nepheline Syenite Market Volume (Kilo tons) and Value (US$ Mn) Forecast, by Application, 2020–2031
12.4.3. Mexico Feldspar and Nepheline Syenite Market Volume (Kilo tons) and Value (US$ Mn) Forecast, by Product, 2020–2031
12.4.4. Mexico Feldspar and Nepheline Syenite Market Volume (Kilo tons) and Value (US$ Mn) Forecast, by Application, 2020–2031
12.4.5. Rest of Latin America Feldspar and Nepheline Syenite Market Volume (Kilo tons) and Value (US$ Mn) Forecast, by Product, 2020–2031
12.4.6. Rest of Latin America Feldspar and Nepheline Syenite Market Volume (Kilo tons) and Value (US$ Mn) Forecast, by Application, 2020–2031
12.5. Latin America Feldspar and Nepheline Syenite Market Attractiveness Analysis
13. Middle East & Africa Feldspar and Nepheline Syenite Market Analysis and Forecast, 2020–2031
13.1. Key Findings
13.2. Middle East & Africa Feldspar and Nepheline Syenite Market Volume (Kilo tons) and Value (US$ Mn) Forecast, by Product, 2020–2031
13.3. Middle East & Africa Feldspar and Nepheline Syenite Market Volume (Kilo tons) and Value (US$ Mn) Forecast, by Application, 2020–2031
13.4. Middle East & Africa Feldspar and Nepheline Syenite Market Volume (Kilo tons) and Value (US$ Mn) Forecast, by Country and Sub-region, 2020–2031
13.4.1. GCC Feldspar and Nepheline Syenite Market Volume (Kilo tons) and Value (US$ Mn) Forecast, by Product, 2020–2031
13.4.2. GCC Feldspar and Nepheline Syenite Market Volume (Kilo tons) and Value (US$ Mn) Forecast, by Application, 2020–2031
13.4.3. South Africa nada Feldspar and Nepheline Syenite Market Volume (Kilo tons) and Value (US$ Mn) Forecast, by Product, 2020–2031
13.4.4. South Africa Feldspar and Nepheline Syenite Market Volume (Kilo tons) and Value (US$ Mn) Forecast, by Application, 2020–2031
13.4.5. Rest of Middle East & Africa Feldspar and Nepheline Syenite Market Volume (Kilo tons) and Value (US$ Mn) Forecast, by Product, 2020–2031
13.4.6. Rest of Middle East & Africa Feldspar and Nepheline Syenite Market Volume (Kilo tons) and Value (US$ Mn) Forecast, by Application, 2020–2031
13.5. Middle East & Africa Feldspar and Nepheline Syenite Market Attractiveness Analysis
14. Competition Landscape
14.1. Global Feldspar and Nepheline Syenite Company Market Share Analysis, 2020
14.2. Competition Matrix
14.3. Market Footprint Analysis
14.3.1. By Product
14.3.2. By Application
14.4. Company Profiles (Details – Overview, Financials, Recent Developments, and Strategy)
14.4.1. Anglo Pacific Minerals
14.4.1.1. Company Description
14.4.1.2. Business Overview
14.4.1.3. Financial Details
14.4.1.4. Strategic Overview
14.4.2. Covia Holdings LLC.
14.4.2.1. Company Description
14.4.2.2. Business Overview
14.4.2.3. Financial Details
14.4.2.4. Strategic Overview
14.4.3. The QUARTZ Corp
14.4.3.1. Company Description
14.4.3.2. Business Overview
14.4.4. Esan
14.4.4.1. Company Description
14.4.4.2. Business Overview
14.4.5. Imerys
14.4.5.1. Company Description
14.4.5.2. Business Overview
14.4.6. Pacer Minerals, LLC
14.4.6.1. Company Description
14.4.6.2. Business Overview
14.4.7. Minerali Industriali S.r.l.
14.4.7.1. Company Description
14.4.7.2. Business Overview
14.4.8. I-Minerals Inc.
14.4.8.1. Company Description
14.4.8.2. Business Overview
14.4.9. Sibelco
14.4.9.1. Company Description
14.4.9.2. Business Overview
14.4.10. ArrMaz
14.4.10.1. Company Description
14.4.10.2. Business Overview
15. Primary Research: Key Insights
16. Appendix
List of Tables
Table 1: Global Feldspar and Nepheline Syenite Market Volume (Kilo tons) Forecast, by Product, 2020–2031
Table 2: Global Feldspar and Nepheline Syenite Market Value (US$ Mn) Forecast, by Product, 2020–2031
Table 3: Global Feldspar and Nepheline Syenite Market Volume (Kilo tons) Forecast, by Application, 2020–2031
Table 4: Global Feldspar and Nepheline Syenite Market Value (US$ Mn) Forecast, by Application, 2020–2031
Table 5: Global Feldspar and Nepheline Syenite Market Volume (Kilo tons) Forecast, by Region, 2020–2031
Table 6: Global Feldspar and Nepheline Syenite Market Value (US$ Mn) Forecast, by Region, 2020–2031
Table 7: North America Feldspar and Nepheline Syenite Market Volume (Kilo tons) Forecast, by Product, 2020–2031
Table 8: North America Feldspar and Nepheline Syenite Market Value (US$ Mn) Forecast, by Product, 2020–2031
Table 9: North America Feldspar and Nepheline Syenite Market Volume (Kilo tons) Forecast, by Application, 2020–2031
Table 10: North America Feldspar and Nepheline Syenite Market Value (US$ Mn) Forecast, by Application, 2020–2031
Table 11: North America Feldspar and Nepheline Syenite Market Volume (Kilo tons) Forecast, by Country, 2020–2031
Table 12: North America Feldspar and Nepheline Syenite Market Value (US$ Mn) Forecast, by Country, 2020–2031
Table 13: U.S. Feldspar and Nepheline Syenite Market Volume (Kilo tons) Forecast, by Product, 2020–2031
Table 14: U.S. Feldspar and Nepheline Syenite Market Value (US$ Mn) Forecast, by Product, 2020–2031
Table 15: U.S. Feldspar and Nepheline Syenite Market Volume (Kilo tons) Forecast, by Application, 2020–2031
Table 16: U.S. Feldspar and Nepheline Syenite Market Value (US$ Mn) Forecast, by Application, 2020–2031
Table 17: Canada Feldspar and Nepheline Syenite Market Volume (Kilo tons) Forecast, by Product, 2020–2031
Table 18: Canada Feldspar and Nepheline Syenite Market Value (US$ Mn) Forecast, by Product, 2020–2031
Table 19: Canada Feldspar and Nepheline Syenite Market Volume (Kilo tons) Forecast, by Application, 2020–2031
Table 20: Canada Feldspar and Nepheline Syenite Market Value (US$ Mn) Forecast, by Application, 2020–2031
Table 21: Europe Feldspar and Nepheline Syenite Market Volume (Kilo tons) Forecast, by Product, 2020–2031
Table 22: Europe Feldspar and Nepheline Syenite Market Value (US$ Mn) Forecast, by Product, 2020–2031
Table 23: Europe Feldspar and Nepheline Syenite Market Volume (Kilo tons) Forecast, by Application, 2020–2031
Table 24: Europe Feldspar and Nepheline Syenite Market Value (US$ Mn) Forecast, by Application, 2020–2031
Table 25: Europe Feldspar and Nepheline Syenite Market Volume (Kilo tons) Forecast, by Country and Sub-region, 2020–2031
Table 26: Europe Feldspar and Nepheline Syenite Market Value (US$ Mn) Forecast, by Country and Sub-region, 2020–2031
Table 27: Germany Feldspar and Nepheline Syenite Market Volume (Kilo tons) Forecast, by Product, 2020–2031
Table 28: Germany Feldspar and Nepheline Syenite Market Value (US$ Mn) Forecast, by Product, 2020–2031
Table 29: Germany Feldspar and Nepheline Syenite Market Volume (Kilo tons) Forecast, by Application, 2020–2031
Table 30: Germany Feldspar and Nepheline Syenite Market Value (US$ Mn) Forecast, by Application, 2020–2031
Table 31: U.K. Feldspar and Nepheline Syenite Market Volume (Kilo tons) Forecast, by Product, 2020–2031
Table 32: U.K. Feldspar and Nepheline Syenite Market Value (US$ Mn) Forecast, by Product, 2020–2031
Table 33: U.K. Feldspar and Nepheline Syenite Market Volume (Kilo tons) Forecast, by Application, 2020–2031
Table 34: U.K. Feldspar and Nepheline Syenite Market Value (US$ Mn) Forecast, by Application, 2020–2031
Table 35: France Feldspar and Nepheline Syenite Market Volume (Kilo tons) Forecast, by Product, 2020–2031
Table 36: France Feldspar and Nepheline Syenite Market Value (US$ Mn) Forecast, by Product, 2020–2031
Table 37: France Feldspar and Nepheline Syenite Market Volume (Kilo tons) Forecast, by Application, 2020–2031
Table 38: France Feldspar and Nepheline Syenite Market Value (US$ Mn) Forecast, by Application, 2020–2031
Table 39: Italy Feldspar and Nepheline Syenite Market Volume (Kilo tons) Forecast, by Product, 2020–2031
Table 40: Italy Feldspar and Nepheline Syenite Market Value (US$ Mn) Forecast, by Product, 2020–2031
Table 41: Italy Feldspar and Nepheline Syenite Market Volume (Kilo tons) Forecast, by Application, 2020–2031
Table 42: Italy Feldspar and Nepheline Syenite Market Value (US$ Mn) Forecast, by Application, 2020–2031
Table 43: Spain Feldspar and Nepheline Syenite Market Volume (Kilo tons) Forecast, by Product, 2020–2031
Table 44: Spain Feldspar and Nepheline Syenite Market Value (US$ Mn) Forecast, by Product, 2020–2031
Table 45: Spain Feldspar and Nepheline Syenite Market Volume (Kilo tons) Forecast, by Application, 2020–2031
Table 46: Spain Feldspar and Nepheline Syenite Market Value (US$ Mn) Forecast, by Application, 2020–2031
Table 47: Russia & CIS Feldspar and Nepheline Syenite Market Volume (Kilo tons) Forecast, by Product, 2020–2031
Table 48: Russia & CIS Feldspar and Nepheline Syenite Market Value (US$ Mn) Forecast, by Product, 2020–2031
Table 49: Russia & CIS Feldspar and Nepheline Syenite Market Volume (Kilo tons) Forecast, by Application, 2020–2031
Table 50: Russia & CIS Feldspar and Nepheline Syenite Market Value (US$ Mn) Forecast, by Application, 2020–2031
Table 51: Rest of Europe Feldspar and Nepheline Syenite Market Volume (Kilo tons) Forecast, by Product, 2020–2031
Table 52: Rest of Europe Feldspar and Nepheline Syenite Market Value (US$ Mn) Forecast, by Product, 2020–2031
Table 53: Rest of Europe Feldspar and Nepheline Syenite Market Volume (Kilo tons) Forecast, by Application, 2020–2031
Table 54: Rest of Europe Feldspar and Nepheline Syenite Market Value (US$ Mn) Forecast, by Application, 2020–2031
Table 55: Asia Pacific Feldspar and Nepheline Syenite Market Volume (Kilo tons) Forecast, by Product, 2020–2031
Table 56: Asia Pacific Feldspar and Nepheline Syenite Market Value (US$ Mn) Forecast, by Product, 2020–2031
Table 57: Asia Pacific Feldspar and Nepheline Syenite Market Volume (Kilo tons) Forecast, by Application, 2020–2031
Table 58: Asia Pacific Feldspar and Nepheline Syenite Market Value (US$ Mn) Forecast, by Application, 2020–2031
Table 59: Asia Pacific Feldspar and Nepheline Syenite Market Volume (Kilo tons) Forecast, by Country and Sub-region, 2020–2031
Table 60: Asia Pacific Feldspar and Nepheline Syenite Market Value (US$ Mn) Forecast, by Country and Sub-region, 2020–2031
Table 61: China Feldspar and Nepheline Syenite Market Volume (Kilo tons) Forecast, by Product, 2020–2031
Table 62: China Feldspar and Nepheline Syenite Market Value (US$ Mn) Forecast, by Product, 2020–2031
Table 63: China Feldspar and Nepheline Syenite Market Volume (Kilo tons) Forecast, by Application, 2020–2031
Table 64: China Feldspar and Nepheline Syenite Market Value (US$ Mn) Forecast, by Application, 2020–2031
Table 65: Japan Feldspar and Nepheline Syenite Market Volume (Kilo tons) Forecast, by Product, 2020–2031
Table 66: Japan Feldspar and Nepheline Syenite Market Value (US$ Mn) Forecast, by Product, 2020–2031
Table 67: Japan Feldspar and Nepheline Syenite Market Volume (Kilo tons) Forecast, by Application, 2020–2031
Table 68: Japan Feldspar and Nepheline Syenite Market Value (US$ Mn) Forecast, by Application, 2020–2031
Table 69: India Feldspar and Nepheline Syenite Market Volume (Kilo tons) Forecast, by Product, 2020–2031
Table 70: India Feldspar and Nepheline Syenite Market Value (US$ Mn) Forecast, by Product, 2020–2031
Table 71: India Feldspar and Nepheline Syenite Market Volume (Kilo tons) Forecast, by Application, 2020–2031
Table 72: India Feldspar and Nepheline Syenite Market Value (US$ Mn) Forecast, by Application, 2020–2031
Table 73: ASEAN Feldspar and Nepheline Syenite Market Volume (Kilo tons) Forecast, by Product, 2020–2031
Table 74: ASEAN Feldspar and Nepheline Syenite Market Value (US$ Mn) Forecast, by Product, 2020–2031
Table 75: ASEAN Feldspar and Nepheline Syenite Market Volume (Kilo tons) Forecast, by Application, 2020–2031
Table 76: ASEAN Feldspar and Nepheline Syenite Market Value (US$ Mn) Forecast, by Application, 2020–2031
Table 77: South Korea Feldspar and Nepheline Syenite Market Volume (Kilo tons) Forecast, by Product, 2020–2031
Table 78: South Korea Feldspar and Nepheline Syenite Market Value (US$ Mn) Forecast, by Product, 2020–2031
Table 79: South Korea Feldspar and Nepheline Syenite Market Volume (Kilo tons) Forecast, by Application, 2020–2031
Table 80: South Korea Feldspar and Nepheline Syenite Market Value (US$ Mn) Forecast, by Application, 2020–2031
Table 81: Rest of Asia Pacific Feldspar and Nepheline Syenite Market Volume (Kilo tons) Forecast, by Product, 2020–2031
Table 82: Rest of Asia Pacific Feldspar and Nepheline Syenite Market Value (US$ Mn) Forecast, by Product, 2020–2031
Table 83: Rest of Asia Pacific Feldspar and Nepheline Syenite Market Volume (Kilo tons) Forecast, by Application, 2020–2031
Table 84: Rest of Asia Pacific Feldspar and Nepheline Syenite Market Value (US$ Mn) Forecast, by Application, 2020–2031
Table 85: Latin America Feldspar and Nepheline Syenite Market Volume (Kilo tons) Forecast, by Product, 2020–2031
Table 86: Latin America Feldspar and Nepheline Syenite Market Value (US$ Mn) Forecast, by Product, 2020–2031
Table 87: Latin America Feldspar and Nepheline Syenite Market Volume (Kilo tons) Forecast, by Application, 2020–2031
Table 88: Latin America Feldspar and Nepheline Syenite Market Value (US$ Mn) Forecast, by Application, 2020–2031
Table 89: Latin America Feldspar and Nepheline Syenite Market Volume (Kilo tons) Forecast, by Country and Sub-region, 2020–2031
Table 90: Latin America Feldspar and Nepheline Syenite Market Value (US$ Mn) Forecast, by Country and Sub-region, 2020–2031
Table 91: Brazil Feldspar and Nepheline Syenite Market Volume (Kilo tons) Forecast, by Product, 2020–2031
Table 92: Brazil Feldspar and Nepheline Syenite Market Value (US$ Mn) Forecast, by Product, 2020–2031
Table 93: Brazil Feldspar and Nepheline Syenite Market Volume (Kilo tons) Forecast, by Application, 2020–2031
Table 94: Brazil Feldspar and Nepheline Syenite Market Value (US$ Mn) Forecast, by Application, 2020–2031
Table 95: Mexico Feldspar and Nepheline Syenite Market Volume (Kilo tons) Forecast, by Product, 2020–2031
Table 96: Mexico Feldspar and Nepheline Syenite Market Value (US$ Mn) Forecast, by Product, 2020–2031
Table 97: Mexico Feldspar and Nepheline Syenite Market Volume (Kilo tons) Forecast, by Application, 2020–2031
Table 98: Mexico Feldspar and Nepheline Syenite Market Value (US$ Mn) Forecast, by Application, 2020–2031
Table 99: Rest of Latin America Feldspar and Nepheline Syenite Market Volume (Kilo tons) Forecast, by Product, 2020–2031
Table 100: Rest of Latin America Feldspar and Nepheline Syenite Market Value (US$ Mn) Forecast, by Product, 2020–2031
Table 101: Rest of Latin America Feldspar and Nepheline Syenite Market Volume (Kilo tons) Forecast, by Application, 2020–2031
Table 102: Rest of Latin America Feldspar and Nepheline Syenite Market Value (US$ Mn) Forecast, by Application, 2020–2031
Table 103: Middle East & Africa Feldspar and Nepheline Syenite Market Volume (Kilo tons) Forecast, by Product, 2020–2031
Table 104: Middle East & Africa Feldspar and Nepheline Syenite Market Value (US$ Mn) Forecast, by Product, 2020–2031
Table 105: Middle East & Africa Feldspar and Nepheline Syenite Market Volume (Kilo tons) Forecast, by Application, 2020–2031
Table 106: Middle East & Africa Feldspar and Nepheline Syenite Market Value (US$ Mn) Forecast, by Application, 2020–2031
Table 107: Middle East & Africa Feldspar and Nepheline Syenite Market Volume (Kilo tons) Forecast, by Country and Sub-region, 2020–2031
Table 108: Middle East & Africa Feldspar and Nepheline Syenite Market Value (US$ Mn) Forecast, by Country and Sub-region, 2020–2031
Table 109: GCC Feldspar and Nepheline Syenite Market Volume (Kilo tons) Forecast, by Product, 2020–2031
Table 110: GCC Feldspar and Nepheline Syenite Market Value (US$ Mn) Forecast, by Product, 2020–2031
Table 111: GCC Feldspar and Nepheline Syenite Market Volume (Kilo tons) Forecast, by Application, 2020–2031
Table 112: GCC Feldspar and Nepheline Syenite Market Value (US$ Mn) Forecast, by Application, 2020–2031
Table 113: South Africa Feldspar and Nepheline Syenite Market Volume (Kilo tons) Forecast, by Product, 2020–2031
Table 114: South Africa Feldspar and Nepheline Syenite Market Value (US$ Mn) Forecast, by Product, 2020–2031
Table 115: South Africa Feldspar and Nepheline Syenite Market Volume (Kilo tons) Forecast, by Application, 2020–2031
Table 116: South Africa Feldspar and Nepheline Syenite Market Value (US$ Mn) Forecast, by Application, 2020–2031
Table 117: Rest of Middle East & Africa Feldspar and Nepheline Syenite Market Volume (Kilo tons) Forecast, by Product, 2020–2031
Table 118: Rest of Middle East & Africa Feldspar and Nepheline Syenite Market Value (US$ Mn) Forecast, by Product, 2020–2031
Table 119: Rest of Middle East & Africa Feldspar and Nepheline Syenite Market Volume (Kilo tons) Forecast, by Application, 2020–2031
Table 120: Rest of Middle East & Africa Feldspar and Nepheline Syenite Market Value (US$ Mn) Forecast, by Application, 2020–2031
List of Figures
Figure 1: Global Feldspar and Nepheline Syenite Price Trend, by Application, 2020–2031 (US$/Ton)
Figure 2: Global Feldspar and Nepheline Syenite Price Trend, by Region, 2020–2031 (US$/Ton)
Figure 3: Global Feldspar and Nepheline Syenite Market Volume Share, by Product, 2020, 2025, and 2031
Figure 4: Global Feldspar and Nepheline Syenite Market Attractiveness, by Product
Figure 5: Global Feldspar and Nepheline Syenite Market Volume Share, by Application, 2020, 2025, and 2031
Figure 6: Global Feldspar and Nepheline Syenite Market Attractiveness, by Application
Figure 7: Global Feldspar and Nepheline Syenite Market Volume Share, by Region, 2020, 2025, and 2031
Figure 8: Global Feldspar and Nepheline Syenite Market Attractiveness, by Region
Figure 9: North America Feldspar and Nepheline Syenite Market Volume Share, by Product, 2020, 2025, and 2031
Figure 10: North America Feldspar and Nepheline Syenite Market Attractiveness, by Product
Figure 11: North America Feldspar and Nepheline Syenite Market Volume Share, by Application, 2020, 2025, and 2031
Figure 12: North America Feldspar and Nepheline Syenite Market Attractiveness, by Application
Figure 13: North America Feldspar and Nepheline Syenite Market Volume Share, by Country, 2020, 2025, and 2031
Figure 14: North America Feldspar and Nepheline Syenite Market Attractiveness, by Country
Figure 15: Europe Feldspar and Nepheline Syenite Market Volume Share, by Product, 2020, 2025, and 2031
Figure 16: Europe Feldspar and Nepheline Syenite Market Attractiveness, by Product
Figure 17: Europe Feldspar and Nepheline Syenite Market Volume Share, by Application, 2020, 2025, and 2031
Figure 18: Europe Feldspar and Nepheline Syenite Market Attractiveness, by Application
Figure 19: Europe Feldspar and Nepheline Syenite Market Volume Share, by Country and Sub-region, 2020, 2025, and 2031
Figure 20: Europe Feldspar and Nepheline Syenite Market Attractiveness, by Country and Sub-region
Figure 21: Asia Pacific Feldspar and Nepheline Syenite Market Volume Share, by Product, 2020, 2025, and 2031
Figure 22: Asia Pacific Feldspar and Nepheline Syenite Market Attractiveness, by Product
Figure 23: Asia Pacific Feldspar and Nepheline Syenite Market Volume Share, by Application, 2020, 2025, and 2031
Figure 24: Asia Pacific Feldspar and Nepheline Syenite Market Attractiveness, by Application
Figure 25: Asia Pacific Feldspar and Nepheline Syenite Market Volume Share, by Country and Sub-region, 2020, 2025, and 2031
Figure 26: Asia Pacific Feldspar and Nepheline Syenite Market Attractiveness, by Country and Sub-region
Figure 27: Latin America Feldspar and Nepheline Syenite Market Volume Share, by Product, 2020, 2025, and 2031
Figure 28: Latin America Feldspar and Nepheline Syenite Market Attractiveness, by Product
Figure 29: Latin America Feldspar and Nepheline Syenite Market Volume Share, by Application, 2020, 2025, and 2031
Figure 30: Latin America Feldspar and Nepheline Syenite Market Attractiveness, by Application
Figure 31: Latin America Feldspar and Nepheline Syenite Market Volume Share, by Country and Sub-region, 2020, 2025, and 2031
Figure 32: Latin America Feldspar and Nepheline Syenite Market Attractiveness, by Country and Sub-region
Figure 33: Middle East & Africa Feldspar and Nepheline Syenite Market Volume Share, by Product, 2020, 2025, and 2031
Figure 34: Middle East & Africa Feldspar and Nepheline Syenite Market Attractiveness, by Product
Figure 35: Middle East & Africa Feldspar and Nepheline Syenite Market Volume Share, by Application, 2020, 2025, and 2031
Figure 36: Middle East & Africa Feldspar and Nepheline Syenite Market Attractiveness, by Application
Figure 37: Middle East & Africa Feldspar and Nepheline Syenite Market Volume Share, by Country and Sub-region, 2020, 2025, and 2031
Figure 38: Middle East & Africa Feldspar and Nepheline Syenite Market Attractiveness, by Country and Sub-region
Figure 39: Global Feldspar and Nepheline Syenite Market Share Analysis, by Company, 2020
Copyright © Transparency Market Research, Inc. All Rights reserved
Trust Online

Feldspar and Nepheline Syenite Market