
Reports
Reports
Europe Peat Market: Snapshot
Peat is being used since the 17th century, majorly as an energy fuel until a few years ago, and continues to be used across a number of application areas. Peat finds applications in the horticulture and agriculture sectors owing to its rich organic properties, providing excellent aeration and moisture when used with soil. However, rising environmental concerns and concerns related to commercial rate of extraction of peat have started to significantly diminish the growth opportunities of the overall market for peat across the globe.
In Europe, which is the world’s leading consumer of the organic matter, the demand for peat has been sluggish over the years and continues to remain slow. Countries in the region that relied on peat as an energy fuel for their national energy demand have cut down on their peat consumption to more than 50% and are expected to further bring the volumes down in the near future. Transparency Market Research estimates that the Europe market for peat will exhibit a meagre 0.6% CAGR over the period between 2016 and 2024, generating a revenue opportunity of US$2.13 bn by 2024, only a slight rise from US$2.05 bn in 2015.
Hemic Peat to Remain Most Consumed Product Variety
In terms of type, the report segments the Europe peat market into sapric, hemic, and fibric. Of these, the segment of hemic peat dominated the Europe peat market in 2015, accounting for over 45% of the overall market. Hemic is a partially decomposed organic material and often has the look and feel of mature compost. Hemic material has rubbed fiber content of 17% to 40%. The segment is anticipated to retain its dominance over the report’s forecast period as well, owing to the vast usage of this variety of peat in horticulture and agriculture sectors.
The segment of sapric peat closely followed hemic peat in 2015 and is expected to retain its position over the report’s forecast period as well, exhibiting a 0.5% CAGR from 2016 to 2024. The segment of fibric peat is expected to be the least promising product segment over the forecast period, exhibiting a mere 0.1% CAGR from 2016 to 2024. Fibric peat can replace many natural fibres in sustainable manner without having to produce fibre corps on agricultural land. Peat as a fibre helps conserve wood as a fibre for other uses. Fibric Peat possess many anti-bacterial properties, excellent moisture and tolerance. However, the increased inclination of consumers towards other alternatives is expected to drastically affect the overall consumption of fibric peat in Europe over the said period.
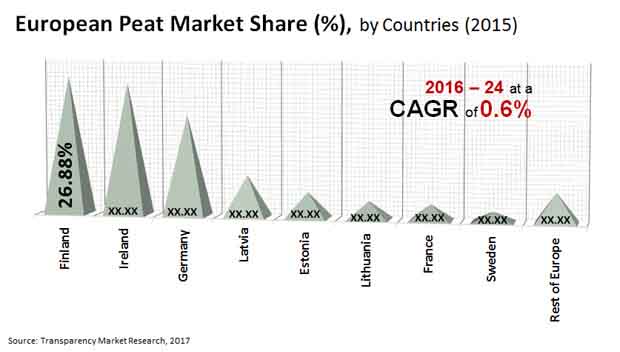
Finland to Remain Key Contributor of Revenue to Europe Peat Market
In terms of volume, Finland is the largest producers and one of the leading consumers of peat in Europe as its geographical location and climatic conditions favor maximum peat production. Finland is expected to will continue its current consumption trend with a sluggish growth during the forecast period. The country has many power plants and central district heating boilers fueled with peat in addition to other substitutes as wood and biomass.
Sweden, Germany, and Ireland are also key contributors of revenue to the Europe peat market, with Sweden possessing extensive peat resources that are expected to last hundreds of years when present production rates are considered. While most other countries possess low volumes of resources, the volume is considerably higher as compared to the usage pattern of present times in countries such as Latvia and Lithuania.
Some of the leading companies operating in the Europe peat market are Bord na Mona, Klassmann Dielmann, Vapo Oy, Oulun Energia, and Neova Ab.
Increasing Popularity if Bio-Fuels Propels Growth in Peat Market
Rising concerns regarding the environmental effects of using conventional fossil fuels to generate power have resulted in increased efforts to make renewable energy sources available and easily accessible. Growing reputation of peat as a good source of renewable energy is anticipated to favor the development of the global peat market in near future. Various governments around the world have started promoting and in some way enforcing the usage of energy derived or generated through renewable energy sources. This has resulted in increase in the popularity of alternative fuel and energy sources such as solar, wind, and bio-gas. Players and manufacturers in the global peat market re developing various bio-based peat products to meet the rising demand for bio-fuels. This trend is expected to favor the upward trajectory of global peat market in coming years. Growing global population is directly responsible for the growing need for electricity generation. Integration of bio fuel energy generation technologies in electricity generation can provide attractive opportunities for the stakeholders in the global peat market.
Key drivers for the global peat market include rising demand for products in global peat market from a variety of end-use industries such as alcoholic beverages, horticulture, waste water treatment, and agriculture. Moreover, rising consumer interest for natural and affordable soil conditioners can bolster the growth of global peat market in coming years. However, the classification of the products in the global peat market as ‘slow renewable fuel’ by manufacturers and Intergovernmental Panel on Climate Change (IPCC) may cause a slowdown in the industry in the coming few years. Players and manufacturers in the global peat market are exploring various organic and inorganic strategies to expand their footprint in the global industry landscape. Organic growth strategies employed by prominent players in the global peat market include new product launches, product innovation efforts, product approvals, acquiring product patents, and organizing promotional events and marketing campaigns. Inorganic growth strategies undertaken by some of the major players in global peat market include mergers and acquisitions, strategic partnerships, and collaborations or contractual partnerships.
Europe Peat Market is expected to reach US$2.13 bn by the end of 2024
Europe Peat Market is estimated to rise at a CAGR of 0.6% during forecast period
Growing reputation of peat as a good source of renewable energy is anticipated to favor the development of the peat market in near future
Some of the leading companies operating in the Europe peat market are Bord na Mona, Klassmann Dielmann, Vapo Oy, Oulun Energia, and Neova Ab.
Power Generation, Agriculture, Freshwater Aquaria, Water Filtration are the end-use segments in the Europe Peat Market
1 Preface
1.1 Market Definition and Scope
1.2 Market Segmentation
1.3 Key Research Objectives
1.4 Research Highlights
2 Assumptions and Research Methodology
3 Executive Summary
4 Market Overview
4.1 Introduction
4.1.1 Definition
4.1.2 Industry Evolution / Developments
4.2 Power Generation Overview
4.3 Key Market Indicators
4.3.1 Growing Demand for Electricity Generation
4.3.2 Bio-based Peat Products
4.3.3 Peat Market – Europe Scenario
4.4 Market Dynamics
4.4.1 Drivers
4.4.2 Restraints
4.4.3 Opportunity
4.5 Europe Peat Market Analysis and Forecasts, 2015–2024
4.5.1 Market Volume Projections, 2015–2024
4.5.2 Pricing - Actuals and Projections, 2015–2024
4.5.3 Market Revenue Projections (US$)
4.6 Peat Market - Europe Supply Demand Scenario
4.7 Porter’s Five Force Analysis
4.8 Value Chain Analysis
4.8.1 List of active market participants (suppliers/distributors/manufacturers/vendors)
4.8.1.1 Land Acquisition/Extraction
4.8.1.2 Equipment & Service Providers
4.8.1.3 Exploration, Crushing & Processing
4.9 Market Outlook
5 Europe Peat Market Analysis and Forecasts, By Material Type
5.1 Introduction & Definition
5.2 Key Findings / Developments
5.3 Key Trends
5.4 Market Value Forecast By Material Type , 2015–2024
5.4.1 Sapric
5.4.2 Hemic
5.4.3 Fibric
5.5 Material Type Comparison Matrix
5.6 Market Attractiveness By Material Type
6 Europe Peat Market Analysis and Forecasts, By End Use
6.1 Introduction & Definition
6.2 Key Findings / Developments
6.3 Key Trends
6.4 Market Value Forecast By End Use , 2015–2024
6.4.1 Power Generation
6.4.2 Agriculture
6.4.3 Freshwater Aquaria
6.4.4 Water Filtration
6.4.5 Others
6.5 End-use Comparison Matrix
6.6 Market Attractiveness By End Use
7 Europe Peat Market Analysis and Forecasts, By Country
7.1 Key Findings
7.2 Policies and Regulations
7.3 Market Value Forecast By Country
7.3.1 Germany
7.3.2 France
7.3.3 Ireland
7.3.4 Finland
7.3.5 Latvia
7.3.6 Lithuania
7.3.7 Estonia
7.3.8 Sweden
7.3.9 Rest of Europe
7.4 Market Attractiveness By Country
8 Competition Landscape
8.1 Market Player – Competition Matrix (By Tier and Size of companies)
8.2 Market Share Analysis By Company (2015)
8.3 Company Profiles
8.3.1 Bord na Móna PLC
8.3.2 Klasmann Deilmann GmbH
8.3.3 Oulun Energia Group
8.3.4 Vapo Oy
8.3.5 Neova AB
8.3.6 AS Tootsi Turvas
8.3.7 AB R?kyva
8.3.8 Stender Ag
8.3.9 Elva E.P.T Ltd
8.3.10 Global Peat Ltd
9 Key Takeaway
List of Tables
Table 01 : Europe Peat Market Size (US$ Mn) Forecast, by Material Type, 2015–2024
Table 02 : Europe Peat Market Size (US$ Mn) Forecast, by End-use, 2015–2024
Table 03 : Europe Peat Market Size (US$ Mn) Forecast, by Country, 2015–2024
Table 04 : Material Type Comparison Matrix
Table 05 : End-use Comparison Matrix
List of Figures
Figure 01 Europe Peat Market Size, 2015–2024
Figure 02 Europe Peat Market Size (US$ Mn), by Material Type 2015–2024
Figure 03 Europe Peat Market Size (US$ Mn), by Material Type 2015–2024
Figure 04 Market Value Share, by Type, 2016
Figure 05 Market Value Share, by End-use, 2016
Figure 06 Market Value Share, by Country, 2016
Figure 07 Europe Peat Market Size (US$ Mn), by Material Type 2015–2024
Figure 08 Europe Peat Market Size (US$ Mn), by Material Type 2015–2024
Figure 09 Europe Peat Market Size (US$ Mn), by Material Type 2015–2024
Figure 10 Europe Peat Market Attractiveness Analysis, by Type
Figure 11 Europe Peat Market Size (US$ Mn), by End-use 2015–2024
Figure 12 Europe Peat Market Size (US$ Mn), by End-use 2015–2024
Figure 13 Europe Peat Market Size (US$ Mn), by End-use 2015–2024
Figure 14 Europe Peat Market Size (US$ Mn), by End-use 2015–2024
Figure 15 Europe Peat Market Size (US$ Mn), by End-use 2015–2024
Figure 16 Europe Peat Market Attractiveness Analysis, by End-use
Figure 17 Europe Peat Market Size (US$ Mn), by Country 2015–2024
Figure 18 Europe Peat Market Size (US$ Mn), by Country 2015–2024
Figure 19 Europe Peat Market Size (US$ Mn), by Country 2015–2024
Figure 20 Europe Peat Market Size (US$ Mn), by Country 2015–2024
Figure 21 Europe Peat Market Size (US$ Mn), by Country 2015–2024
Figure 22 Europe Peat Market Size (US$ Mn), by Country 2015–2024
Figure 23 Europe Peat Market Size (US$ Mn), by Country 2015–2024
Figure 24 Europe Peat Market Size (US$ Mn), by Country 2015–2024
Figure 25 Europe Peat Market Size (US$ Mn), by Country 2015–2024
Figure 26 Europe Peat Market Attractiveness Analysis, by Country
Figure 27 Peat Market Share Analysis, by Company Revenue
Copyright © Transparency Market Research, Inc. All Rights reserved
Trust Online

Europe Peat Market Forecast 2016 - 2024